ZCH21-Technical'sMarch 2021 U.S Corn: Weekly Chart
*considering such tight U.S corn c/o, bullish fundamental narrative has not changed.
*focus is on SAM weather issues / logistical problems in SAM
Price Target: 640'0 | BULLISH OUTLOOK
-not surprised to see recent liquidation w/ m.m crts net longs close to 350K and at record-high. M.M making substantial gains recently w/ most of pos. initiating before bullish USDA report during Jan 11.-(which showed a surprise in most grain's and exceeded most trade guess highs )
Studies: RSI, ATR, Volume
ZC1! trade ideas
Traditional|ZC1!|Long and shortLong and short ZC1!
Activation of the transaction only when the blue zone is fixed/broken.
Working out the support and resistance levels of the consolidation zone.
* Possible closing of a trade before reaching the take/stop zone.
The "forecast" tool is used for more noticeable display of % (for the place of the usual % scale) of the price change, I do not put the date and time of the transaction, only %.
The breakdown of the upper blue zone - long.
Breakdown of the lower blue zone - short.
Working out the stop when the price returns to the level after activation + fixing in the red zone.
Blue zones - activation zones.
Green zone - take zone.
Red zone - stop zone (S-SL short stop, L-SL long stop).
Orange arrows indicate the direction of the take.
Red arrows indicate the direction of the stop.
P.S Please use RM (risk management) and MM (money management) if you decide to use my ideas, there will always be unprofitable ideas, this will definitely happen, the goal of the system is that there will be more profitable ideas at a distance.
ZC Coiling up for next moveAfter this week's WASDE report, ZC limited up on 1/12. After the expected retracement, ZC has been trading in a range from 527-537.
POC is located at 534, I am expecting a retest of the high of 541'4 in the coming weeks. However, any break below 522'0 would indicate short term weakness.
Long term target of 560'0 by early Spring.
Current Corn StructureTop: Monthly Corn (2012-Present) Green box illustrates the current Harvest rally. Currently Corn is up 63% from its August Low, matching the 03/04 rally.
The next target above at the 38% retracement of 5.07. **06/07 and 07/08 rallies illustrated above**
Middle: US Dollar- US Dollar is trending lower, but the path forward is up for much debate. Higher or Lower???
Bottom : COT / Funds & Commercials – The Funds are Long and the Commercials are Short. We rarley see the Commercials this short In a strong carry market with an abundant supply, especially this time of year. The 03/04 market had the commercials eventually lifting their shorts and followed up with the next couple of years trading in the range that precluded the 03/04 rally. The 07/08 rally kicked off a multi year bull market. Funds long and Commercials remained Short…
Upside is unmeasurable, but Bulls proceed with caution. The first run out of a multi year bear, usually isn’t as strong as the later years in a multi year bull.
Continuous Corn Then to NowTop: Monthly Corn - Green boxes illustrate Harvest rallies from Aug into the next year. The dark green boxes below represent the end of each rally. Strength of rally’s depend on strengh or weakness of dollar and money flows from the funds and (more importantly) hedge activity from the commercials.
Middle: US Dollar- Strong $ discourages a healthy US export market. Slows demand. Weak dollar strengthens the grain markets
Bottom : COT / Funds & Commercials – Weak dollar spurs export demand. Demand creates volatility & higher prices. All of which work together to engage the producers selling. The commercials buy the physical (offsetting with short hedges), and the speculators riding the waves. At times the commercials get caught with sudden strong demand or short crop. Commercials can remain short for extended periods until the next supply build. Funds stay Long
After pullback, long ZCStrong technical upward trend last few weeks on ZC which broke price levels not seen since 2014. Expect some volatility going into next week's WASDE report on 1/12/21. From a fundamental side, current La Nina weather pattern in the Pacific could impact South American crop production.
After a pullback, I am anticipating this trend to continue. Targeting mid to upper 500's by February/March.
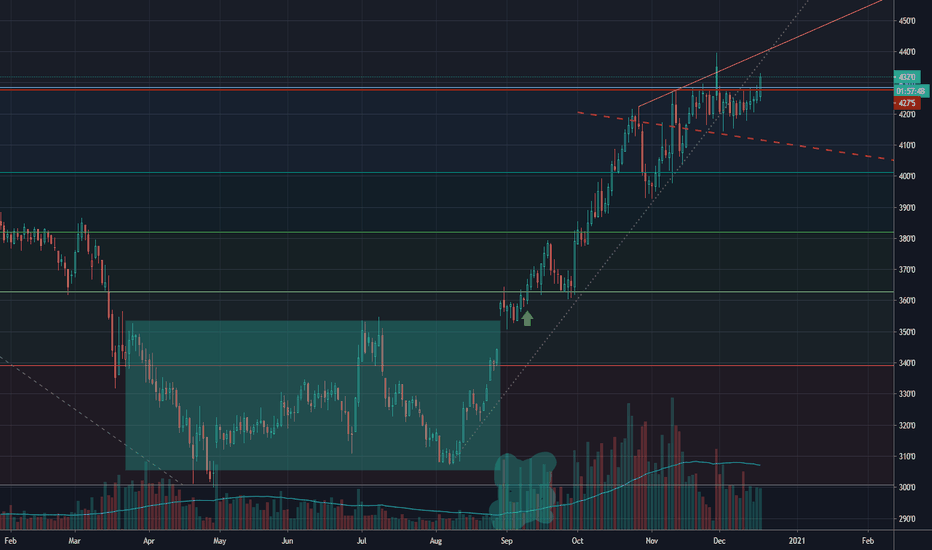
Corn futures ZC - EW analysis - Buy after correction Corn futures - ZC - It is about to finish the 3rd of C wave up and expecting correction thereafter as sharp down. Buy the correction near 431 level for higher high as target above 455 as final move up of C wave.
Give thumbs up if you really like the trade idea.
Long C H1 as it is both bullish in FA & TACorn continues to trade along the lower end of the trend channel. Both daily and weeklies are still on the uptrend but watch carefully as some of the momentum indicators continue to flatten.
On the fundamental side, erratic weather patterns in South America and continuous large demand from the Chinese continue the bullish case for the corn and the grains complex. My initial TP on the trade is around 4.50 for starters, entry is 4.25, and stop loss level is set at 4.20. Thinking of an R-Multiple of 5. Though as soon as the trade goes my way, will lift my stops to breakeven.


