Corn shortThe breakout level of the last breakout move has beed broken, so I go short, stop on the last peak, RR is quite nice.
ZC1! trade ideas

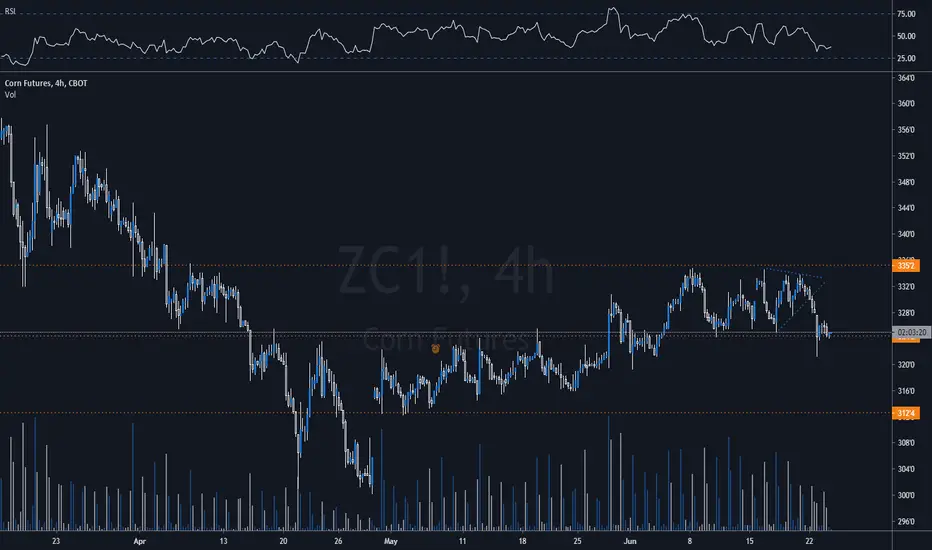
ZC JULY SHORTWeekly is long, Daily is short, so there is no sync in the trends, but it can change now. If price closes below the levels here (on H4), there is a short opportunity. RSI uptrend broken already.

CORN ON 30MINhi everyone you can see it on the 30 min chart on corn and on a trading range tomorrow the market opening is going to be up

Trading plan for CORN future - Short Strategy – ZC1The market goes back down but a major resistance could limit the fall
And don ‘t forget to take your profits…


Trading plan for CORN - Short Strategy – ZC1Zone Sell : 328
Target : 326
And don't forget to take your profits...


Corn : Long ==> + % 3.83Parameters
Position Size : %1 (0.01)
Leverage : 50x
Risk/Reward Ratio : 3.00
Stop-Loss : 328.2
Goal : 345.2
Regards.


corn - longCorn has managed to break out of the base it has formed for weeks. Trade - buy 331.6 with sl at 324.8.


Broke the Triangle, ready to go higherCorn futures have broken through the resistance of the triangle base is now poised for a large rally. Prices of Corn futures have not been this low since the 2016 commodity crash, giving us a nice risk/reward ratio.


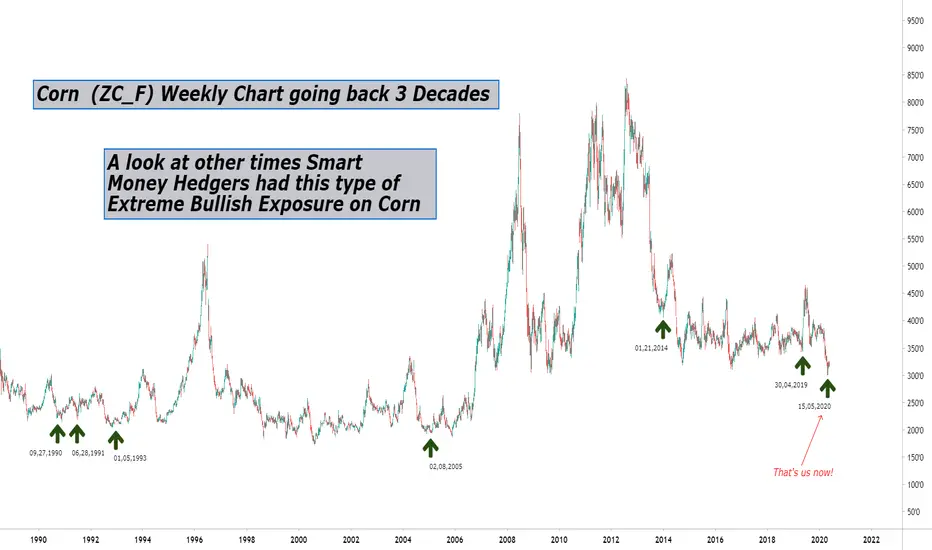
Follow the Corn Smart Money?
It typically pays to follow the Smart Money Hedgers once they reach an extreme. They don’t always get it right, but they do more times than not. Here’s a theory: If you were to base your portfolio solely on following the Smart Money once they reach an extreme (of course applying risk management, and applying a great deal of patience) your portfolio will most likely be in profit over time.
Anyway back to Corn, let's look at the downsides, first, off we are back at the September 2009 lows and in a heavy downtrend. The weekly chart shows signs of a ‘Dead Cat Bounce’ in play, which typically are short-lived before the downside resumes. How reliable are Dead Cat Bounces… Hard to say, we don’t often hear that term nowadays it’s becoming unfashionable, but if you can get past the silly phrase it could be used as an indicator for your research I suppose.
As well as the bouncing cat, we are holding below our 200 periods moving average on what I like to consider the more important time frames, 4hr, Day, Week & Month. (since I like to hold Commodities for at least the medium term, up to 12 weeks). Seasonality over the coming few months is also looking suspect, as these are usually (based on a few decades of data) poor-performing months. But I wouldn’t pay too much attention to this as seasonality can be a debatable topic at the best of times.
The upsides to buying Corn (depending on your time horizon) are actually quite convincing. First off the Smart Money is buying, as mentioned earlier it does pay to follow them. And at the same time Retail traders are very pessimistic about future prices, meaning there betting on a further decline. Now If that’s not a buy signal I don’t know what is, especially the latter! Retail traders seem to love getting it wrong at turning points, they just can't stop clicking that sell button when there’s no one left to sell to or their buy button when they should be back on their sell button. It’s cruel I know, but we need them to keep being wrong. Surprisingly to most novice traders or not so surprising, those 2 fundamental points (sentiment amongst market participants) are what's actually going to drive prices higher or lower. Personally I'm with the Bulls on this one...
Even so we have to consider the technical outlook. On the Daily time frame, a Bollinger Squeeze is in play, I have to admit I do like a Bolly squeeze as it can help to determine when a particular asset is about to fire. Standard Indicators that work just as well as all the others, such as the MACD & RSI, are showing signs of curling from their bottoms, more so on the weekly time frame, which is suitable for a medium-term hold. On the lower time frames 1, 2 & 3hr all are holding above the popular moving averages, 3, 5, 10, 20, 50, 100 & 200. And on the Daily time frame the 20 period moving average seems to be providing nice support. Just below that 20 period moving average we have trend line support taken from the lows of Tuesday 21st April this year, where prices began to range and consolidate, creating this Bollinger Band squeeze we are seeing. The next major resistance level to watch out for comes in at 327.0 (currently 319.0)
So with all that in mind, what’s the play on this one? Personally I need a little more convincing that now is the time to buy! I want to see it first break out of this range and then will wait to see if an uptrend is established, which usually means waiting further to see if pullbacks create higher lows etc. For the more aggressive buyer, buying here (319.0) provides a good risk management option as your stop loss could be placed below the recent low (Tuesday 21 April) at 309.0 keeping your stop nice and tight.
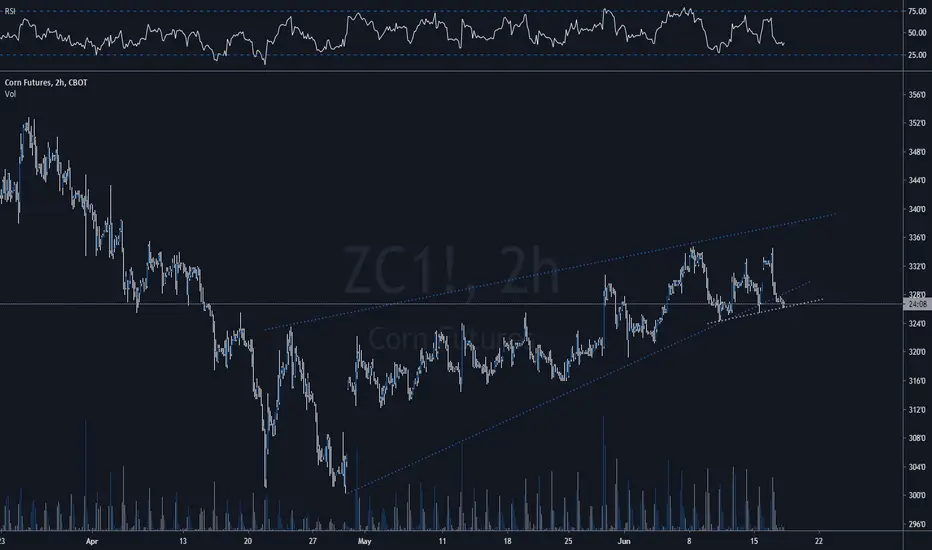
ZC Long trade analysis with SeasonalityMarket Structure:
- ZC looks like forming a Ascending Triangle pattern which is not perfect, also looks like Rounding Bottom
- Higher Lows shows Bulls are willing to buy at higher price
- The Ascending Triangle/Rounding Bottom are sign of Accumulation phase
- R1 is strong Weekly Support level since 2015
Seasonality:
- Corn tends to peak at the middle of year (May to July) according to CME seasonality chart. Link: www.cmegroup.com
- This has been true for the past 5 years since 2015
Strategy:
- I have strong feeling, ZC going to break above in coming days
- I anticipate to go Long on the first pullback
- Short term target profit at R2. Long term target profit at R3.
Notes:
By using seasonality chart, it increase the probability of trades, especially it has been follow the same patterns over past 5 years
However, anything is possible in market, especially during market recession.
Welcome to comment below your thoughts.


$ZC_F Corn COT position is ready to goCBOT:ZC1!
Large Specs/Money Managers are net short and Commercials are net long now.
This tends to be bullish if it broke out of TL resistance(Colored in purple).
Let's wait for confirmation. Until then trend is clearly down based on MAs(13, 50, 200MA direction)

LARGE Players Are Going LONG! CORN Long SetupHello everyone,
today I have a great opportunity from commodity markets for you.
CBOT:ZC1! broke from the long term trading range, but the lower prices were rejected and there are two Pinbars on the weekly chart. Also according to Commitment of traders index the large players are going long which makes it a very interesting setup for buyers.
Do you also watch COT? ;-)
John
FINEIGHT Team

Corn’s Fib Objective for Reached at Seasonal Low?Grains tend to hit their seasonal lows here in early May, as we get into the critical May-June growing season. On the daily chart, corn has traded down from it’s 460’0 highs of last year, using a 50% HWB short at 402’2 to make the run down to it’s Fib objective of 316’6. With price and timing lining up for a bottom here, we are looking for 50% Half Way Back longs and are starting to see the “green shoots” of a rising market here, with a short-term long objectives of 327’6. Further upside will be necessary to challenge the new HWB short, setting up at 351’6, which is likely over the next couple of months. So, look to be long Corn, especially from prices close to the 310’0 level. And look to sell in the 351’6 - 363’5 area on a bounce into the HWB short area.
