TradingView Post: ZF1! – Ticking Toward a Smart Money Spike?🔷 TradingView Post: ZF1! – Ticking Toward a Smart Money Spike?
📍 Chart Context:
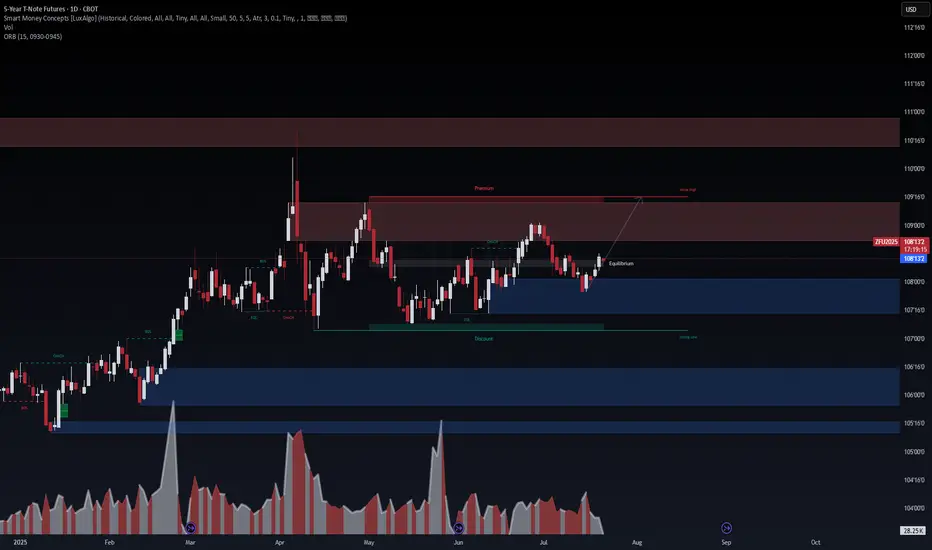
This is ZFU2025 (5-Year Treasury Note Futures) on the daily, with SMC logic applied via premium/discount zones, BOS/CHoCH, and OB footprints. Volume confirms a stealth accumulation phase post-June.
📈 Technical Outlook:
Price just reclaimed equilibrium and flipped a bearish CHoCH
Targeting the weak high near 109’160, nested in the upper premium liquidity zone
Bullish OB at 108'000 held firm with rejection volume
Volume profile shows quiet but growing institutional interest
🔍 Probabilistic Thesis:
This aligns with our VolanX DSS spike setup:
5Y Breakevens >2.5% → Duration bids rising
Fed expected to hold → Rate stability favors mid-curve
Lower time-frame ORB expansion supports breakout narrative
📊 Strategic Play:
We’re now in a setup zone for what could be a sharp leg toward 109+.
Bias: Bullish
Trigger: Daily close above 108’200
Invalidation: Close back inside EQ or 107’800
Probability: ~70% for short-term breakout
📡 This aligns with VolanX macro-trade model. For educational purposes only.
#ZF #BondFutures #5YNote #SMC #VolanX #WaverVanir #FixedIncome #MacroAlpha #TradingView #YieldCurve #RateTrading #LiquidityZones #InstitutionalFlow
ZFH2019 trade ideas
5Y T-Note Futures – Liquidity Pivot Ahead of Key Macro ZF1!🧭 5Y T-Note Futures – Liquidity Pivot Ahead of Key Macro Prints
VolanX Protocol | SMC Alignment | Macro Positioning Setup
🗓️ July 19, 2025 | 1D TF | Symbol: ZFU2025 | DSS Score: Long Bias
🔍 Smart Money Structure Breakdown
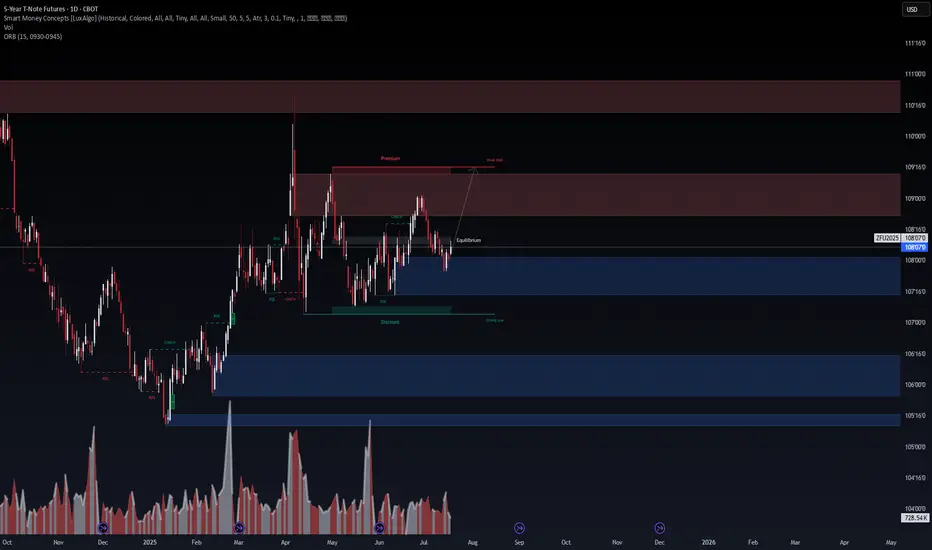
5Y T-Note is consolidating between discount and equilibrium zones with clear evidence of institutional rebalancing:
✅ CHoCH → BOS confirmed, with price reclaiming equilibrium near 108’07
📍 Previous sweep of discount zone → buyers defended strong low
🟥 Targeting premium inefficiency zone between 109’16 – 110’16
👁️ Watch for internal BOS + liquidity raid to validate leg 2 of upward structure
🌐 Macro Catalysts Driving this Trade
Yield Curve Re-steepening (5Y–30Y)
→ Traders pricing in end of hiking cycle; demand shifts toward medium duration bonds.
Fed Policy Outlook (September FOMC)
→ CME FedWatch: Odds of rate cut rise above 40% for Sept.
→ 5Y notes become favored rate-sensitive vehicle for directional plays.
Labor Market Softening
→ Non-farm payrolls revisions and lower JOLTS suggest wage pressure easing.
→ Bond bulls rotating into belly of curve.
Options Flow
→ Institutional OI building near 108’00–108’16 strikes; defensive rotation aligning with macro risk-off positioning.
🎯 WaverVanir VolanX Trading Plan
Element Value
Entry Zone 107’28 – 108’08 (current)
Stop Loss Below 107’04 (structure invalidation)
TP1 109’16 (Premium Low)
TP2 110’12 (FVG closure)
TP3 (Stretch) 111’00 (mid-2024 inefficiency)
📌 Risk Management
Position Sizing: Max 1.5% risk allocation
Trigger: Long bias only if price reclaims 108’12 with volume
Risk/Reward Ratio: ~3.6R on TP2
VolanX DSS Protocol: High Probability Zone activated if macro catalyst (rate cut) is confirmed by next CPI/FOMC
🧠 WaverVanir Narrative Bias
“As macro stress builds and the Fed nears its pivot point, duration exposure becomes the silent alpha. 5Y notes offer a clean risk/reward entry into the evolving disinflation thesis.”
🔺#WaverVanir #VolanXProtocol #5YNote #ZFU2025 #BondFutures #FOMCTrade #SMC #SmartMoneyConcepts #RateCut #MacroCatalyst #YieldCurve #DSS #InstitutionalSetup #RiskManagement #TradingStrategy
Repricing the Curve – Bonds Lead the ShiftAsset Focus: 5-Year T-Note Futures (ZF1!)
Setup Type: Volatility Breakout – Long Continuation Opportunity
⸻
Theme: Repricing the Curve – Bonds Lead the Shift
The bond market is signaling a decisive regime transition. With softening macro data, trade war escalation, and growing fears of a policy misstep, the 5-Year T-Note has broken out of a multi-month range. This is not simply a yield trade — it’s a shift in market psychology. Bonds are moving first, front-running a potential pivot in the broader economic narrative.
The breakout in ZF1! is not speculative — it’s structural. And while equities continue to lag in response, duration is being bid in size.
⸻
Setup Overview:
The 5-Year T-Note has resolved a broad, well-defined base to the upside. The expansion is impulsive, momentum-backed, and likely tied to flow-based repositioning by macro funds and risk parity models.
The current move is being driven by a re-rating of growth expectations and increased hedging demand amid policy uncertainty. With the market no longer fixated on “higher for longer,” the path for yields is now asymmetrically lower — and futures are responding accordingly.
⸻
COT & Sentiment Snapshot:
• Leveraged funds were positioned defensively — many flat or net short into the move.
• A breakout at this stage may initiate a multi-week flow chase from underexposed players.
• Commercials likely began paring hedges as yields topped — confirming net buyer pressure.
• Sentiment has shifted from complacency to fragility — driven by policy uncertainty, geopolitical risk, and weak forward-looking indicators.
⸻
Market Structure & Technical Breakdown:
• Clean breakout from consolidation — range resolved with urgency and clarity.
• No signs of blow-off or overextension — this is a fresh trend, not a climax.
• Prior range structure now provides a firm base and validation layer.
• Trend is being confirmed by rising momentum, increasing participation, and narrative support.
• Absence of resistance clusters above allows for continuation until new macro resistance develops.
⸻
Behavioral Finance Layer:
“The fastest markets aren’t driven by greed — they’re driven by fear of being wrong late.”
• Most market participants missed the pivot in tone — bonds are reacting faster than risk assets.
• Short-term underperformance from duration-sensitive portfolios has created rotational pressure.
• Belief in the Fed’s control is eroding — and fixed income is the first responder.
• Traders are no longer fading strength — they’re chasing protection.
⸻
Reflexivity Risk Model:
• Phase 1: Market dismisses recession risk — stays underweight bonds
• Phase 2: Tariffs, macro slowdown, and policy language disrupt narrative
• Phase 3: Breakout forces re-entry and chasing of missed exposure
• Phase 4: New belief forms — bonds now viewed as strategic asset, not tactical hedge
⸻
Strategic Stance:
Maintain a directional long bias. This is a conviction breakout — not noise. With macro volatility rising, trade tensions escalating, and equity markets yet to reflect these risks, 5-Year Notes remain a preferred vehicle for front-running the broader regime shift. Repricing is underway — and fixed income is leading it.

How I Use Multi Timeframe Analysis to Capture LARGE Price SwingsDISCLAIMER: This is not trade advice. Trading involves real risk. Do your own due diligence.
TUTORIAL:
Today, I demonstrate the thought process and mechanical steps I take when trading my Multi-Timeframe strategy. We take a look at US Treasuries, which have offers a classic lesson in how to apply this approach.
As you will see, throughout the year, this approach took some losses prior to getting involved in the "real" move which we anticipated. No strategy is perfect, and I do not purport this to be perfect. It is a rules based and effective way to read price. This strategy is great for people who don't have a lot of time to spend at the charts. I would classify this more as an "investing" strategy when utilizing the 12M-2W-12H timeframe.
If you have questions about anything in this video, feel free to shoot me a message.
I hope you have all had a great week so far.
Good Luck & Good Trading.

Bonds - Bearish - 3rd Week of April Looking for Bonds to complete MMSM, perfectly correlated with yields & dxy completing their corresponding MMBM.

Bearish Quarterly Shift on Bonds Possibly Invalidated I thought a possible bearish retracement for this quarter could be possible but bonds seems to be bullish. Bearish price action looks like runs on stops. Will continue to watch. As of now, I switch to neutral. My longer term mmbm idea seems to be playing out a lot more aggressively than I expected.

Bonds - Possible Bearish Quarterly ShiftBonds is continuously breaking daily lows. Would like to see a body close market structure shift lower for a clear sign of bearish shift.

5 Year T-Notes Long Idea Long on Donchian 4 week break out rules for a major change in trend. Lets see where this gets us.

Test2Test Test TestTest Test TestTest Test TestTest Test TestTest Test TestTest Test TestTest Test TestTest Test TestTest Test TestTest Test Test

ZF (and bonds in general) carnageThe expected turnaround did not happened, and the 61.8 Fibo is now a resistance.

T-Notes 4 week breakoutThis is reference chart for my recent trade idea to explain why I am going long T-Notes Futures.

5 Year T-Note Futures 1 tick = 0.0078125
Tick Value = $7.8125
What I call 1 point is 4 ticks or 0.03125 ($31.25)
Bought at 112'09'2 Stop 112'07'0


ZF - looks like a bottomFive year notes show clear divergence against momentum indicators, bottom might be in place.

ZF - is the bottom finally formingStock market is tanking under the weight of higher interest rates. Will there be a reversal in rates? Flight to safety anyone?


ZF five year note completing the pattern.It is probably not there yet, but it should be close, so be on look out.

ZF - impulse to the upsideSimilar pattern (seee previous post) can be found in five year note, which would suggest that FED tightening is fully priced and that market is starting to anticipate the recession, and bear market in stocks.

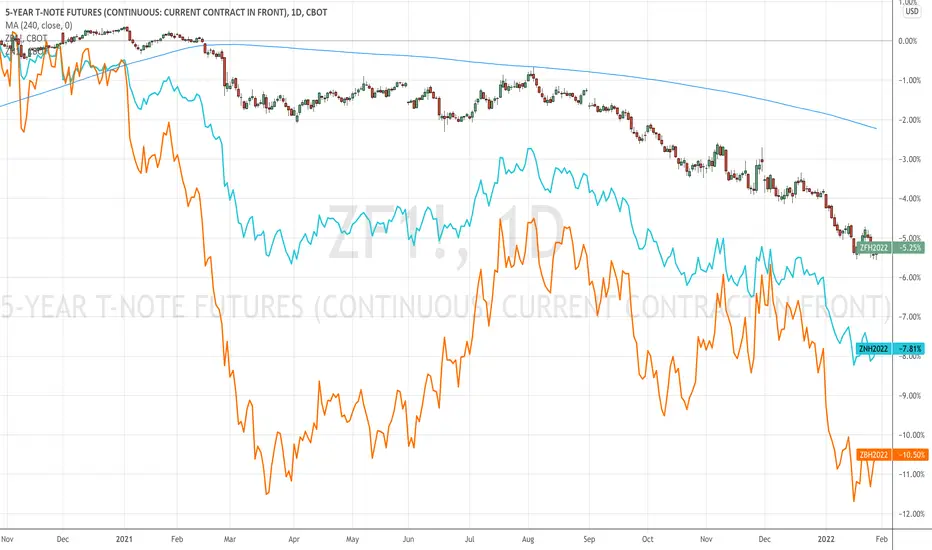
Evolution of bonds when interest rate expectations augment, by dEvolution of bonds when interest rate expectations augment, by duration
Treasuary 5 yearsThis detail of price development to the hourly chart is based on a previously published global analysis.


Downward trend in ZFAfter an impulse to the downside, 5year notes went sideways for several moths, corrected 50%, and presumably made an initial small impulsive wave lately to begin the second leg down. Will it be a third or a C wave is yet to be established.
Should stay beneath the magenta MA though.

5 Year T-Note Futures Heading Lower Towards 123Disclaimer
The views expressed are mine and do not represent the views of my employers and business partners. Persons acting on these recommendations are doing so at their own risk. These recommendations are not a solicitation to buy or to sell but are for purely discussion purposes. At the time publishing, I have a position in 5-Year T-Note Futures (ZF1!) .
Trend Analysis
The main view of this trade idea is on the 2-Hour chart. zf1! has been channeling lower after making a high of 124’08 on July 8th. First low was observed on July 13th around the 123’18”5 price level and a lower high is seen around 124 on July 15th. ZF1! Is expected to make a lower low at 123’14”5 in the short term.
Technical Indicators
ZF1! is currently below its short (25-SMA), medium (75-SMA) and fractal moving averages and its RSI is trading below 50. Moreover, the KST recently had a negative crossover.
Recommendation
The recommendation will be to go short at market. At the time of publishing ZF1!is trading around 123’25”2. The medium-term target price is observed around the 123’14”5 price level. A stop loss is set at 124. This produces a risk reward ratio of 1.54.
