COT Analysis - Grain SectorThis week, ZL, ZM, ZC & ZW are all setup for shorts based on the COT strategy.
This is a SETUP market, it does not mean short now. It means if I am presented with an entry TRIGGER, I will enter short. Until then, I wait.
Enjoy your weekend.
ZL1! trade ideas


ZL. Zigzag for wave 2.Working on the idea of a Zigzag pattern for Wave ((2)) in the soybean oil market.
In Elliott Wave Theory, a Zigzag pattern is a corrective wave pattern that usually consists of three waves:
Wave A:
This is the initial decline from 42.68 in 5 wave sequence, setting the stage for the corrective pattern.
Wave B:
3 wave corrective rally that follows Wave A.
Wave C:
This is the final leg of the Zigzag pattern, typically extending beyond the end of Wave A. Wave C is always either an impulse or a diagonal. My interpretation of the current structure is that Wave C has developed into an expanding diagonal and may possibly end at 3956.
Invalidation for this idea = 3956

Gold and silver this is December 5th and I'm looking at a number of markets in addition to the metals. there were nice easy moves on gold and silver for a scalp. the soybean oil may start going higher if it finds a 2-point reversal to go higher and then I would look for it to possibly break higher and expand if it can just reach the previous High

Multiple markets in this video I went back and looked at all the markets that I talked about this weekend and earlier today. right...now it's about noon New York Standard Time. and they wanted to review if the thoughts that I had on a previous day represent what I described or not based on the price action of a number of markets.

Soybean oil Dec: Setup for the hourlyThere is a likely 5 wave sequence(hourly) to the upside which should call for more attention and also knowing your risk level. The presence of a positive divergence against MACD gives weight to the possibility of the pending upturn.

Soyben Oil : Head & Shoulderon a log scale, the head and shoulder formation objective have likely been fulfilled. This should augment the idea of
a high probable bottoming with the other confluences in price objectives.

Soybean Oil : Bull setup?December beanoil is a high probable low area worth having a closer look as numerous projections and retracement confluencing at around the 37-38 cts.
The time taken in the bull market from March '20 to April '22 is almost the same time it took to retreat. At the recent low,it took 840 calendar days compared to 772 days of rise.
Supporting the high probability is the triple divergence of MACD.

ES gold soybean oil8 28. 24 in this video there was a 2-bar reversal moving lower on the ES and I think this could be a good short trade with a small stop and potentially a real good Target or a substantially real good Target lower and I explained that. I don't think it will take a large stop to stay in the trade. gold has been Trading in a Range it was predictable early in that pattern.... and it's a good example of how markets can make new highs and you would think that that would be easy Trading but it really isn't that easy unless you can frame it and also realize that markets that make new highs frequently don't go a lot higher or lower.. the range and you want to judge the market that way if the range is significant enough to give you short-term trades as a buyer and or a seller. the last Market was Soybean Market and it could be one of those examples where you get out of your trade if you were long at the bottom and now it's getting a little tougher to stay long without Corrections.... and you want to think about those decisions because if it doesn't go much lower it can go higher than we have so far. I think it's tough to hold trades like this where the market had a great reversal point to go higher but the market didn't give it as much of a reward as you would like.... and that can influence you to think that the market is at high risk of making new lows and that you should take your profit. I talk about that a little bit.

Long trade in soybean oil8 19 24 soybean oil just generated a long trade during this video. it was not a long trade last night because it was too late to go long... but it ended up going just a little higher and then going lower to a support area a little after 10:00 in the morning..... and it's worth looking at the differences in the pattern to avoid what would have been a losing trade versus getting into a trade a little bit later when it corrected to a support and gave you much better opportunity with essentially very little risk compared to the reward. dxy, oil, ES, gold, Tesla we're also discussed in this video

Gold soybean oil this is the second video for Sunday. there's some follow-up here from earlier tonight. we also are looking at gold and soybean oil. soybean oil is a clean reversal pattern to go higher and we use a small stop.

soybean oil8.6.24 soybean oil went a little bit lower today to a measured move and a possible reversal with a fairly small stop. I do not trade this Market. it but it is probably a good Market to look at. I showed you how you could have found the short trade, where you should have taken your profit, that you have the beginning of a long trade to go higher. it's a good exercise in knowing and consciously thinking about where the buyers and the sellers are on the way down and on the way up.

long-term upward trendI am hoping for an upcoming bearish trend break.
You can start buying soybean oil at the current price 46.00 And buy limit at price 44.00.
If the D1 bottom zone 42.00 is broken, cut loss and close the order immediately.

Is Soybean Oil Heating Up? Of the grains and oilseeds, soybean oil has been the clear laggard. Corn, wheat, soybeans, and even soybean meal have seen notable rallies over the course of the last 4-6 weeks. However, there are indications that may soon change. As ingredient buyers know, soybean oil typically trades at a significant premium to its rival palm oil. The chart below overlays a 5-year continuous chart of front month soybean oil futures prices along with a 5-year continuous chart of Malaysian palm oil futures. As displayed by the chart, in each instance over the past 5 years in which SBO’s premium has eroded relative to palm oil, we’ve seen soybean oil prices rally in excess of 15%.
Fund Positioning :
Extreme fund positioning is typically viewed as a contrary indicator. As such, managed money funds holding their largest net-short position in soybean oil futures of any point in the last 5-years adds to the bullish case in the immediate term. Per the last CFTC Commitment of Traders report, managed money was holding a net-short position of 58,748 contracts. In the instance that prices grind higher, short-covering on behalf of managed money could accelerate a move to the upside.
Technicals :
Lastly, the technical landscape of soybean oil also looks constructive. There is significant bullish divergence between the two most recent lows, and a standard 14-day RSI. In other words, the most recent successive lows came on less conviction. A break and close above the most recent swing high of 50 should lay the groundwork for a test of the swing-highs observed last July between 64 and 66.
Futures trading involves substantial risk of loss and may not be suitable for all investors. Therefore, carefully consider whether such trading is suitable for you in light of your financial condition. Trading advice is based on information taken from trade and statistical services and other sources Blue Line Futures, LLC believes are reliable. We do not guarantee that such information is accurate or complete and it should not be relied upon as such. Trading advice reflects our good faith judgment at a specific time and is subject to change without notice. There is no guarantee that the advice we give will result in profitable trades. All trading decisions will be made by the account holder. Past performance is not necessarily indicative of future results.
Blue Line Futures is a member of NFA and is subject to NFA’s regulatory oversight and examinations. However, you should be aware that the NFA does not have regulatory oversight authority over underlying or spot virtual currency products or transactions or virtual currency exchanges, custodians or markets. Therefore, carefully consider whether such trading is suitable for you considering your financial condition.
With Cyber-attacks on the rise, attacking firms in the healthcare, financial, energy and other state and global sectors, Blue Line Futures wants you to be safe! Blue Line Futures will never contact you via a third party application. Blue Line Futures employees use only firm authorized email addresses and phone numbers. If you are contacted by any person and want to confirm identity please reach out to us at info@bluelinefutures.com or call us at 312- 278-0500
Performance Disclaimer
Hypothetical performance results have many inherent limitations, some of which are described below. No representation is being made that any account will or is likely to achieve profits or losses similar to those shown. In fact, there are frequently sharp differences between hypothetical performance results and the actual results subsequently achieved by any particular trading program.
One of the limitations of hypothetical performance results is that they are generally prepared with the benefit of hindsight. In addition, hypothetical trading does not involve financial risk, and no hypothetical trading record can completely account for the impact of financial risk in actual trading. For example, the ability to withstand losses or to adhere to a particular trading program in spite of trading losses are material points which can also adversely affect actual trading results. There are numerous other factors related to the markets in general or to the implementation of any specific trading program which cannot be fully accounted for in the preparation of hypothetical performance results and all of which can adversely affect actual trading results.

ZL1! looking strong in lower 40'sLooks like volume is picking up in the lower 40's range on soybean oil. The summer months could also bring heavy volume and we could see buyers take control. I could see it hit the top of my trend line before coming back down in the colder months. Just an idea and would love to see thoughts

ZL downtrendstill in downtrend mode find short or swing short. Break every support just find nearest resistance to find EP and if break structure hold for swing 1: 5 risk management


CBOT soybeans set one-month low under pressure from firm dollarChicago Board of Trade soybean futures ended weaker on Tuesday after touching a one-month low as strength in the dollar weighed on grain markets.
CBOT May soybeans SK24 settled down 13-1/4 cents at $11.45 per
bushel and hit their lowest price since March 6.
CBOT May soymeal SMK24 ended down $3.20 at $335.30 per short
ton, and May soyoil BOK24 dropped 0.56 cent to finish at 44.91 cents per pound.
The United States continues to face competition for global soybean export sales from cheaper Brazilian supplies.

SoyBean Oil @ $44.70In this video, we look at the Soybean market CBOT:ZL1! which is a commodity.
Now if you have been reading or watching my videos.
--
One thing you will notice is that i like the commodities market.
Even though most of the time i talk about the stock market
i really have a passion for the commodity
--
market because it reflects the everyday prices of goods such as food
--
In this video, we look at the soybean oil market
notice that it's in a reversal?
Have you seen the candle stick pattern that shows you momentum and reverse?
--
Watch this video to learn more.
Thank you.
--
Disclaimer: This is not financial advice please do your own research before you trade. You will lose money trading take this as a warning.

Sell march bean oil 47.96, stop 49.76Sell march bean oil 47.96, stop 49.76
Based on Cannon Algo support/resistance breakout

SOYBEAN ZL in 30 minHello to all tradingview investors, according to my previous analysis, I see a great sales opportunity with good probability, the details are reflected in the graph, greetings and good luck to all

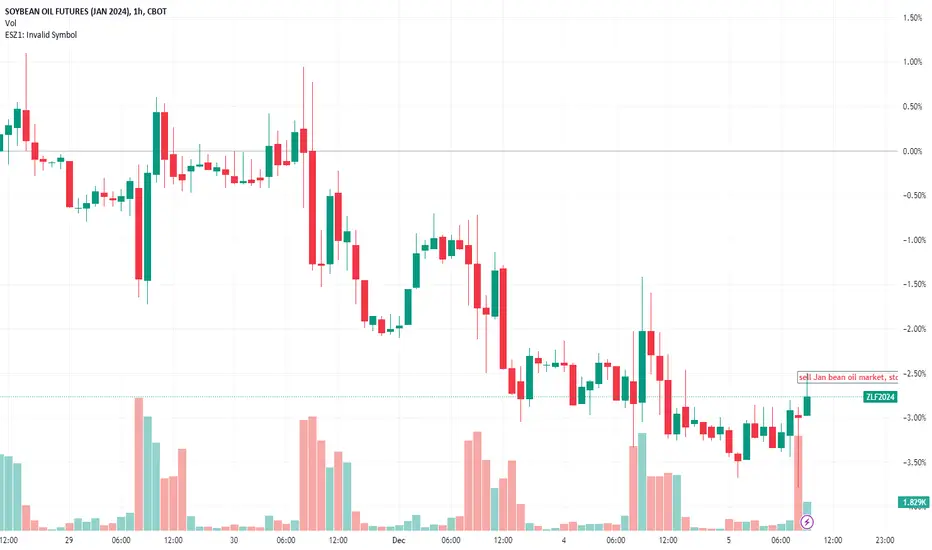
sell Jan bean oil market, stop at: 53.72, tgt at 49.23sell Jan bean oil market, stop at: 53.72, tgt at 49.23
Sell dec bean oil 48.60 on stopSell dec bean oil 48.60 on stop
It is a pending order. Trade confirmed.
