ZM1! trade ideas

Soybean Meal ShortZM1! is not net short on the regression break.
The roll short is (+0.016%) I am not taking this trade.

Soybean Meal Futures LongZM1! Futures Long is now net long on the regression break.
I am taking trades in the current market. (Waiting and Watching)

Its hitted StoplossMy entry about SOybean was hit stoploss.
It was broken but not strong like tennis ball.

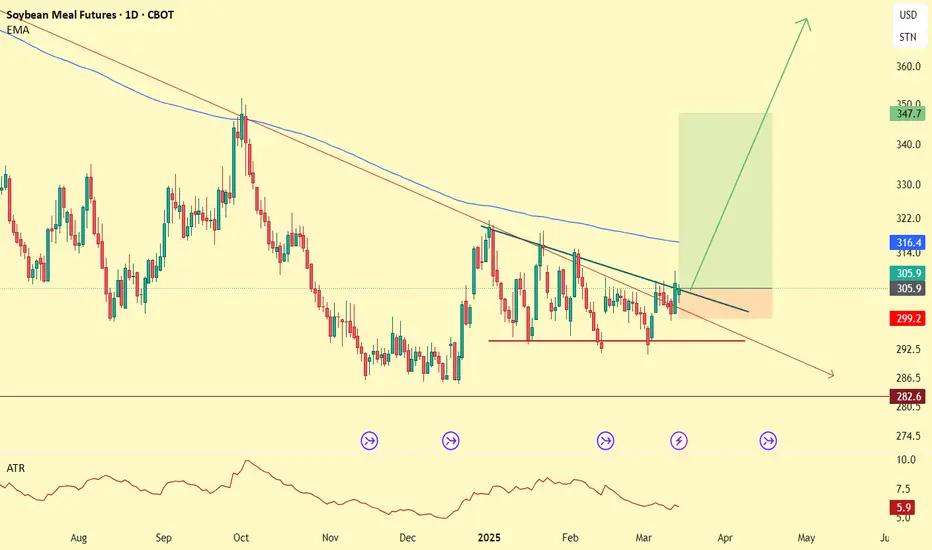
Long position for Soybean MealI take an answer: bullish in Soybenmeal
Wait wait and Let market give the answer
Soybean Futures Surge: ZS, ZL, and ZM Align for a Bullish MoveI. Introduction
Soybean futures are showing a potentially strong upcoming bullish momentum, with ZS (Soybean Futures), ZL (Soybean Oil Futures), and ZM (Soybean Meal Futures) aligning in favor of an upward move. The recent introduction of Micro Ag Futures by CME Group has further enhanced trading opportunities by allowing traders to manage risk more effectively while engaging with longer-term setups such as weekly timeframes.
Currently, all three soybean-related markets are displaying bullish candlestick patterns, accompanied by strengthening demand indicators. With RSI confirming upward momentum without entering overbought territory, traders are eyeing potential opportunities. Among the three, ZM appears to be the one which will potentially provide the greatest strength, showing resilience in price action and a favorable technical setup for a high reward-to-risk trade.
II. Technical Analysis of Soybean Markets
A closer look at the price action in ZS, ZL, and ZM reveals a confluence of bullish factors:
o Candlestick Patterns:
All three markets have printed bullish weekly candlestick formations, signaling increased buying interest.
o RSI Trends:
RSI is in an uptrend across all three contracts, reinforcing the bullish outlook.
Importantly, none of them are currently in overbought conditions, suggesting further upside potential.
o Volume Considerations:
Higher volume on up moves and decreasing volume on down-moves adds credibility to the bullish bias.
III. Comparative Price Action Analysis
While all three soybean-related markets are trending higher, their relative strength varies. By comparing recent weekly price action:
o ZM (Soybean Meal Futures) stands out as the one which will potentially become the strongest performer.
Last week, ZM closed above its prior weekly open, marking a +1.40% weekly gain.
RSI is not only trending higher but is also above its average, a sign of potential continued strength.
o ZS and ZL confirm bullishness but lag slightly in relative strength when compared to ZM.
This comparative analysis suggests that while all three markets are bullish, ZM presents the most compelling trade setup in terms of technical confirmation and momentum.
IV. Trade Setup & Forward-Looking Trade Idea
Given the strong technical signals, the trade idea focuses on ZM (Soybean Meal Futures) as the primary candidate.
Proposed Trade Plan:
Direction: Long (Buy)
Entry: Buy above last week’s high at 307.6
Target: UFO resistance at 352.0
Stop Loss: Below entry at approximately 292.8 (for a 3:1 reward-to-risk ratio)
Reward-to-Risk Ratio: 3:1
Additionally, with the introduction of Micro Ag Futures, traders can now fine-tune position sizing, making it easier to manage risk effectively on longer-term charts like the weekly timeframe. Given the novelty of such micro contracts, here is a CME resource that could be useful to understand their characteristics such as contracts specs .
V. Risk Management & Trade Discipline
Executing a trade plan is just one part of the equation—risk management is equally critical, especially when trading larger timeframes like the weekly chart. Here are key considerations for managing risk effectively:
1. Importance of Precise Entry and Exit Levels
Entering above last week’s high (307.6) ensures confirmation of bullish momentum before taking a position.
The target at 352.0 (UFO resistance) provides a well-defined profit objective, avoiding speculation.
A stop-loss at 292.8 is strategically placed to maintain a 3:1 reward-to-risk ratio, ensuring that potential losses remain controlled.
2. The Role of Stop Loss Orders & Hedging
A stop-loss prevents excessive drawdowns in case the market moves against the position.
Traders can also hedge using Micro Ag Futures to offset exposure while maintaining a bullish bias on the broader trend.
3. Avoiding Undefined Risk Exposure
The Micro Ag Futures contracts enable traders to scale into or out of positions without significantly increasing risk.
Position sizing should be adjusted based on account risk tolerance, ensuring no single trade overly impacts capital.
4. Adjusting for Market Volatility
Monitoring volatility using ATR (Average True Range) or other risk-adjusted indicators helps in adjusting stop-loss placement.
If volatility increases, a wider stop may be needed, but it should still align with a strong reward-to-risk structure.
Proper risk management ensures that trades are executed with discipline, preventing emotional decision-making and maximizing long-term trading consistency.
VI. Conclusion & Disclaimers
Soybean futures are showing bullishness, with ZS, ZL, and ZM aligning in favor of further upside. However, among them, ZM (Soybean Meal Futures) potentially exhibits the most reliable momentum, making it the prime candidate for a high-probability trade setup.
With bullish candlestick patterns, RSI trends confirming momentum, and volume supporting the move, traders have an opportunity to capitalize on this momentum while managing risk effectively using Micro Ag Futures.
When charting futures, the data provided could be delayed. Traders working with the ticker symbols discussed in this idea may prefer to use CME Group real-time data plan on TradingView: www.tradingview.com - This consideration is particularly important for shorter-term traders, whereas it may be less critical for those focused on longer-term trading strategies.
General Disclaimer:
The trade ideas presented herein are solely for illustrative purposes forming a part of a case study intended to demonstrate key principles in risk management within the context of the specific market scenarios discussed. These ideas are not to be interpreted as investment recommendations or financial advice. They do not endorse or promote any specific trading strategies, financial products, or services. The information provided is based on data believed to be reliable; however, its accuracy or completeness cannot be guaranteed. Trading in financial markets involves risks, including the potential loss of principal. Each individual should conduct their own research and consult with professional financial advisors before making any investment decisions. The author or publisher of this content bears no responsibility for any actions taken based on the information provided or for any resultant financial or other losses.

Soybean Meal Futures LongFutures running a -2.6% monthly roll long indicating good supply.
Trend may not run to far......
I won't take this trade

Soybean Meal Futures Spread : ZMN25-ZMQ25Excellent opportunity in this spread on soybean meal :
- Margin requirements are low, as intracommodity spreads often are.
- The spread is currently at -1 from its historical value of 1 in the 5-year average, and 0 in the 15-year average, and being long we have an additional favorable factor for more margin upwards
- This spread has been in profit 80% of the time over the past 15 years
- There is a very good trend in both averages and a trend duration of about 4 months
- The average Risk Reward Ratio over the last 5 years is 17.13

Soybean Meal FuturesThe current outlook for Soybean Meal Futures (Dec 2024) leans bearish, as indicated by recent price actions and technical indicators.
Downtrend: The price of Soybean Meal Futures is currently in a downtrend, marked by lower highs and lower lows, with the moving average line sloping downward. This suggests a prevailing negative sentiment among traders.
Bollinger Band Breakout: Adding to the bearish sentiment, the price has recently breached the lower Bollinger Band. This breakout could signify strong bearish momentum, potentially pushing prices further down. While prices often return within the bands after such a breakout, continued movement outside could signal an extended downtrend.
Volume Confirmation: The recent price decline is accompanied by a noticeable increase in trading volume, indicating strong selling pressure and supporting the likelihood of further price decreases.
Key Support Level: A critical support level is identified at around 298.5, close to the current session's low. A break below this level could trigger further declines. Conversely, resistance is anticipated around the middle Bollinger Band and previous highs around 325–330.
Potential Reversal: Despite the bearish signals, the source advises watching for reversal patterns like bullish engulfing candles or hammers, particularly near support levels. A return inside the lower Bollinger Band could also suggest a short-term price bounce. However, such a reversal requires confirmation through volume support and sustained price action.

Wheat FuturesThere are a few potential bearish momentum indicators present in the chart that suggest the price of Wheat Futures may continue to decline.
The price of Wheat Futures dipped below its middle moving average. This could indicate bearish momentum, especially if the price stays below this line.
Higher volume accompanied the recent drop in the price of Wheat Futures. This could signal stronger selling pressure.
The price of Wheat Futures recently touched the upper Bollinger Band but has since retraced downward toward the lower half of the band. This suggests that the recent uptrend may be losing momentum or consolidating.
The trend for the price of Wheat Futures appears to have been mostly downwards, with a few rallies. The recent rejection near the moving average and a return to lower levels could suggest that the downtrend may continue unless a strong support level is found.

15% to 30% Upside Ahead for Soybean Meal (Divergence Strategy)Soybean Meal recently confirmed the monthly bullish divergence with Septembers candle close. This is a significant signal that prudent traders should pay close attention to. What this signal implies is that there is a minimum 15% move to the upside from current price ahead for Soybean Meal. The high end target is a 30% upside move. This does not mean this market is going to go straight up from here. In my opinion, dips are for buying in the Soybean Meal market until we reach these upside targets.
Have a great week.

Long positionSoybean Meal
Buy limit at support area 351 and 334
Stoploss 320
Take profit 392 and 434.

ZM1! INTRADAY IDEAafter big bearish momentum last candle retracement will happen. Trading plan intraday looking for long around $363.8 and take profit about 40tick (green zone) or set break even SL. after that looking for short at zone (red box) to fullfill the imbalance/FVG candle TP at the swing low. TAYOR

ZM1 bearishafter confirmation candle bearish breakout on H4 our trading plan is buy on pullback and short on zone. Confirmation downtrend already start Daily candle is DOUBLE TOP. TAYOR

ZM! still uptrend still look uptrend after a big pullback on H4. price still bias going up looking for $401 zone fibonaci 50% retracement if this hit need to draw a new technical review. TAYOR

ZM DOUBLE TOP H4 DAILYpotentially to g o down in the box target looking for long to the swing high for intraday

ZM: Level Setting up, Awaiting BOSLevel setting up, awaiting break of structure, bull momentum, new micro level to set up a second leg.

Buy May soybean meal at 340.2, stop at 328.2, tgt at 354.2Buy May soybean meal at 340.2, stop at 328.2, tgt at 354.2 - Our ALGO sees a potential for short covering in the soy complex

Sell H Soymeral at 352.0 limit. If filled Stop @ 361.5, tgt338.6Looking for a bounce on a down trending market
Sell March Soymeral at 352.0 limit. If filled Stop at 361.5, tgt 338.6
Trading commodity futures and options involves substantial risk of loss.
The recommendations contained in this letter is of opinion only and
does not guarantee any profits. These are risky markets and only
risk capital should be used. Past performance is not indicative of future results**
hypothetical performance results have many inherent limitations, some of which are described below. no representation is being made that any account will or is likely to achieve profits or losses similar to those shown. in fact, there are frequently sharp differences between hypothetical performance results and the actual results subsequently achieved by any particular trading program.
one of the limitations of hypothetical performance results is that they are generally prepared with the benefit of hindsight. in addition, hypothetical trading does no involve fina
ncial risk, and no hypothetical trading record can completely account for the impact of financial risk in actual trading. for example, the ability to withstand losses or to adhere to a particular trading program in spite of trading losses are material points which can also adversely affect actual trading results. there are numerous other factors related to the markets in general or to the implementation of any specific trading program which cannot be fully accounted for in the preparation of hypothetical performance results and all of which can adversely affect actual trading results.

Sell march soymeal at 3660 limit, if filled stop at 3990.
Aggressive traders ahead of tomorrow;s USDA report can look to Sell march soymeal at 3660 limit, if filled stop at 3990.

Soy Meal Opportunity Launching Pattern Symmetrical TriangleThis is a 1 year rectangle with an 8 week symmetrical triangle offering potential launching pattern - breakout using 30 day ATR of 5 points (45-50%) would target 500 mark offering the trader 65 points x 100 or $6500 for each future traded. Of note, a prior symmetrical triangle in the pattern also occurred and reached the target. Its very likely the 1 year boundary will remain stable offering a trader profits and opportunities while trading within the boundaries.

Soybean Crush Processor Margin w CalcThe soybean crush spread calculates how much profit a soybean processing plant can generate by crushing a bushel of soybeans into soybean meal and oil. The profit margin is that profit number divided by the revenue which is the price of the meal and oil outputs. I prefer to look at profit margin as opposed to just profit as it adjusts for large market fluctuations over time and is more meaningful from a business and analysis perspective.
I was not able to come up with any tradable theories based on this analysis. I added live cattle and lean hogs to try and figure out what’s going on with soybean meal reaching multi-year highs this week. It appears that move is correlated with live cattle reaching new highs. Soybean meal is rising while soybean oil is falling. Soybeans are pretty flat although slowly rising. I will continue to monitor this spread for clues about future soybean, soybean meal, and soybean oil movements. If anyone has any insights on crush spreads, please share.
The calculation of the spread is shown below:

Weekly Forecast (December 27 – 30, 2022)Uptrend scenario
An uptrend is not expected, but possible correction to 466 – 471.
Downtrend scenario
An downtrend will start from resistance 466 – 471 or as soon, as the market drops below support level 443.4, which will be followed by moving down to support level 420.
