Bonds Break OutBonds have lifted, breaking out of the narrow range held for the past three days. We broke the upper bound at 120'14, and hit our next target exactly at 121'00, as predicted. We are seeing red triangles on the KRI suggesting that we are facing resistance here. The Kovach OBV has picked up, suggesting genuine momentum may be back. If so, the next target is 121'28. If we retrace, we should have strong support from 120'14 and 119'23.
ZN1! trade ideas

10 YEAR T-NOTE FUTURESAnd in the case of a breakthrough, this is the important point or strong point that is considered a resistance zone, knowing that it penetrated a first point, and we can see a very strong acceleration upwards

analyse of the last correction of the znas we can see the market in a range area and building a flag pattern, we'r waiting for a break above the correction than a pullback to start looking for buying

inverse head and shoulderinverse head and shoulder, neck line to be breached, awaiting catalyst. Will it be seen as a risk on or risk off play though? hoigher bonds = lower rates. When bonds got crushed this first half of year it killed stocks. These 2 usually trade inverse however how they are more correlated. financial landscape changing?


Daily zn analysisDaily zn analysis
A long position with the target and stop loss as shown in the chart
The trend is up, after it breached the descending trend line, it came back to test the rising trend line from it, we may see a strong rise.
ZN1 maybe is going upAccording to our analysis ZN maybe is going up so consider to buy and if you have in your portfolio keep it

Potential Bearish ContinuationTitle: 10-YEAR T-NOTE FUTURES (ZN1!), H4 Potential for Bearish Continuation
Type : Bearish Momentum
Resistance : 118'06'0
Pivot: 117'18'5
Support : 116'14'0
Preferred Case: On the H4, with price recently breaking the ascending trend channel and moving below the ichimoku cloud , we have a bearish bias that price will continue to drop from the pivot at 117'18'5 at the swing low in line with the 61.8% fibonacci projection and 50% fibonacci retracement to the 1st support at 116'14'0 at the swing low in line with the 100% fibnoacci projection. However, we will wait for price to break the support structure at the pivot for downside confirmation before playing this move.
Alternative scenario: Alternatively, price may reverse off the pivot and rise to the 1st resistance at 118'06'0 at the pullback resistance.
Fundamentals: US indexes moved moderately higher with better-than-expected US economic reports. Hence, we have a bullish view on the 10-year t-note futures.

Elliott Wave View: Ten Year Notes (ZN) Looking to Extend LowerShort term View in Ten Year Notes (ZN) suggests that rally to 120’16 ended wave ((4)). Internal subdivision of wave ((4)) unfolded as a zigzag Elliott Wave structure. Wave A of ((4)) ended at 120’04 and dips in wave B of ((4)) ended at 118’23. Final leg higher wave C ended at 120’16 which completed wave ((4)). Wave ((5)) lower is currently in progress with internal subdivision as an impulse Elliott Wave structure. The Notes still needs to break below previous wave ((3)) low on 6/15/2022 at 114’07 to rule out a double correction in wave ((4))
Down from wave ((4)), wave 1 ended at 117’18 and rally in wave 2 ended at 119’06. Internal of wave 2 unfolded as a zigzag where wave ((a)) ended at 119’03 and wave ((b)) ended at 117’24. Final leg wave ((c)) ended at 119’06 which completed wave 2. Wave 3 lower is currently in progress and a break below wave 1 at 117’18 should better confirm the extension lower. Down from wave 2, wave ((i)) ended at 117’28 and rally in wave ((ii)) ended at 119. Near term, as far as pivot at 120’17 stays intact, expect rally to fail in 3, 7, or 11 swing for further downside.

ZN shortCBOT:ZN1!
i believe that after the break of the trend support the zn will fall straight to the key support level at 116'15'0

ZN FRAME 15MINActually its a trading range we nee to break with power the VWAP indicator with big volume to start a buy tendence. For sell tendence we are near we need to see more indicators. The best thing to do its to wait

Sideways Correction in BondsBonds are oscillating in the narrow range between 117'19 and 119'01. The Kovach OBV has leveled off, suggesting there is little momentum at the moment to move then needle either way. We appear to be in a sideways corrective phase, after topping out at 120'14, then retracing to 117'19. If we catch more momentum, we could test highs again at 120'14. If 117'19 does not hold, watch for support at 117'08 and 116'20.

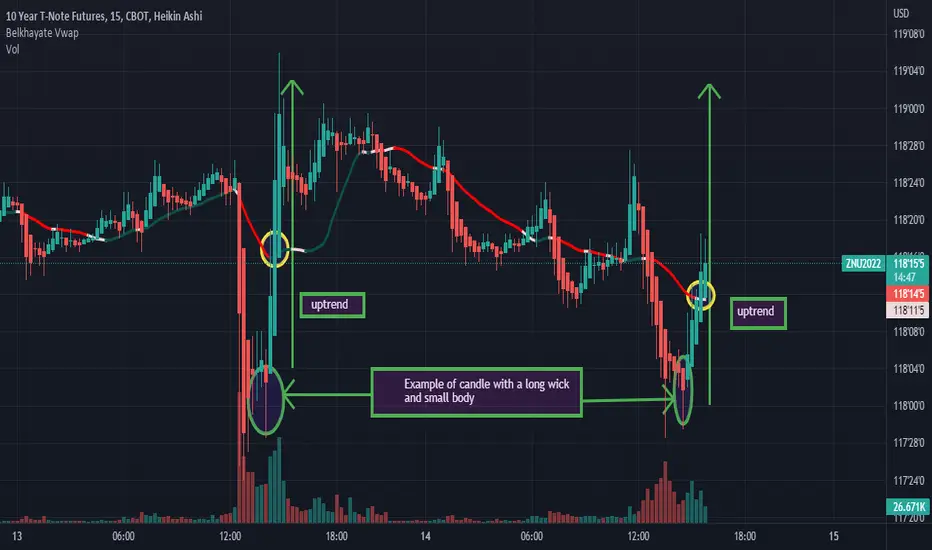
Example of candles with a long wick and small bodyGood morning all! Here we can see an example of candles with a long wick and small body. Thanks.
summary on ZN1As you see on the chart after a breakout with force the vwap indicator and the support line we have a downtrend.thanks.
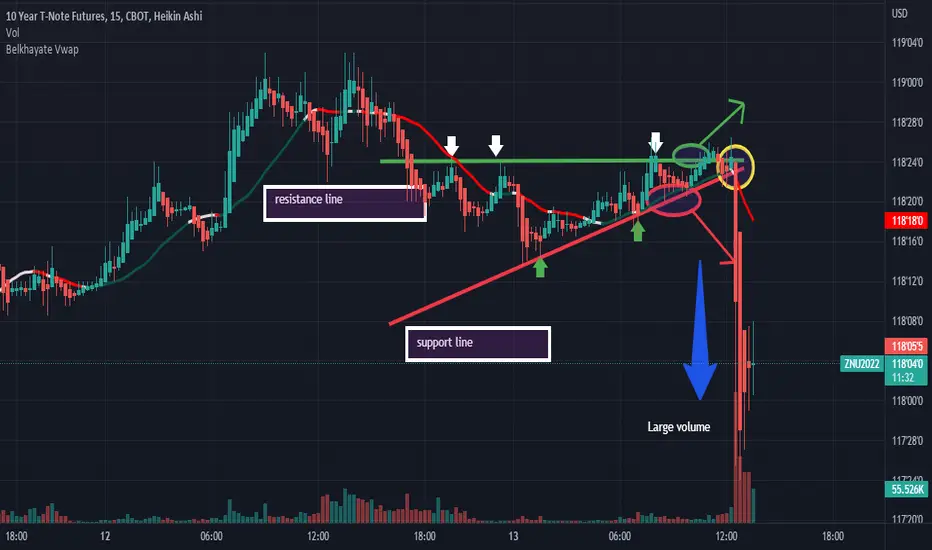
Analysis on ZN1Good morning all! On ZN1 the unit of time that I suggest to you is 30 minutes. Here we have two possibilities. If for example the resistance line is broken with force by a large candle and followed by a large volume we would have a high probability of having an uptrend. On the other hand, if it is the support line which is broken with force as well as the vwap indicator, we would have a strong probability of a downtrend.Thanks.

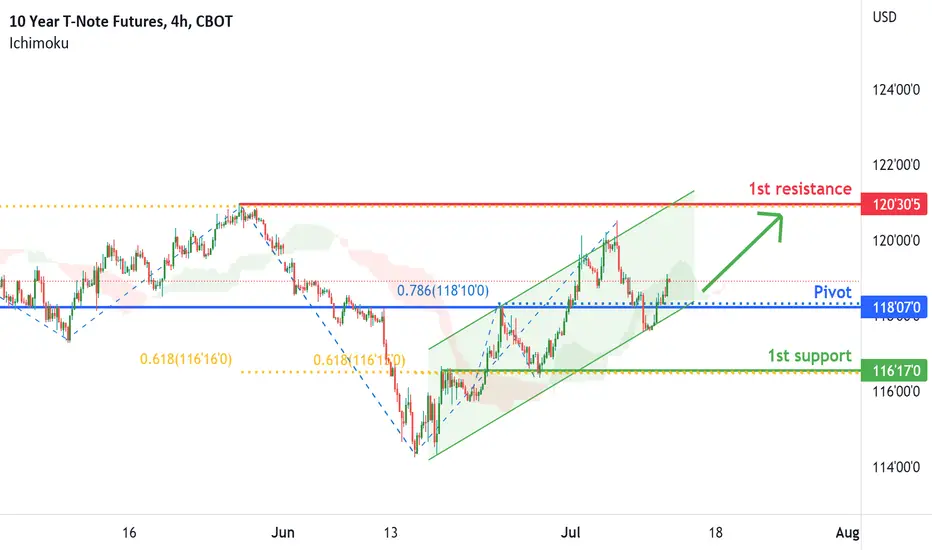
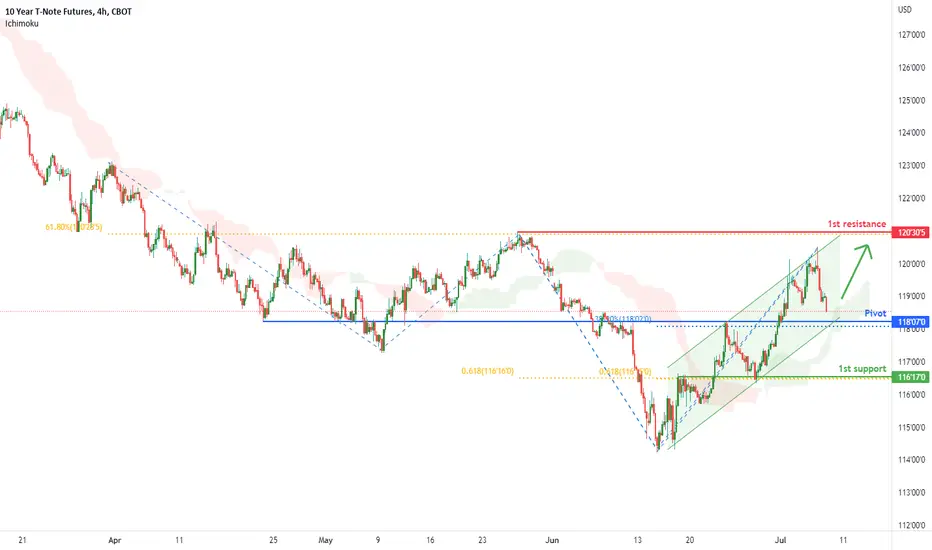
Potential for Bullish ContinuationTitle: 10-YEAR T-NOTE FUTURES (ZN1!), H4 Potential for Bullish Bounce
Type : Bullish Bounce
Resistance : 120'30'5
Pivot: 118'07'0
Support : 116'17'0
Preferred Case: On the H4, with price moving in an ascending trend channel and moving above the ichimoku cloud , we have a bullish bias that price will bounce off the pivot at 118'07'0 in line with the overlap support to the 1st resistance at 120'30'5 at the swing high.
Alternative scenario: Alternatively, price may break the support structure at the pivot and drop to the 1st support at 116'17'0 at the overlap swing low in line with the two 61.8% fibonacci projections.
Fundamentals: US indexes moved moderately higher with better-than-expected US economic reports. Hence, we have a bullish view on the 10-year t-note futures.
Potential Bullish ContinuationTitle: 10-YEAR T-NOTE FUTURES (ZN1!), H4 Potential for Bullish Bounce
Type : Bullish Bounce
Resistance : 120'30'5
Pivot: 118'07'0
Support : 116'17'0
Preferred Case: On the H4, with price moving in an ascending trend channel and moving above the ichimoku cloud , we have a bullish bias that price will bounce off the pivot at 118'07'0 in line with the overlap support and 38.2% fibonacci retracement to the 1st resistance at 120'30'5 at the swing high.
Alternative scenario: Alternatively, price may break the support structure at the pivot and drop to the 1st support at 116'17'0 at the overlap swing low in line with the two 61.8% fibonacci projections.
Fundamentals: US indexes moved moderately higher with better-than-expected US economic reports on Wednesday. Hence, we have a bullish view on the 10-year t-note futures.

NZ!Take your profit at the level of red line.
Do not forget to put Stop loss for your positions (For every position that you want to open)
Please follow your strategy, this is just my idea, and I will be glad to see your ideas in this
post.
Please do not forget the v
"like" W button A@ & Share it with your friends; thanks, and
Trade safe.

NZ1! On the 30 min frame.Take your profit at the level of red line. Do not forget to put Stop loss for your positions (For every position that you want to open)
Please follow your strategy, this is just my idea, and I will be glad to see your ideas in this
post.
Please do not forget the v
"like" W button A@ & Share it with your friends; thanks, and
Trade safe.

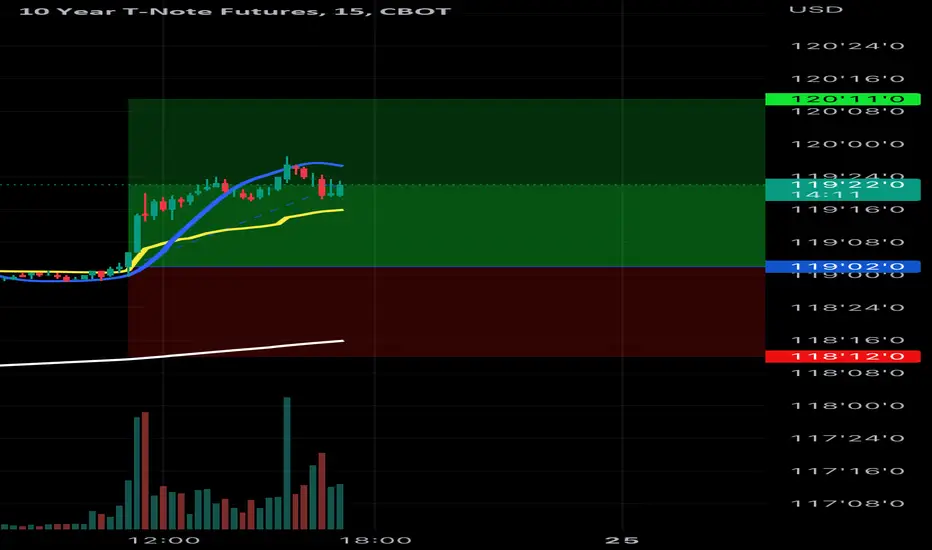
Bonds Rip!!Bonds have soared, blasting through resistance at 118'04 and crossing the vacuum zone to 119'01. We anticipated resistance at 118'04, but momentum came through and we have broken through 119'01, meeting resistance just above this level confirmed by a red triangle on the KRI. The Kovach OBV has picked up, and should momentum continue, we should be able to hit 119'23, the next level. If we retrace, watch the vacuum zone below to 118'04.

AnalysisOn this chart we are in a bullish channel situation. Here, the support line is more important than the resistance line. Therefore, we will have a high probability of a downtrend if and only if the vwap indicator and the support line are forcefully broken by a large red candle accompanied by large red volume. thanks.

je recommende to Long ZN en 15 minHello traders, Everything is clear on the chart for you like always. Good luck. If you like the idea, do not forget to support with a like and follow me for next analysis :) Write your comment and opinion below to me.
