je recommende to Short ZN en 15 minHello traders, Everything is clear on the chart for you like always. Good luck. If you like the idea, do not forget to support with a like and follow me for next analysis :) Write your comment and opinion below to me.
ZN1! trade ideas

Daily ZN analysisDaily ZN analysis
A long position with the target and stop loss as shown in the chart
The trend is still rising, and it has returned to test the ascending area, after touching the rising trend line. We may see a rise
Bonds Edge HigherBonds have continued their rally, with ZN piercing through the 117's to hit our target at 118'04. A brief retracement has taken us back to 117'19, which was a previous target. The Kovach OBV has steadily risen, but has since leveled off a bit, which could suggest we are due for a retracement or some ranging. We should have support at 116'20 if we retrace further. If we are able to breakout, then there is a vacuum zone to 119'01, which is our next target.

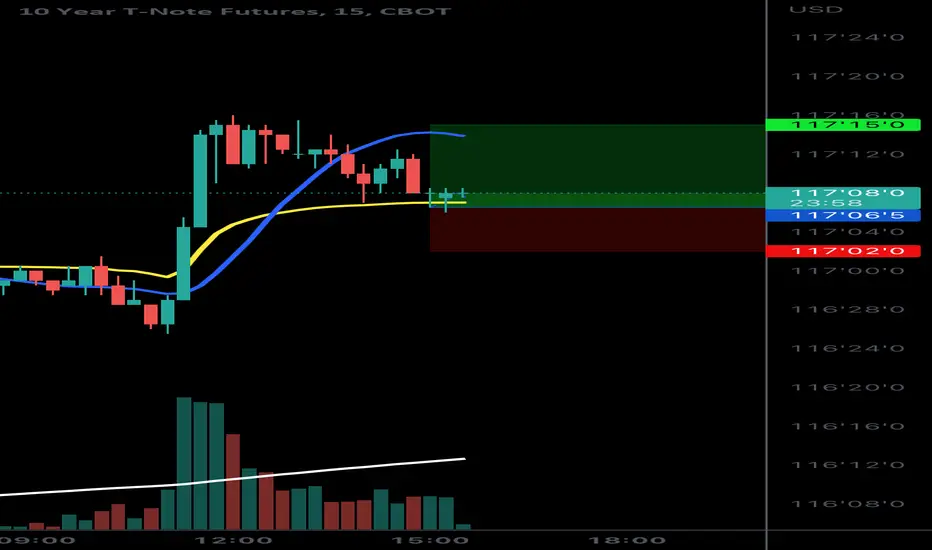
Dead Cat Bounce for Bonds?Bonds have pressed higher following the Fed's 75bps rate hike. We have broken out of 115'29 back into the 116 handle, topping out at our level at 116'20. A red triangle on the KRI suggests that we are facing resistance here. We do appear to be seeing a bull wedge consolidation pattern, but the Kovach OBV has leveled off, so it is likely we will fall from here. Watch 115'29 or 115'03 for support. If we are able to break out further, the next target is 117'08.

ZN - 10 Year Note FuturesNot good, not remotely good...
When we see the 10 - 30 break down...
It's bad.
3.65 ends this mess by simply taking all Assets far lower.
We can consolidate for a period of time, however small the duration.

Bond Yields Soar as APAC Prices in CPI and Fed's ReactionBonds have gotten slammed as yields have soared, smashing through several levels below when we've reported last, as the APAC session prices in CPI data from Friday. We smashed expectations for inflation and investors are rushing to price in the Fed's reaction. Barclays thinks that they will raise rates by 75 bps in order to counter these soaring numbers. We sliced through the 117's with ease and are finally finding support at the base of the 116 handle. We have projected another level of support at 115'29 using inverse Fibonacci extension levels since we've simply run out of support levels for the US ten year. The Kovach OBV is abysmally bearish, however we do appear to be finally leveling off a bit, so perhaps this level will hold. If not, expect resistance from 116'20.

Bonds Stabilize at LowsBonds have found support just above our level at 117'19. We appear to be forming a bear wedge, but the Kovach OBV is flat, suggesting we may range at current levels. After the precipitous decline from 121'00, it is likely that we will establish value in a sideways correction or even a relief rally, before another selloff. If we break down further, then 117'08 is the next level where we should anticipate support. After that, there is a vacuum zone to 116'20. A relief rally could take us as high as 119'01.


DID YOU MISS ALL THE BUY ON ZN ? Here is another oneHello TradingView community
Today I want talk with you about ZN chart.
it's time to buy ZN
Be ready and take care your money. Have a great profit !

How I Use Treasury Futures To Better Execute The E-mini S&P 500Interest Rate Futures are the market leaders this year. Our technical indicators have less of an impact when the Bond & Treasury Markets are on the move and as Traders we have to be aware of when that is and how it impacts the price action in the E-mini S&P 500, E-mini Nasdaq 100 and Russell 2000 Futures. In this video I go over a simple, but effective way I use the 10 YR Futures ZN1! & the Micro 10 YR Treasury Futures 10Y1! to better execute the Indexes.
To learn more about the Futures Products discussed in the video please check out CME Group's Website. I also mention that I trade futures on TradingView using TradeStation so please go to TradingView's website or TradeStation's website to learn more.
Past Performance is not indicative of Future Results. This is for Educational purposes only. Derivatives Trading is not suitable for all Investors.

Bonds SlumpBonds have sold off into the mid 118's after smashing through 119'01. We have gradually drifted up from there, but are meeting resistance at 119'01. It will take some momentum to break through this level and right now it does not seem that ZN can muster the strength. The Kovach OBV has edged upward, but appears quite weak. If ZN is able to somehow break out, then 119'23 is the next target. If we sell off further, then 118'04 is the next target below.

ZN FRAME 30MINWe are in range tendence we need an impultion big volume and long wick to break the vwap indicator the we will be in buy tendence

ZNHello Traders,
ZN is showing us bearish trend
I think we have more chances to sell
follow me and like this

ZN BULLISH TRENDHI , Trader
This week so good for ZN
bullish trend that will give us a good signal to buy next week
Good Luck


Bonds Test Higher LevelsBonds have edged up higher, with ZN hitting our target of 121'00. This is a strong psychological and technical level. We are seeing a bit of a divergence between the price action and the Kovach OBV so unless more momentum comes thorugh, anticipate a dip or some ranging between 120'14 and 121'00. If we dip further, 119'23 should provide support. If we are able to break out further, then we have a fairly wide vacuum zone to the next level and target at 121'28.

I think the market will be in a correction phaseAfter the appearance of the false breakout with a confirmed candle

Daily zn analysisDaily zn analysis
A long position with the target and stop loss as shown in the chart

10 Year treasury yield rising wedgeWho knows what happens to equities when ZN breaks down from a rising wedge?
Another clue we are at the bottom of the market.

Daily ZN analysisDaily ZN analysis
A long position with the target and stop loss as shown in the chart

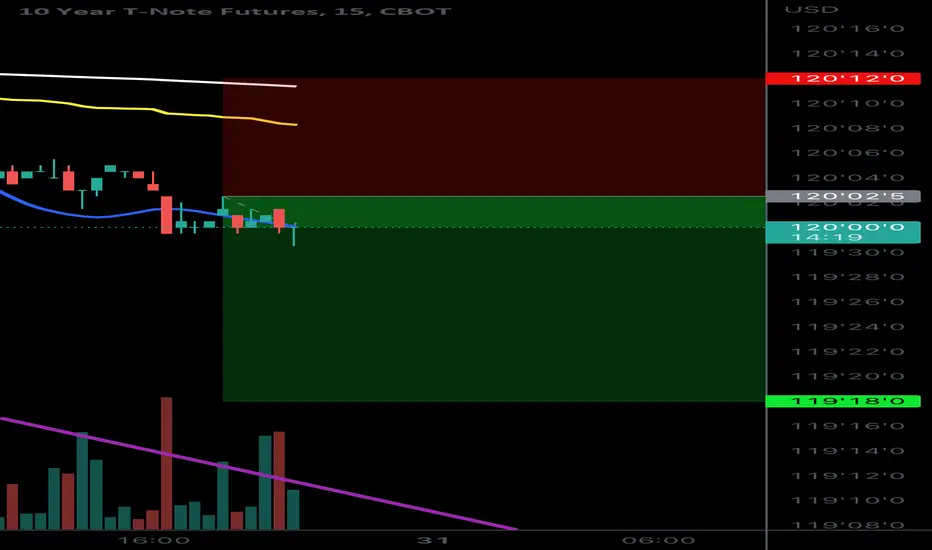
Sell June 10 yr at market - Stop 120.040, 1st TP 117.190Sell June 10 yr at market - Stop 120.040, 1st TP 117.190
**Trading commodity futures and options involves substantial risk of loss.
The recommendations contained in this letter is of opinion only and
does not guarantee any profits. These are risky markets and only
risk capital should be used. Past performance is not indicative of future results**
hypothetical performance results have many inherent limitations, some of which are described below. no representation is being made that any account will or is likely to achieve profits or losses similar to those shown. in fact, there are frequently sharp differences between hypothetical performance results and the actual results subsequently achieved by any particular trading program.
one of the limitations of hypothetical performance results is that they are generally prepared with the benefit of hindsight. in addition, hypothetical trading does no involve fina
ncial risk, and no hypothetical trading record can completely account for the impact of financial risk in actual trading. for example, the ability to withstand losses or to adhere to a particular trading program in spite of trading losses are material points which can also adversely affect actual trading results. there are numerous other factors related to the markets in general or to the implementation of any specific trading program which cannot be fully accounted for in the preparation of hypothetical performance results and all of which can adversely affect actual trading results.
