Oat Futures ( ZO1! ), H1 Potential for Bullish bounceType : Bullish Rise
Resistance : 690'6
Pivot: 679'3
Support : 673'1
Preferred Case: Price is moving above the ichimoku cloud which supports our bullish bias that price will rise from the pivot at 679'3 where the pullback support and 23.6% fibonacci retracement are to the 1st resistance at 690'6 in line with the swing high resistance, 78.6% fibonacci projection and 78.6% fibonacci retracement.
Alternative scenario: Alternatively, price may break pivot structure and drop to the 1st support at 673'1 in line with the overlap support and 38.2% fibonacci retracement.
Fundamentals: Since both countries, Russia and Ukraine, are major exporter of agriculture goods and their persistent war will lead to a shortage of agricultural goods and give us a bullish bias for oat.
ZO1! trade ideas

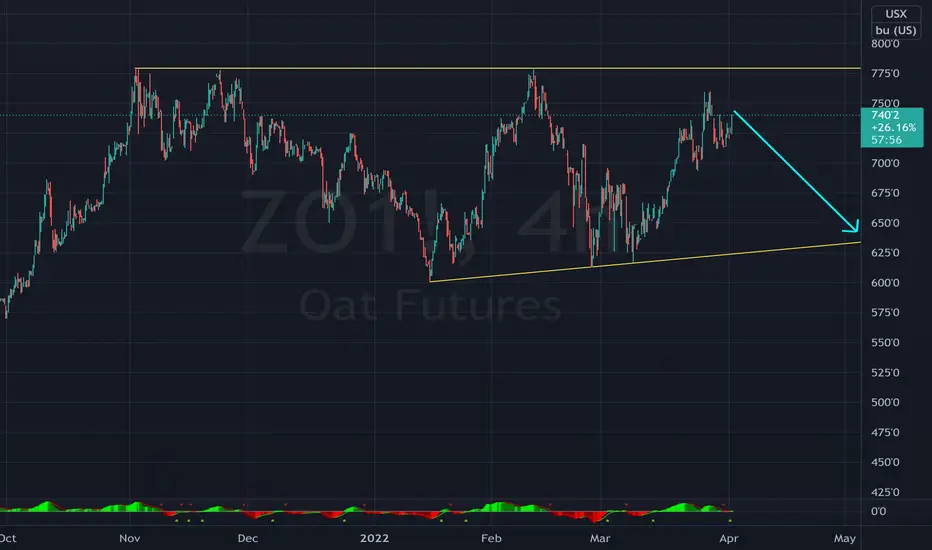
OATS - SHORTWe may get a March CPI print that is slightly higher, but that should be the end of it based on commodity prices and projected GDP going into Q2.
SL is 760 or thereabouts based on your risk tolerence.
Oat Futures ( ZO1! ), H1 Potential for Bullish bounceType : Bullish Rise
Resistance : 731'3
Pivot: 699'2
Support : 684'6
Preferred Case: Price is moving along the ascending trendline and is moving above the ichimoku cloud which supports our bullish bias that price will rise from the pivot at 699'2 where the pullback support is to the 1st resistance at 731'3 in line with the 78.6% fibonacci projection , 61.8% fibonacci retracement and swing high resistance.
Alternative scenario: Alternatively, price may break pivot structure and drop to the 1st support at 684'6 in line with the swing high support.
Fundamentals: Since both countries, Russia and Ukraine, are major exporter of agriculture goods and their persistent war will lead to a shortage of agricultural goods and give us a bullish bias for oat.

Oat Futures ( ZO1! ), H1 Potential for Bullish bounceType : Bullish Rise
Resistance : 731'3
Pivot: 699'2
Support : 684'6
Preferred Case: Price is moving along the ascending trendline and is moving above the ichimoku cloud which supports our bullish bias that price will rise from the pivot at 699'2 where the pullback support is to the 1st resistance at 731'3 in line with the 78.6% fibonacci projection, 61.8% fibonacci retracement and swing high resistance.
Alternative scenario: Alternatively, price may break pivot structure and drop to the 1st support at 684'6 in line with the swing high support.
Fundamentals: Since both countries, Russia and Ukraine, are major exporter of agriculture goods and their persistent war will lead to a shortage of agricultural goods and give us a bullish bias for oat.

Oat Futures ( ZO1! ), H1 Potential for Bullish bounceType : Bullish Bounce
Resistance : 648'1
Pivot: 633'1
Support : 626'0
Preferred Case: With price moving above our ichimoku cloud , we have a bullish bias that price will rise to our 1st resistance at 648'1 in line with the horizontal pullback resistance and 61.8% Fibonacci projection from our pivot of 633'1 in line with the 38.2% Fibonacci retracement and horizontal swing low support.
Alternative scenario: Alternatively, price may break pivot structure and head for 1st support at 626'0 in line with the horizontal pullback support.
Fundamentals: No Major News
Any opinions, news, research, analyses, prices, other information, or links to third-party sites contained on this website are provided on an "as-is" basis, as general market commentary, and do not constitute investment advice. The market commentary has not been prepared in accordance with legal requirements designed to promote the independence of investment research, and it is therefore not subject to any prohibition on dealing ahead of dissemination. Although this commentary is not produced by an independent source, FXCM takes all sufficient steps to eliminate or prevent any conflicts of interest arising out of the production and dissemination of this communication. The employees of FXCM commit to acting in the clients' best interests and represent their views without misleading, deceiving, or otherwise impairing the clients' ability to make informed investment decisions. For more information about the FXCM's internal organizational and administrative arrangements for the prevention of conflicts, please refer to the Firms' Managing Conflicts Policy. Please ensure that you read and understand our Full Disclaimer and Liability provision concerning the foregoing Information, which can be accessed on the website.

Volatility 19 May 22 Energy Commodities Futures Crude Oil CL Futures 19 May 2022
Based on the HV measures from the last 5625 candles our expected volatility for today is around 3.44%
However, in order to increase our accuracy I am going to use a 1.25x multiplier => 4.3%
This is translated into a movement from the current opening point of 4.577
With this information our top and bottom , with close to 84% probability for today are going to be
TOP 111.56
BOT 102.36
Natural Gas NG Futures 19 May 2022
Based on the HV measures from the last 5625 candles our expected volatility for today is around 5.01%
However, in order to increase our accuracy I am going to use a 1.25x multiplier => 6.27%
This is translated into a movement from the current opening point of 0.5
With this information our top and bottom , with close to 85% probability for today are going to be
TOP 8.757
BOT 7.723

Oat Futures ( ZO1! ), H1 Potential for Bullish bounceType : Bullish Bounce
Resistance : 633'6
Pivot: 626'2
Support : 615'0
Preferred Case: With price moving above our ichimoku cloud, we have a bullish bias that price will rise to our 1st resistance at 633'6 in line with the horizontal pullback resistance from our pivot of 626'2 in line with the 61.80% Fibonacci retracement and horizontal pullback support.
Alternative scenario: Alternatively, price may break pivot structure and head for 1st support at 615'0 in line with the horizontal swing low support and 78.60% Fibonacci retracement.
Fundamentals: No Major News
Any opinions, news, research, analyses, prices, other information, or links to third-party sites contained on this website are provided on an "as-is" basis, as general market commentary, and do not constitute investment advice. The market commentary has not been prepared in accordance with legal requirements designed to promote the independence of investment research, and it is therefore not subject to any prohibition on dealing ahead of dissemination. Although this commentary is not produced by an independent source, FXCM takes all sufficient steps to eliminate or prevent any conflicts of interest arising out of the production and dissemination of this communication. The employees of FXCM commit to acting in the clients' best interests and represent their views without misleading, deceiving, or otherwise impairing the clients' ability to make informed investment decisions. For more information about the FXCM's internal organizational and administrative arrangements for the prevention of conflicts, please refer to the Firms' Managing Conflicts Policy. Please ensure that you read and understand our Full Disclaimer and Liability provision concerning the foregoing Information, which can be accessed on the website.

ZO1! Oats Long Trade Idea240min demand! Alternativ ist es auch möglich den weekly hammer zu traden! #longabove

Oats Futures ( ZOK2022), H1 Potential for Bullish RiseType: Bullish Rise
Resistance: 695'7
Pivot: 664'7
Support : 645'7
Preferred case: We are expecting the price to potentially rise from our pivot level of 664'7 in line with 78.6% Fibonacci retracement towards our 1st resistance level of 695'7 which is in line with 38.2% Fibonacci retracement and 78.6% Fibonacci projection .
Alternative scenario: Otherwise, the price might break our pivot structure and trigger a dip to the 1st support level of 645'7 which is in line with 161.8% Fibonacci extension .
Fundamentals: No major news.

Oats Futures ( ZOK2022), H1 Potential for Bullish RiseType: Bullish Rise
Resistance: 695'7
Pivot: 664'7
Support : 645'7
Preferred case: We are expecting the price to potentially rise from our pivot level of 664'7 in line with 78.6% Fibonacci retracement towards our 1st resistance level of 695'7 which is in line with 38.2% Fibonacci retracement and 78.6% Fibonacci projection.
Alternative scenario: Otherwise, the price might break our pivot structure and trigger a dip to the 1st support level of 645'7 which is in line with 161.8% Fibonacci extension.
Fundamentals: No major news.

ZOK2022 (Oats Futures) | H1 Bullish BounceType : Bullish Bounce
Resistance : 758'6
Pivot: 738'0
Support : 716'0
Preferred Case: Price is near pivot level of 738'0 in line with 38.2% Fibonacci retracement and 61.8% Fibonacci projection. Price can potentially rise up to the 1st resistance level at 758'6, in line with 161.8% Fibonacci extension. Our bullish bias is further supported by price trading above the Ichimoku cloud indicator.
Alternative scenario: Price might also dip towards the 1st support level of 716'0 in line with 100% Fibonacci projection and 61.8% Fibonacci retracement.
Fundamentals: No Major News

Oats Futures (ZW1!), H4 Potential Bearish DipType: Bearish Reversal
Resistance : 746'7
Pivot: 729'0
Support : 696'2
Preferred case: Price is approaching our pivot level of 729'0 in line with 138.2% Fibonacci extension . We see the potential for a further dip towards our 1st support level of 696'2 in line with 23.6% Fibonacci retracement . Our bearish bias is further supported by the stochastic indicator where price is trading at the resistance level .
Alternative scenario: Otherwise, price could potentially go to the 1st resistance level which is in line with 161.8% Fibonacci extension and 78.6% Fibonacci projection .
Fundamentals: No major news

Oats Futures (ZW1!), H4 Potential Bearish DipType: Bearish Reversal
Resistance : 746'7
Pivot: 729'0
Support : 696'2
Preferred case: Price is approaching our pivot level of 729'0 in line with 138.2% Fibonacci extension. We see the potential for a further dip towards our 1st support level of 696'2 in line with 23.6% Fibonacci retracement. Our bearish bias is further supported by the stochastic indicator where price is trading at the resistance level.
Alternative scenario: Otherwise, price could potentially go to the 1st resistance level which is in line with 161.8% Fibonacci extension and 78.6% Fibonacci projection.
Fundamentals: No major news

OATS FUTURES (ZOK2022) | H4 Bearish DropType: Bearish Drop
Resistance: 694'7
Pivot: 668'7
Support: 627'6
Preferred case: Price near pivot level of 668'7 in line with 61.8% Fibonacci retracement. Price can potentially drop to our 1st support of 627'6 in line with the 61.8% Fibonacci projection and 78.6% Fibonacci retracement. Our bearish bias is supported by stochastic indicator where it is near resistance level.
Alternative scenario: Alternatively , price may break pivot structure and head for 1st resistance at 694'7 in line with 100% Fibonacci projection, along with a graphical swing high resistance.
Fundamentals: No Major News

OATS FUTURES (ZOK2022) , H4 Bearish DipType: Bearish Dip
Resistance: 666'4
Pivot: 646'5
Support: 616'7
Preferred case: Price near pivot level of 646'5 in line with 38.2% Fibonacci retracement. Price can potentially dip to our 1st support of 616'7 in line with the 61.8% Fibonacci retracement. Our bearish bias is supported by how price is moving below the Ichimoku cloud indicator.
Alternative scenario: Price may break pivot structure and head for 1st resistance at 666'4 which in line with 61.8% Fibonacci retracement and 61.8% Fibonacci projection.
Fundamentals: No Major News.

Oats ZOK2022 ShortFutures short for Oats Sell May 2022 (/ZOK2).
Category: Beyond Technical Analysis, Wave, Gann.

Oat Milk vs Soy Milk in the Last Six MonthsOat milk has exploded onto the scene in the last six months. Oat milk does appear to be a superior product to both soy and almond milks for drinking, smoothies and alternative barista creamers. I believe the demand for oat milk and oat milk products is driving the rise of oat futures and the fall of soy.
CBOT:ZOZ2021
CBOT:ZSF2022

Median Reversion - Short ZO RallyMedian Reversion Opportunity:
Scaling into this market short on productive weekly/monthly highs
Buyback productive weekly/monthly lows
Targeting 350 to exit short position
Good luck to me!
How far north do you think Oats are headed?

Don't like calling tops but I just didDue to the current state of the global economy, commodities like oats are at all time highs. Oat futures are the highest they have ever been and today I called a top...for now. RSI and MACD on daily, weekly, and monthly are very overbought and seems that a correction is needed. I have placed targets 1 and 2 as a short term level. There is still a chance that it may creep up more due to uncertainty and the winter season. I see it coming down and then either will continue up or will go back to what it should be at normal range.
Comment on your thoughts....

Traditional|ZO1!|Long and shortLong and short ZO1!
Activation of the transaction only when the blue zone is fixed/broken.
The author recommends the use of anchoring fixed the blue zone, this variation is less risky.
If there is increased volatility in the market and the price is held for more than 2-3 minutes behind the activation zone after the breakdown, then the activation of the idea occurs at the prices behind the activation zone.
Working out the support and resistance levels of the consolidation zone.
* Possible closing of a trade before reaching the take/stop zone. The author can close the deal for subjective reasons, this does not completely cancel the idea and is not a call to the same action, you can continue working out the idea according to your data, but without the support of the author.
+ ! - zone highlighted by the ellipse is a zone of increased resistance, in this area there is a possible reversal for a correction, please take this factor into account in this transaction.
The "forecast" tool is used for more noticeable display of % (for the place of the usual % scale) of the price change, I do not put the date and time of the transaction, only %.
The breakdown of the upper blue zone - long.
Breakdown of the lower blue zone - short.
Working out the stop when the price returns to the level after activation + fixing in the red zone.
Blue zones - activation zones.
Green zone - take zone.
Red zone - stop zone.
Orange arrows indicate the direction of the take.
Red arrows indicate the direction of the stop.
Priority - The value of the priority parameter implies the author's subjective opinion about the more likely activation zone on this idea, this does not mean that this idea will be 80% activated by this parameter, the purpose of the parameter is to provide for the risk of the inverse of the zone parameter.
Example: "Priority Long: So the author inclines more in the direction of the activation zone open long trades, in this case, when reaching the activation zone in short you should be very careful, because this area may be highly likely to be punched about the breakdown/do not get to take/activate transaction from go to stop."
Please consider this parameter if you use my ideas.
SUM PNL: This parameter displays the total % of all closed ideas of the "new" format (according to the author) for this sector at the time of publication of the idea. The calculation is very "clumsy" just the sum of the profits of all the ideas, based on this indicator, you can more accurately assess the risks when working with my ideas of this sector. I present you the construction of the idea, you can use it yourself as you like based on your subjective view and risks, the calculation of the PNL indicator is carried out only on transactions that the author closed on TV in manual mode or by take.
P.S Please use RM (risk management) and MM (money management) if you decide to use my ideas, there will always be unprofitable ideas, this will definitely happen, the goal of the system is that there will be more profitable ideas at a distance.

Traditional|ZO1!|Long and shortLong and short ZO1!
Activation of the transaction only when the blue zone is fixed/broken.
Working out the support and resistance levels of the consolidation zone.
* Possible closing of a trade before reaching the take/stop zone. The author can close the deal for subjective reasons, this does not completely cancel the idea and is not a call to the same action, you can continue working out the idea according to your data, but without the support of the author.
The "forecast" tool is used for more noticeable display of % (for the place of the usual % scale) of the price change, I do not put the date and time of the transaction, only %.
The breakdown of the upper blue zone - long.
Breakdown of the lower blue zone - short.
Working out the stop when the price returns to the level after activation + fixing in the red zone.
Blue zones - activation zones.
Green zone - take zone.
Red zone - stop zone.
Orange arrows indicate the direction of the take.
Red arrows indicate the direction of the stop.
Priority - The value of the priority parameter implies the author's subjective opinion about the more likely activation zone on this idea, this does not mean that this idea will be 80% activated by this parameter, the purpose of the parameter is to provide for the risk of the inverse of the zone parameter.
Example: "Priority Long: So the author inclines more in the direction of the activation zone open long trades, in this case, when reaching the activation zone in short you should be very careful, because this area may be highly likely to be punched about the breakdown/do not get to take/activate transaction from go to stop."
Please consider this parameter if you use my ideas.
SUM PNL: This parameter displays the total % of all closed ideas of the "new" format (according to the author) for this sector at the time of publication of the idea. The calculation is very "clumsy" just the sum of the profits of all the ideas, based on this indicator, you can more accurately assess the risks when working with my ideas of this sector. I present you the construction of the idea, you can use it yourself as you like based on your subjective view and risks, the calculation of the PNL indicator is carried out only on transactions that the author closed on TV in manual mode or by take.
P.S Please use RM (risk management) and MM (money management) if you decide to use my ideas, there will always be unprofitable ideas, this will definitely happen, the goal of the system is that there will be more profitable ideas at a distance.

