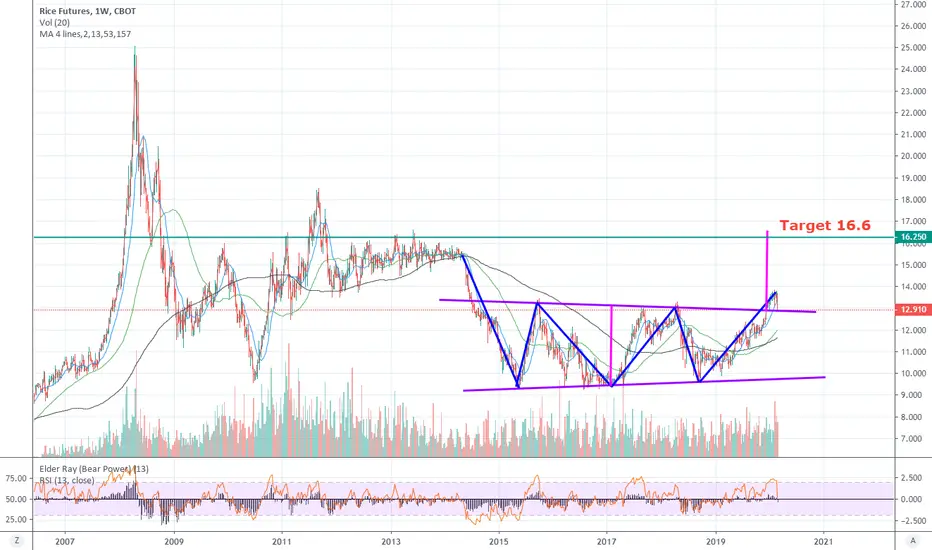
Rice baseRice is forming a base - possible brake out to the upside soon - to monitor closely. Cons: thin market
ZR1! trade ideas


RICE a huge potential to fill the gap 🦐Rice future on the daily chart moved inside a range for a long time.
Recently the price broke the upper structure and move to the upside.
According to Plancton's strategy, if the conditions will be satisfied, we can set a nice long order.
–––––
Follow the Shrimp 🦐
Keep in mind.
🟣 Purple structure -> Monthly structure.
🔴 Red structure -> Weekly structure.
🔵 Blue structure -> Daily structure.
🟡 Yellow structure -> 4h structure.
⚫️ Black structure -> <4h structure.
Here is the Plancton0618 technical analysis , please comment below if you have any question.
The ENTRY in the market will be taken only if the condition of the Plancton0618 strategy will trigger.


RIS FUTURES DAILY ANALIYSISHi friends
the graph of this market shows with a high probability an upward trend towards the 18.340 level.
but at the same time be vigilant to change the market by opposing


Rice Futures Breakout and Wave CountA major 3 wave followed by a triangular consolidation followed by another major 3 wave?
Rice is a basic human commodity needed by many to survive; interesting that it is rising despite the fact that many other agricultural commodities like soy and corn are falling.
Much Love
GL HF
xoxo
snoop


ZR ! - Wow . Rice futuresWow, I can only imagine how high this is going to go up. Pandemic, supply chain issues, food shortages, economic, etc. Great hedge on fiat devaluation.


RICE FUTURES (ZR1!) Monthly, Weekly & DailyTrades made when the monthly, weekly and daily arrows are pointing in the same direction
are the most profitable.
Dates in the future with the greatest probability for a price high or price low.
The Djinn Predictive Indicators are simple mathematical equations. Once an equation is given to Siri the algorithm provides the future price swing date. Djinn Indicators work on all charts, for any asset category and in all time frames. Occasionally a Djinn Predictive Indicator will miss its prediction date by one candlestick. If multiple Djinn prediction dates are missed and are plowed through by same color Henikin Ashi candles the asset is being "reset". The "reset" is complete when Henikin Ashi candles are back in sync with Djinn price high or low prediction dates.
One way the Djinn Indicator is used to enter and exit trades:
For best results trade in the direction of the trend.
The Linear Regression channel is used to determine trend direction. The Linear Regression is set at 2 -2 30.
When a green Henikin Ashi candle intersects with the linear regression upper deviation line (green line) and both indicators intersect with a Djinn prediction date a sell is triggered.
When a red Henikin Ashi candle intersects with the linear regression lower deviation line (red line) and both indicators intersect with a Djinn prediction date a buy is triggered.
This trading strategy works on daily, weekly and Monthly Djinn Predictive charts.
This is not trading advice. Trade at your own risk.

[ZR] Rough Rice might drop soon
Der Preis hat ein Level erreicht, von dem er früher schon öfter abgewiesen wurde.
Zusätzlich haben die Commercials die größte Netto-Short-Position der letzten Jahre aufgebaut.
Der starke Anstieg des Open Interest (in Kombination mit den fallenen COT-Werten) ist ein weiteres Schwäche-Signal.
Der wöchentliche RSI ist überverkauft. Auf Tagesbasis ergibt sich eine Divergenz.
---------------------
The prize has reached a level from which it has been rejected many times before.
In addition, the commercials have built up the largest net short position in recent years.
The sharp rise in open interest (in combination with the falling COT levels) is another signal of weakness.
The weekly RSI is oversold. On a daily basis a divergence is evident.
---------------------
Disclaimer
The analysis does not constitute investment advice or other recommendations, but merely reflects the opinion of the publisher

Long Rice on breakoutFood shortages may become an issue that drives prices higher. Looking to buy breakout in rice and target previous resistance zone.

Rice 2 years going to to touch ATH
rice market making multi patterns such as W pattern . cup and handle pattern . etc
which is bullish sign


