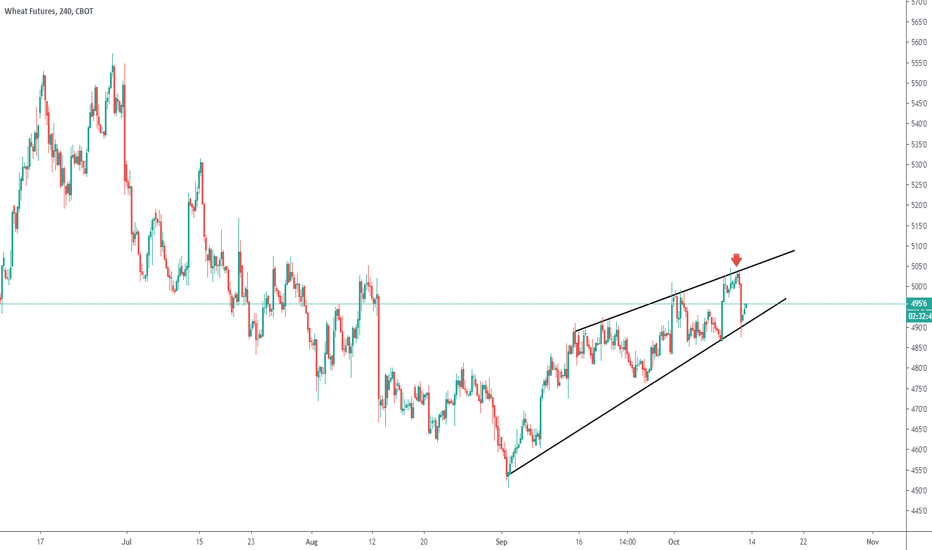
Inverted Ascending Scallop Pattern Is BullishThe pattern is bullish for Wheat up to 5106 measured potential. by oe1231
ZW1! Long Idea- OpinionHi there ! This is a recent analysis for ZW1! that focus on long positions. As you see at the weekly chart the price after a short breakout tend to rebounce to the median of the bollinger bands , this long swing signal it is also confirmed from ADX and RSI also tend to give a solid buy signal after the recent oversold levels. The opinion here is that ZW1! is going to reach the price level of 490$. As we enter the mid spring season prices tend to go higher through crops all over the world and especially in the summer season. **This is not an investment advice , it is only for educational purpose** Invest with safety.Longby OmenFinance2
ZW form side way range Side way range bound and option volatility is down. Short Strange strategyby FinTasticTrading0
WHEAT BOTTOM IS INThere's a reason it bounced 5%+ off the lows today. Running flat correction completed. Look for a flag on hourly timeframe to buy the breakout of. Keep leverage down and think long-term. Longby Mdotee.Updated 10
Potential big downward move for wheat ?Wheat created some sort of triangle and I think it will break downside because: a) we are under huge ressistence b) point of control is at 431 c) seasonality - price of wheat historically goes down from January to June.Shortby Paraman666Updated 112
Wheat getting creamedSeeing a definitive break DOWN in the price of wheat futures. We need to see an immediate continuation in the upcoming week to get properly short. Also watching other AG futures like corn and soybeans for perspective. Shortby fallingumbrellamanUpdated 1
LONG WHEATGoing long wheat on a great dip, wheat seems to have found a bottom from the downward move of the past couple days/weeks. Easy stop loss and decent rewardLongby vxzyoUpdated 1
Wheat finds support? Looking at the July Wheat futures ZWN2019 , the price bounced off of support yesterday and experienced some follow through buying for a higher close today. For analysis purposes, I would call this a long play with a target set for the $5.35 price range. Couple of things I like looking at this chart is the positive trending RSI as well as the solid bounce off of support on the bottom. Overall this chart is trending lower, but I believe there could be short term profit potential on the long side today. A breakout above the 21 day moving average as well as above the 50 day moving average would be beneficial to a long sided trade. Though pressure at the moving average could likely allow bears to take control and push the price toward support. Based on the intraday close I expect some pull back from potential profit taking. The 3 hour view shows a bearish trend reversal in the bar chart, and I wouldn't be surprised to see the price fall back to the $5.21-5.23 area before making a move higher. An entry in that area would be ideal to maximize trade potential. Looking at a weekly view, if the price continues strength tomorrow and Friday we could be looking at a bullish trend reversal. Will have to monitor to see how the week closes. Everything stated above is solely my opinion and by no means a recommendation for a trade. I may or may not hold positions in the instruments I analyze. Lets see where this one goes. Cheers, L.R. Longby SouthFuturesUpdated 1
Wheat is contracting for a breakout Wheat is contracting into a symmetrical triangle and is poised for a breakout. Volatility as measured by a 14 day ATR is the lowest it has been since last year February, this is generally a good sign of a market poised for a large move especially when combined with a definitive consolidation pattern like a symmetrical triangle. Which way the break will occur is another matter entirely, wheat prices have generally been trending downwards over the last 7 years and therefore the recent rally in prices could be seen as simply a correction in the overall larger downtrend. However wheat recently put in a higher lower and higher high and formed what could be interpreted as a very ugly inverse head and shoulders pattern. Based on this observation I am leaning towards the conclusions that a base has been formed in price and a longer term uptrend is beginning to establish itself. Despite this a break in either direction of the triangle will be acted upon. Top side breaks should target 561 while downside breaks should target 478. Stops can be placed at 518 and make sure to seek entries with positive risk reward ratios, ideally 2 to 1 or more. *This is not a recommendation to buy or sell it is for educational purposes only* by MarkE220
WHEAT FUTURES (MAR 2019), 1D, CBOTTrading Signal Long Position (EP) : 515'4 Stop Loss (SL) : 510'2 Take Profit (TP) : 533'2, 549'4 Description ZWH2019 formed Double Repo Buy at 1d time frame. Trade setup with Buy Limit at 0.382 Level (515.5) and place stop after 0.618 level (510.25). Once the position was hit, place take profit before an agreement (533.25) and 549.5 Money Management Money in portfolio : $280,000 Risk Management (1%) : $2,800 Position Sizing $0.25 = +-$ 12.50/std-contract Commission fee = -$5.64/std-contract EP to SL = $5.25 = -$262.5 Contract size to open = 11 standard contracts EP to TP#1 = $17.75 = +$887.5 EP to TP#2 = $34 = +$1,700 Expected Result Commission Fee = -$62.04 Loss = -$2,887.5 Gain#1 = +$5,325 Gain#2 = +$8,500 Total Gain = +$13,825 Risk/Reward Ratio = 4.69Longby SuppasitWechprasitUpdated 1
Wheat - long term chartProblem coming. This is not trading advice and I'm no expert in this.by UncannyDeductionUpdated 220
WHEAT Short Idea ZW1!Hi guys and Merry Christmas ! I post my recent Idea for short positions on ZW1! with a target to 483$. As we see the movement of the ZW1! we see fake breakouts in the recent timeline. After the recent trade wars tall between China - U.S we saw a bullish momentum but it wont last anymore because didnt reached a breakout to drive wheat prices higher. So my target on Wheat is 483 $. Invest with wisdom and be carefull guys !Shortby OmenFinance1
Long wheatLong short run until new years Short in the medium run: new years date till april/may Long long run: onwards Longby showerreport0
#ZW_F $ZW_F #Wheat – BEAR SPREADI built a bear spread ZWU19-ZWN19. There is still a chance, that the price in Wheat will rise to 550. Therefore I wait for good timing. However, it is good to have a plan already. I await an entry about 5,0, SL 4,0 ($50) and PT 10,0 ($250).Longby sysatrading0
#ZW_F $ZW_F #Wheat – SHORTI expect to reach strong S/R 550 very soon. Then could come selling correction. Be prepared!Shortby sysatrading0
WEAT under pressure?Not really. Instead it's building pressure! All the messing around in the sideways area (dark red) is usually managed to "load the boat". If price breaks out to the upside, there's even a chance that we could forget to find a entry like I have projected with the arrows. What also pops into my eyes is the slightly exponential curve that's begin to build with the last couple bars... Putting the Toe into the water is not a bad Idea for me. If the scenario becomes real, I would load up on new pullbacks. P!Longby Tr8dingN3rdUpdated 773
ZW1! Long IdeaHi guys ! My view is a long position for ZW1! according to G20 meeting Trump - Xi Chiping will find a short timely solution about the recent trade war , so agriculture futures will temporarely rebound i think . According to my technical indicators that i use ADX and Vortex index , they signal a buy just for a quick trade . ADX tends to achieve 40 and the + vi is above the -vi which is a buy signal. My target is for now 525. Hope you find that usefull , have fun ! This post is not an advice , it is just an idea so be carefull for any positioning.Longby OmenFinanceUpdated 2
Wheat bull run $ZWI believe Russian aggressive wheat export campaigning has left their supply side depleted again. With rising wheat tenders across the globe and global cooling on top of an end of bullish accumulation phase as per COT analysis the path for higher wheat prices is wide open. Technically the 4h chart fits snugly in a diamond pattern, which upon breach almost always accelerates price action.Longby SpeculatorsTrading1
Wheat - Time for a choiceWheat has failed 4 weeks in a row to break the 525 price barrier - the weekly MA20 which is in negative direction! If we look at the shape it seems that we will head up, but there are several reasons why we should consider shorting: Weekly MA 20 just above 525 with negative direction Daily MA 50 just above 525 with negative direction We are in decline on the monthly charts 1H, 2H and 4H chart overbought Sell at 525 $ SL - 530 Target 485 $ Timeframe 2 weeks! Shortby SlaviToskovUpdated 1