CPI Long Off of March's Monthly Open Possible NY SessionIf I can get a small doji formed after CPI at around the orange line (March's Monthly Open) I will enter Long.
Once entered, stop loss is 120 ticks and target the high 325 ticks.
I believe CPI will be whipsawed and range bound until NY opens up swinging
This is the 2 Hour chart for the pattern.
15 Minute entry time frame
MYM1! trade ideas

MYM-FUTURES-US30- Retracement & ContinuationBias changed from July 13, 2025 to Bullish for a quick scalp. Tomorrow expecting some retracement and a possible move higher. Overall, Bais hasn't changed. Looking for a short into weekly FVG.

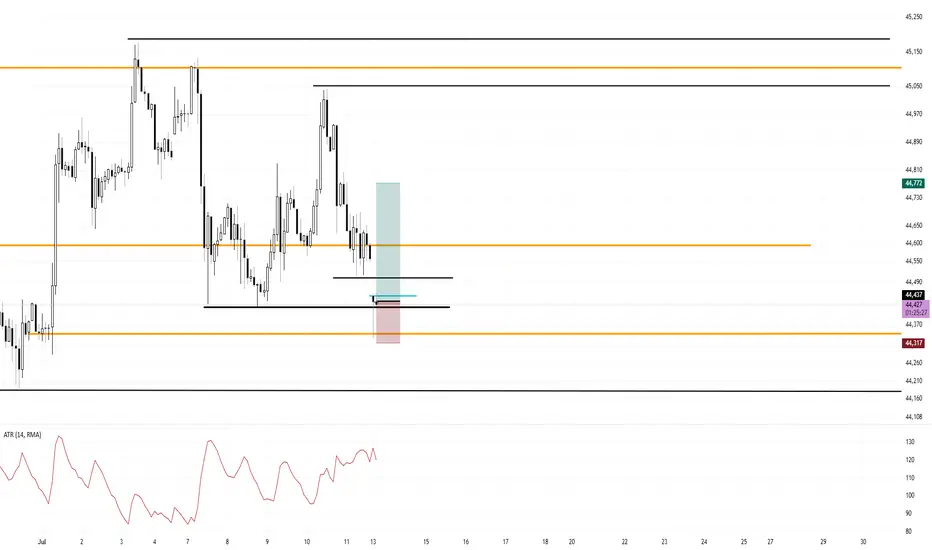
Range Bound Trade Trigger Long Dow FuturesI am Long now at 44,437
120 tick stop
335 tick target
Market gapped down, flushed the lows, tapped the monthly open by a hair and closed back inside. My stop is under the low and under the monthly open. My idea is that is will continue bullish back into the range.
Price is forming a range and mean reverting around March's Monthly Open.
February's Monthly Open was used as Resistance
I am giving this trade idea a go and if it doesn't work out, who cares. I don't know the order of my wins and losses and I must take every trade in my system.
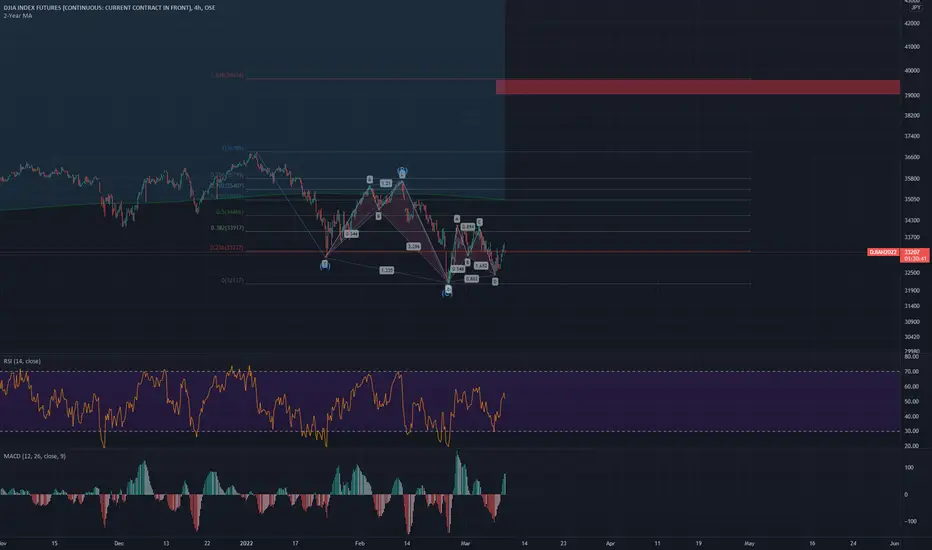
ABC Correction with Bullish Shark & Bat Type 1 Return Target 39KUptrend ABC Correction with Bullish Shark Retrace to .786 & Bullish Bat Type 1 Return Confirmation Higher Low. Full Fib Extension Target Top 39,000-39,600.
DOW JONES-MYM -SELL PREDICTIONThe market has created a new weekly high. Im expecting a short sell off in the upcoming week down into the weekly FVG. Then possible move to the upside.

Full Breakdown of My Trading Strategy Dow Futures DaytradingI will be detailing my strategy to both help others and to help myself fine tune my strategy.
My strategy is one of market maker cycles. The end goal: to trade off of the Daily chart by drilling down to the 15 minutes for entries. Everything revolves around the Daily chart. The only indicator I use is ATR, other than that, pure price action. I use opening prices a lot in my trading.
Starting with the MONTHLY chart:
Every month has the following-
An opening price
A first trading day
A last trading day
These are things that ALL traders see and can't misinterpret.
I will use June as the basis for my examples.
I try to figure out what kind of monthly candle is likely to form. Bullish, Bearish or Doji. I use ATR to try to figure out the likely size also. For Dow Futures, a typical Monthly candle is around 3000 ticks +/-
Going to the Daily chart, I mark the beginning of the month and the end of the month.
The meat of the strategy, and the one quite frankly is the most difficult and the most discretionary, is reading price action on the Daily chart to determine what the next daily candle is likely to do and where it opens at. No strategy is 100% accurate and I do take losses from being wrong. With proper risk management ( I will detail my personal risk management later ) you can still make tons of money being 50% right.
Not everyday is meant to be traded and quite frankly, most days are pure trash. Over 55% of all Daily candles are small, resting Doji days. You are looking for the expansion daily candles.
Starting with the first trading of June:
1. May 29th, Large Doji day and and formed a mother bar
2. May 30th, another doji day and still inside the previous bar
3. June 2nd, opened up in middle of inside bar, Bias for day is Long. Buy near the bottom of the inside bar and a break of Yesterday's Low.
This is an actual trade I took. Once I saw the Doji candle on the 15 minute break below yesterday's low I entered in Long. I will go over stops and targets later. For now, I am explaining how I find my bias and locations.
The next day: start the process over again. Look at the Daily and the context of the bars. Look for swing points, Daily highs and lows. Key Daily bars as signals. I usually like to do this 5 minutes after Asia opens just to see where price opens at. I then mark the daily open with a cyan blue line. If I am Long bias then I want to buy under the open at key levels. I use SP as swing point, a daily high or low that has not been broken yet.
Tuesday, I would have a Long bias again. Because we opened still inside of the mother bar and I see highs not broken, I want to trade in that direction. What is a key level on this Tuesday? I see the monthly open right underneath. The big question I would ask myself on this Tuesday is where in that move can I get in on a pullback for the Long trade?
The market gives you an entry here.
I did not take that trade, I WILL show you the trade I did take on this day. After NY opened, I saw the spike into the monthly open and a doji right ON the open. I slammed Long. Especially, the three swing points to be used as the direction.
Now on to trade management. Stops, Targets. I have the same bracket for every trade, so the only variable is my entry. Once I enter, I set my ATM strategy.
I use the 15 minute ATR to determine my stop loss. This part is also up to the individual trader and is discretionary. I will show you MY strategy.
Take a zoomed-out view of the 15-minute chart with the 14 period ATR, mark the clusters of the peak ATR readings from NY sessions. In this case it is between 70-90. I tend to go towards the upper limit, this case 90. I then use 1.25-1.5 times of this reading based on my account and position sizing. In June AND in July, I am using 120 tick stops.
My targets are all strictly 2.5 risk to reward of what my stop is plus or minus a few ticks for commissions. Since I am using 120 tick stops, my targets are therefore, 300-310 ticks. Going back to my Tuesday trade, the trade management would be a set 2.5R all or nothing. Enter the trade and walk away. Go read a book or play PS5. Go to gym. It will either hit stop, target or close out at 4pm NY close.
2 Winning trades wipes away 5 losers. I have losers all the time with a 50% win rate. I can expect 8 losing trades in a row at any given time. Something I have experienced multiple times.
Now on to my money management strategy. The holy grail of this entire system. Quite frankly, how you enter and your strategy at the end of the day doesn't amount to much. How you manage your money is where professionalism is achieved.
Take your starting account balance, divide it in fours. I will use a 10,000 account as simple math.
10,000
2500 Level 1 14.5R
2500 Level 2 11.5R
2500 Level 3 9.5R
2500 Level 4 8.5R
I risk 1.75% per trade and each level will stay fixed until the next level is reached. In this example, Level 1 will be using $175 risk per trade and a 2.5 risk to reward, $440 reward. You will keep risking $175 per trade until you hit your $2500 profit goal to advance to Level 2. In this case this will take you 14.5R
Now you are on Level 2, you find your new account balance is now $12,500. Find 1.75% of this = $220. Keep using $220 risk until you hit another $2500 in profits. This will take you 11.5R.
Keep repeating these steps until you have hit all 4 profit levels and your account has doubled. Your new account balance is now $20,000. You will start this process over again. To double your account you will need a total of 44-45R. At a conservative approach of 5-7% monthly gain, you can expect to double your account in 8 months +/- depending on how good you can get.
The number one major key to ALL OF THIS IS
One trade per Daily candle. You lose on that day, move on and come again tomorrow
All profit targets need to be hit or close out at 4pm depending on price

Dow Jones Bullish 12 Hour Doji Buy Setup 6:1If I see a 12 hour doji form at the close of this candle (4am my time) I will jump in bullish and target the highs for 600 ticks. I am looking for price to tap into the lows and close as a doji.

Dow Jones Monthly Range Bound GameplanWith updated information I can see price is in a range. Currently, price is in a bullish phase and I am soon expecting a topping process and a roll over. The daily trend should then switch bearish and take out all of the bull side liquidity. The low of April 21st should also be taken.
All of this bearish price action down to revisit the lows will be the order flow needed to then resume the ultimate bullish trend and break out of 46,000.
In a range situation, any swing points will be taken, especially near the middle. Buy low near the bottom 25% and sell high near the top 75%
This is my updated gameplan to trade this giant, 10,000 tick range on the daily chart.
Summary:
Currently, still in bullish phase
Looking for a topping process
Change to bearish phase
Take out of low
Change to bullish phase
Breakout of 46,000

Dow Jones: Bullish Momentum Suggests Strong Upside Potential Current Price: $44828.53
Direction: LONG
Targets:
- T1 = $45550
- T2 = $46300
Stop Levels:
- S1 = $44350
- S2 = $44000
**Wisdom of Professional Traders:**
This analysis synthesizes insights from thousands of professional traders and market experts, leveraging collective intelligence to identify high-probability trade setups. The wisdom of crowds principle suggests that aggregated market perspectives from experienced professionals often outperform individual forecasts, reducing cognitive biases and highlighting consensus opportunities in Dow Jones.
**Key Insights:**
The Dow Jones Industrial Average demonstrates bullish momentum, supported by trading above significant moving averages such as the 50-day SMA and 200-day SMA. Optimism is further fueled by signs of easing inflation and resilience in the labor market. Healthcare and technology sectors are contributing to the bullish outlook, with recent buying activity indicating opportunities for further price growth. However, traders should monitor the key support level at 42,000, as a potential break below this might trigger bearish reversals. Geopolitical risks and global macroeconomic challenges remain potential headwinds but seem subdued for now.
**Recent Performance:**
Over the past few weeks, the Dow has shown steady growth, closing in on prior resistance levels near $45000. Compared to the S&P 500 and NASDAQ, gains have been more measured, reflecting rotation into defensive sectors amid broader market consolidation. The Russell 2000's outperformance suggests increased confidence across smaller-cap stocks, hinting at overall market strength. Volatility indicators suggest low levels, supporting sustained bullish sentiment, although profit-taking risks may emerge during market consolidation phases.
**Expert Analysis:**
Market experts highlight that a continuation of the bullish trend depends on breaking above the $45000 resistance level on sustained volume. This could serve as confirmation of further upward momentum toward the stated price targets. Analysts also stress the importance of holding above the $44400 level, which is a key short-term support, as failing to maintain this level could lead to retracement scenarios. Technical patterns such as upward channels and Fibonacci levels signal further growth potential, while Elliott Wave frameworks suggest the Dow is in an impulsive bullish wave pattern.
**News Impact:**
Recent inflation data, including Core PCE readings, implies that pressures are moderating, which bolsters confidence in equities. Additionally, strong corporate earnings from major players such as Nvidia and Apple contribute to positive sentiment in the technology-heavy components of the Dow. However, ongoing concerns related to geopolitical tensions and tariff adjustments remain risks that could derail short-term bullish prospects.
**Trading Recommendation:**
Based on current momentum, professional insights, and a favorable macroeconomic backdrop, taking a LONG position on the Dow Jones at current prices presents a high-probability opportunity. Ensure rigorous risk management through predefined stop levels at $44350 and $44000, while aiming for price targets of $45550 and $46300, respectively. Close monitoring of upcoming economic reports and geopolitical developments will be crucial to navigating potential market volatility.

Long buddy!’n45,150 by today’s close
I have my divergence with my macd stratagy
We are in an overall uptrend.
Price action is building up for a bullish push imo
What are your thoughts?
Trade safely my friends

Bull Trend Buy Pullback to July Monthly OpenI am looking/waiting for a pullback to July's monthly open for a buy support trade in this strong bullish trend. Based on the close of the 3 month quarterly chart, the trend is EXTREMELY bullish.
This doji candle on the monthly chart for the SP500 is EXTREME Bullishness.
Below are examples of this setup. I jump ALL over this setup as soon as I see it.

Looking for 2 scenarios to play outRight now we are a little extended on this move to some higher levels of liquidity. There was a big move that took place on the 29th that left a major imbalance from 44,301 - 44,264. I'm looking two things to happen.
1) Ill wait for a pullback into a 5M FVG in the 44,362 area for some Shorts.
2) I wait us to drop into the 1H FVG which is that major imbalance i spoke of then ill watch to see if price action and volume confirm a bounce or we break thru and continue lower.

im wrong a bit to earlyAt last after playin around with that compression and sideway around half a month,
i can close my trade.
We are reaching at the selling zone for now and dont know how long it will goes sideway or just make one easy movement.
The sentiment with current snp ath and july fomc fed cut rate around the corner not in sync with current structure but hey resistance is still resistance.

E mini Nasdaq 100. 20.06.2025, Thursday [Day after FOMC]Clean delivery after FOMC. Massive meltdown on NQ.

Dow Futures (YM) Elliott Wave View: Wave 4 Correction UnderwayThe rally in Dow Futures (YM) that began from the April 7, 2025 low remains intact. It is unfolding as a five-wave impulse pattern according to Elliott Wave analysis. Starting from that low, wave 1 peaked at 39,649. A corrective pullback in wave 2 followed which found support at 36,922. The Index then resumed its upward trajectory in wave 3, which itself subdivides into five smaller-degree waves. As shown on the 1-hour chart below, wave 3 reached its high at 43,316. The market is now experiencing a pullback in wave 4.
Wave 4 is taking shape as a double three structure, a corrective pattern characterized by multiple sub-waves. From the wave 3 high, wave (a) declined to 42,518, followed by a wave (b) rally that topped at 42,944. The subsequent wave (c) dropped to 42,223, completing the first leg of the double three, labeled wave ((w)). The Index then rallied in wave ((x)), peaking at 43,069. Then it turns lower in wave ((y)), which also unfolds as a double three. Within this structure, wave (w) ended at 42,424, and a corrective wave (x) rally concluded at 42,860. The Index is now expected to extend lower in wave (y) of ((y)), targeting the 41,297–41,972 range. This decline should finalize wave 4, setting the stage for a potential wave 5 rally to new highs.

DOW ON ROUTE TO Recovery?As bids recapture the huge washout on Friday due to missiles in the sky. The market was due to ignore news and hope that it was over. Now we wait for Powell and Retail sales

YM ShortLooking for a trade reversal and we didn't had that then the market retrace at the New York open highs the I was looking for a trend continuations then the market took the highs and continue the trend to the down side hitting the tp for a 1:2 RR.


ES1, NQ1 & YM1 Daily Trade SetupsIn this update we review the recent price action in the emini S&P SP500, Nasdaq & DowJones futures contracts and identify the next high-probability trading opportunities and price objectives to target. To review today's video analysis, click here!

Dow Futures (YM) Set to Wrap Up Wave 3 SoonSince reaching its low on April 7, 2025, Dow Futures (YM) has shown signs of recovery. The Index has initiated a rally that requires further development to confirm whether the April 7 low will hold as a significant bottom. To establish this, the Index needs to either achieve a new all-time high or complete a clear five-wave structure from the April 7 low. Either of these developments would significantly reduce the probability of the Index undergoing a larger double correction. Currently, the rally from the April 7 low is in progress and appears to be forming an impulsive structure. An impulse is typically a strong bullish signal in technical analysis.
From the April 7 low, the rally has unfolded as follows: wave 1 peaked at 39,427. A corrective wave 2 then followed which ended at 36,882. The ongoing wave 3 is subdividing into a smaller-degree impulse, indicating continued upward momentum. Within wave 3, wave ((i)) concluded at 41,140, and the subsequent pullback in wave ((ii)) ended at 37,998. The advance in wave ((iii)) reached 42,976, with the corrective wave ((iv)) bottoming at 41,236. Currently, wave ((v)) is forming as an ending diagonal, a pattern often signaling the final stage of a move. As long as the Index remains above 41,238, expect one more push higher to complete wave ((v)), which should also finalize wave 3 in the higher degree. Following this, the Index is anticipated to experience a larger-degree wave 4 pullback, likely unfolding in a 3, 7, or 11-swing corrective pattern, before resuming its upward trajectory.

The 10 probabilistic outcomes of any given trade ideaOutlined below, I have come to the conclusion that there are 10, most probable trade outcomes of any given trade idea.
After seeing these outcomes, one can see what outcome is the most challenging for a trader to handle. Everyone is different and can tolerate different scenarios.

Dow Industrials Monthly ButterflyThis one is better than Nasdaq, has indicator divergence as well and is earlier
Possibility for +20% correction from here

