Support and resistance zone: 42278-42321
Hello, traders.
If you "Follow", you can always get new information quickly.
Have a nice day today.
-------------------------------------
(YM1! Chart)
OBV High indicator point: 42321
OBV Low indicator point: 42278
Accordingly, if it falls below 42278, it is highly likely to fall again around 42211.
If it receives support at 42321, it is likely to show an upward trend.
At this time, the resistance zone is 43263-43628.
-
If you look at the 30m chart, the HA-High indicator is located near the OBV High indicator point.
Therefore, if there is resistance near the HA-High indicator, there is a high possibility that it will fall to the HA-Low indicator.
The HA-Low indicator point is currently formed at the 42211 point.
-
Thank you for reading to the end.
I hope you have a successful trade.
--------------------------------------------------
MYM1! trade ideas

June Gameplan Rough Estimation Dow Jones Island ReversalThis is just my rough draft estimation on what I am thinking Dow Jones will do in June.
I am going to sit out the first week to gather data and let the market show its hand to me first.
I have two key levels marked using the weekly candle of April 7th.
The 80% retracement and the candle open.
I am thinking the first week of June to be a sideways candle of sorts to have four choppy weeks up high. Then two consecutive weeks of dump down into 37,500 followed by another monster bull candle to engulf forming the W pattern

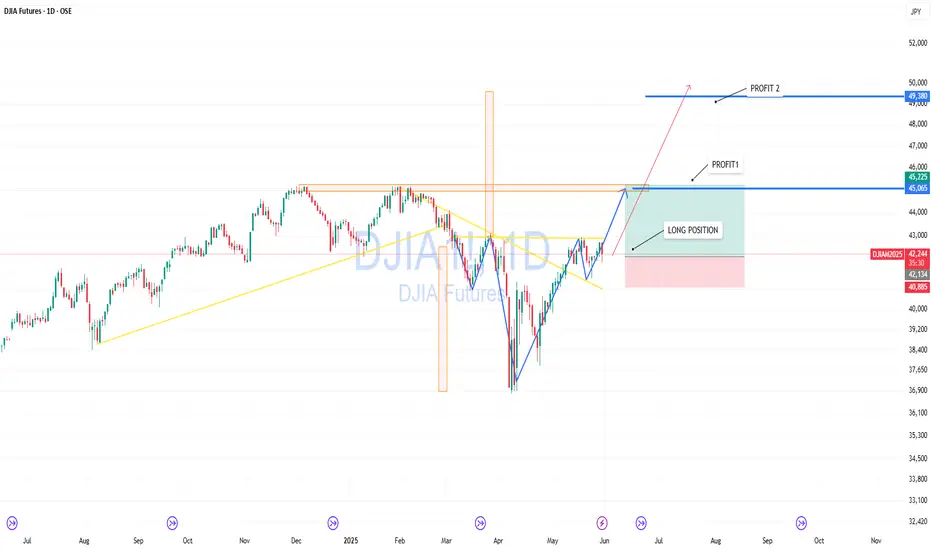
DJIA — Setting Up for Breakout and New ImpulseThe Dow Jones Index is approaching a critical resistance zone. After a deep V-shaped recovery and clear bullish structure, price is preparing for a breakout.
Chart shows a clean long entry with a stop below the recent consolidation. A break and hold above 45,000 could lead to a move toward 46,000, and if momentum holds — up to 49,300.
Partial profit-taking levels:
— Target 1: 45,225
— Target 2: 49,380
Fundamentally, US equity markets remain strong, and DJIA may play catch-up after lagging during the last correction.
Bullish Pullback End of Month BuyAfter I thought we would see a sell continuation off of the March FOMC level of 42,155, price continued bullish.
I am using Thursday and Friday's opening price as support for a pullback. 41,912-41,968
I am expecting Wednesday and Thursday to be profit taking, pullback days in an upward trending bias.
This monthly candle is expecting to close near the highs.
The peak formation low formed confirmed higher prices.
Friday, May 30th 500-700 tick Buying Opportunity

Weekly Outlook on Nasdaq 100, S&P 500, Dow Jones 30Expecting range bound consolidations on Index triad. High Resistance. Not expecting any further monthly highs. Want Internal Liquidity which means shorts. But the daily and the weekly are opposing each other.

Next Week Still Bearish Bias Until Ramped Volume Taken OutThe ramped volume accumulation above the monthly open is the target for liquidity. I am going to be looking for a pullback to form the high of week and a continuation of the down move.
Next week is a short week due to the holiday. Therefore, should be a slow drift down.
This monthly bar is forming a market maker cycle. Instead of Wednesday being the midweek reversal, the 20th formed the mid-month reversal back down to where it started. It may even go a bit beyond.
I will be using 150 tick stops and 375 tick targets next week for 2.5R
I probably will take 2-3 trades. I am currently up 8% so far. If I lose the next three then I will close out May up 5%. I am satisfied with that number. If I can win one and lose one, then I will be closing May up 9.5%

Two potential GLOBEX trap plays.Potential GLOBEX trap Identified on the Dow Jones And Nasdaq Futures. Strong Area's of demand, Retracement would give a nice long set-up. Thoughts?


Tutorial On FOMC Support and ResistanceUsing the 8-hour chart on the Wednesday of an FOMC release, I use a purple line on the 10am EST 8-hour candle's open as the FOMC release price point.
I then use a purple highlighter to signal the date of the release.
I have come to the conclusion that the Dow Jones Futures moves and finds support/resistance using the FOMC releases. Nothing else on the chart matters BUT each release.
There are only 2 ways these levels are used.
1. Support and Resistance levels
2. Mean Reversion levels
I have not found a single source on the ENTIRE internet that describes this phenomenon and would like to think I am quite lucky for stumbling upon this observation.
Below are examples of how/what to look for when using these levels.
Step 1:
On the 8 hour chart, mark the 10am EST opening price of that candle with a purple line and highlight
Step 2:
Project it across and see how price reacts. It will either mean revert or bounce from it
It is hilariously funny to me that price stopped dead within a measly 84 ticks away from the DEC 2023 FOMC level before bouncing.
Support and Resistance:
Mean Reversion:
Price mean reverting around the 10am opening price of FOMC Wednesday.

Long Term Short Trade 2025 Open Limit Order 43,275On my long term swing trading account, I will be placing a limit order sell right on the 2025 open at 43,275 and will be using a 1400 ticks stop. I will be using 2 micros and will risk $1400.
I am targeting the two equal lows for around 7000 ticks or $7000. This will be a potential 5 to 1 risk to reward.
I have drawn two candles that I would like to see happen.
Either the market will blow past my stop or continue the downtrend. I am willing to risk an amount to find out.

Will 41,700 Hold for a Pullback?Price has been bearish over the past few days, and I’m watching the weekly open near 41,300 as a potential target for tomorrow. If price breaks beneath the 41,700 range, my focus shifts back to the weekly open. The question now is — are we seeing the start of a deeper dump toward this year’s lows, or just a bullish pullback aiming for the 42,900 zone?

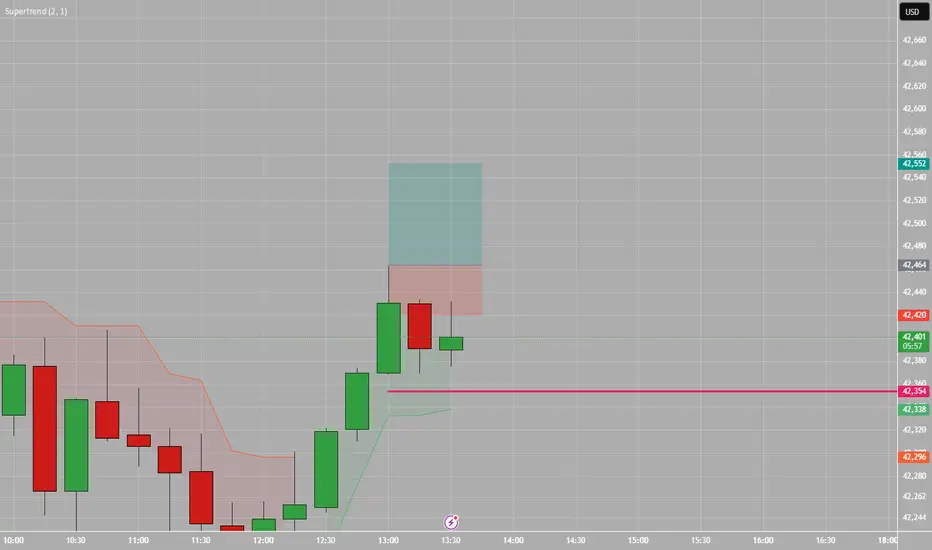
bull push we should see a nice bull push to the upside
Buy Stop : 42,464
Stoploss : 42420
Take Profit: 42552
Pullback monday Follow for fibs and FVG waiting on the gaping that happened today to be filled in the new York session
We are shorting all the way fibs retrace ment 6.18 % should be the first TP

Dow Jones - Fed’s ‘No-Cut’ Gamble BackfiresDespite Disney’s heroics, the Dow closed the week at $41,376 (-0.20%), weighed by Fed Chair Powell’s warning that tariffs could spike inflation and unemployment. Barclays’ “mild recession” forecast added pressure, while utilities (XLU +6.9% YTD) emerged as safe havens.

2025 is 1969? Downtrend to 26,000Just some observations but I can see NUMEROUS similarities between the two charts
There are 8 instances that are EXACTLY the same between the two. This is more than random chance.
1. Range
2. Yearly Open at top of the range before the spike down
3. 1962 and Covid Dump
4. Bullish grind
5. Bearish downtrend STOPPING right AT the top of the range box
6. Bullish retrace back to highs
7. Equal highs suspended above the top of the range box
8. Yearly Open at top of the sell off
9. Yearly downtrend selling off to hit EXACTLY the middle of the range box

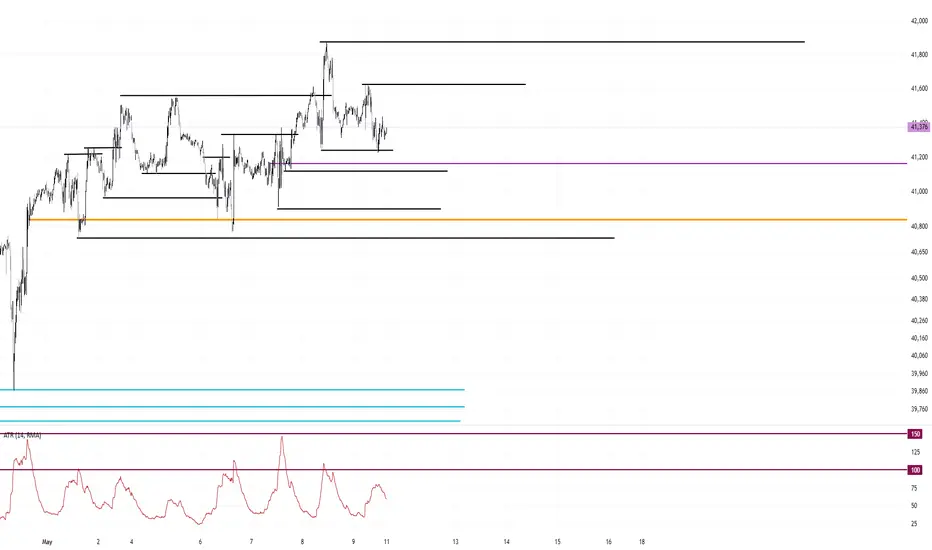
Dow Jones Month of May Has Revealed Its Hand The first 10 days has trades in May and it has now shown its hand on what type of cycle this is. It is not a trending cycle nor a market maker cycle but a range bound cycle.
Just like in February, the Monthly open, in orange, is going to be major support until it breaks through it.
The purple line is May's FOMC release.
Look for a flush of the two equal lows and price to form a bottom slightly under the Monthly Open before a rally higher.
FOMC releases are used as MAJOR, MAJOR support and resistance levels. Expect May's FOMC level to do the same. Expect May's Monthly Open to be the price that price mean reverts around.
The average Monthly range is 3000 ticks. Using the Monthly open as roughly the 50% area, the range should be about 39,200-42,200
Below is a guide for upcoming daytrades and what to look for:
A layering into FOMC with the removal of the three lows. Two of which are suspended above the FOMC level
Major support trade where price flushes the lows under the Monthly Open and a rally back inside.
A short trade after price runs the highs of the two equal highs inside of the peak high.
Moral of the story?
Break out your range playbooks and fade every break. Look for highs and lows to be put in under/ over major swings. Price will run these levels.
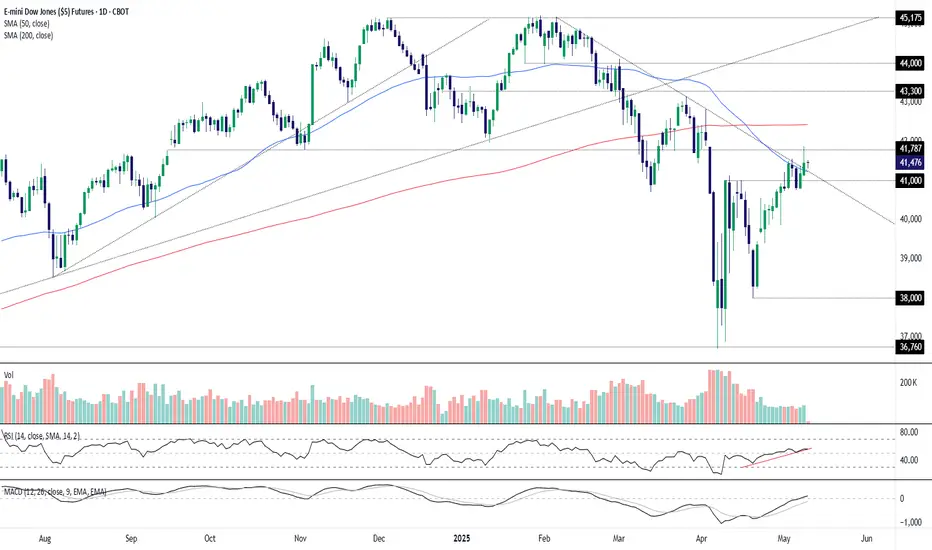
Dow Futures: Bullish Break in Play as Key Resistance FallsDow futures cleared not only the 200DMA on Thursday but also downtrend resistance dating back to the record highs set in February, suggesting a new trend may now be underway. While the initial rejection at 41787 warrants some caution, with momentum indicators swinging into bullish territory, there’s enough here to consider long setups heading into this weekend’s key trade meeting between the U.S. and China in Switzerland.
One idea would be to buy above the 50DMA with a stop below for protection. 41787 is an early hurdle to clear, with a break above opening the path for a potential run towards the 200DMA—that screens as a reasonable target.
If the price reverses and closes back below the 50DMA, the bullish bias would be invalidated.
Good luck!
DS
DOWJONES SHORT potential (Daytrade) Identified a nice potential bull trap above the GLOBEX High. A nice high quality supply zone, ready to trap long break-out traders. Thoughts on this level?

Go LONG on Dow Jones next week**Direction:** **LONG**
**LONG Targets:**
- **T1 = $41825.0**
- **T2 = $42750.0**
**Stop Levels:**
- **S1 = $40200.0**
- **S2 = $39750.0**
**Wisdom of Professional Traders:**
This analysis synthesizes insights from thousands of professional traders and market experts, leveraging collective intelligence to identify high-probability trade setups. The wisdom of crowds principle suggests that aggregated market perspectives from experienced professionals often outperform individual forecasts, reducing cognitive biases and highlighting consensus opportunities in Dow Jones.
**Key Insights:**
Analysts point to robust fundamentals in the U.S. economy, supported by strong labor market data and continued growth in the services sector. Consumer spending remains strong, buoyed by easing inflationary pressures and a confident outlook due to stabilizing interest rate expectations. Positive earnings results from blue-chip corporations in industries like technology and finance further bolster sentiment. Overall, market appetite for equities remains steadfast, making a compelling case for continued upside in the Dow Jones.
**Recent Performance:**
The Dow Jones has demonstrated resilience, finding support at the psychologically significant $40000 level in the previous sessions. It has gained approximately 1.8% over the past week, breaking through resistance at key levels as buying interest intensified. This move suggests strong institutional and retail investor confidence, with the index adhering to its bullish trajectory amidst bouts of volatility.
**Expert Analysis:**
Experts overwhelmingly project bullish sentiment for the upcoming week, citing favorable technical patterns and macroeconomic conditions. On the daily chart, ascending support levels and higher lows indicate robust upward momentum. Momentum indicators such as RSI reveal strengthening buying pressure without overbought conditions, further adding weight to the bullish thesis. Additionally, Wall Street strategists highlight year-end seasonality, which often supports equity strength, alongside a stable geopolitical landscape.
**News Impact:**
Recent Federal Reserve hints at pausing interest rate hikes have injected optimism into markets, signaling potential tailwinds for equity indices like the Dow Jones. Simultaneously, better-than-expected consumer confidence data and progress in debt ceiling negotiations have reassured investors about economic stability heading into year-end trading. Together, these developments have provided a positive backdrop supporting further upside for the Dow Jones.
**Trading Recommendation:**
Based on technical, fundamental, and macroeconomic factors, traders are advised to consider LONG positions in Dow Jones for the upcoming week. Favorable earnings, strong macroeconomic data, and positive sentiment create a conducive environment for continued bullish momentum, with clear technical levels validating the upside potential.

Trade Idea Long at 41,365 with 2 Hour BreakoutI missed the 2 hour breakout at 41,365. If I can get a pullback with the 15 minute chart, I will jump in.
My ideal trade will be 41,365
Stop is 180 ticks
Target is 550 ticks

MAY 1ST - BULLISH IDEA - MYM - DOWJONESThe market seems to fill the 4 hours gap, and took al liquidity acumulated, now it's has all the path free to visit the daily bearish order block.

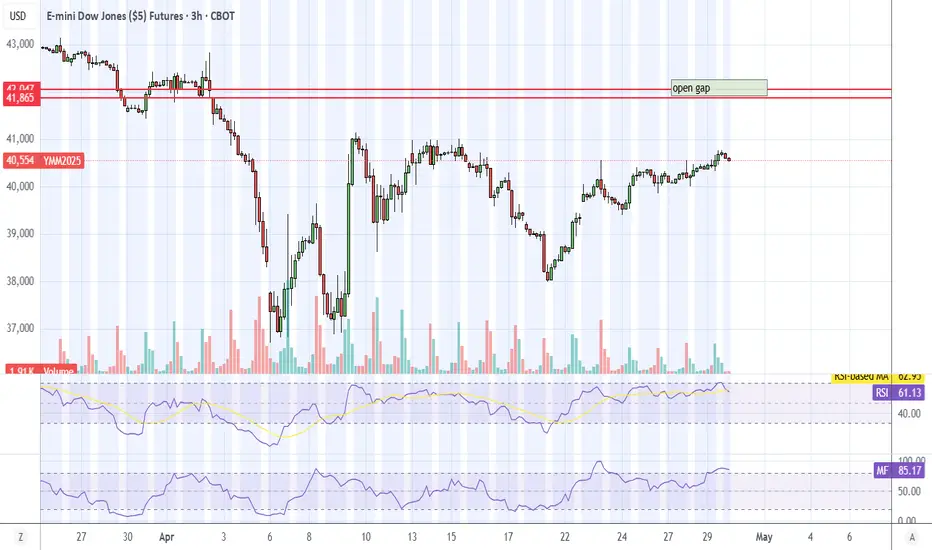
YM (Dow) UpdateThe Dow is the only major index that hasn;t filled the tariff gap. ES, RTY, and NQ have all filled teh gap.
Dow Jones - Market Conditions That Will Make A Grown Man Cry!Dow Jones has not had a good month when comparing with the gains Nasdaq booked or even the recovered losses throughout the month for S&P but I am optimistic about good times ahead.
In the short term, there is high potential for Dow jones to gravitate into the weekly SIBI @ $41,144 - $41,707, especially if NQ continues it's rally into a premium and Sunday NWOG does not change current market structure.
