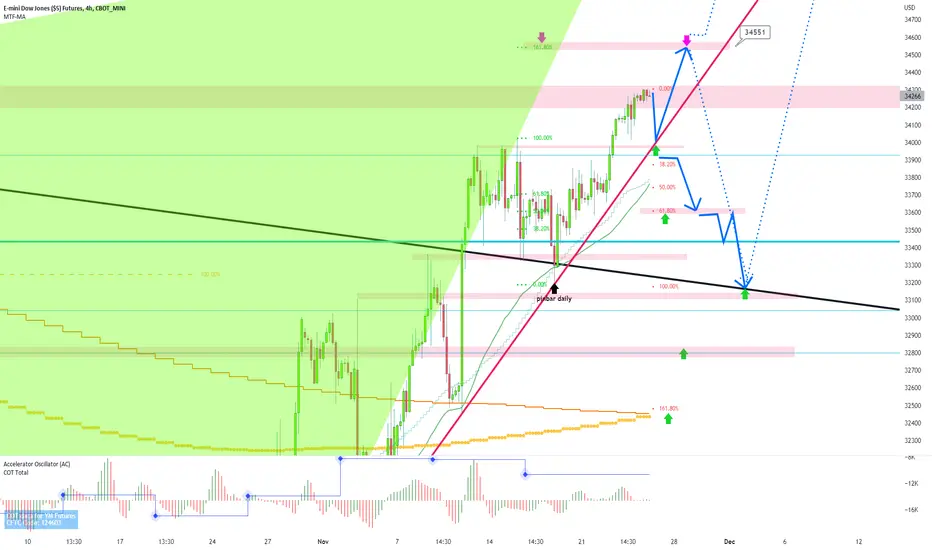
dowjones 4hour : all scenario on dow 1-70% go down and touch support and go up to fibo161
2-30% go down break support and go downer
above green arrow after pinbar come on 1hour or 4hour or daily chart we must buy Sl: pinbar low and hold to new high ok?
if you have old sell,you must close all or hedge them in fibo50 33760-33770...dont forget dow,index, dax sp500 and gold love buy and uptrend so sell on them is very very dangerous..check weekly chart exactly
note: as predict 10 days ago in low dow can go to 35000 even 3600 so be careful from sell and 90% looking for buy
ALERT: END OF YEAR UP TREND RALLY ON INDEX LIKE DAX NASDAQ SP500 AND DOW CAN START
good luck
MYM1! trade ideas
dow 4 hour : it can go down now technical say dow can see fibo50 or fibo61 is best place for buy after pinbar come on 1hour or 4hour or daily chart
if you have old sell close all above green arrow ,,,dow main trend will +up to 35000
goodluck

Dow Jones: Down UnderAfter moving sideways for a while, we're expecting Dow Jones to drop into the orange target zone between 32 762 and 31 980 points to complete wave iv in orange in order to push the trend back up to the orange target zone between 34 305 and 35 466 points. After managing to pull itself up there to compete wave (i) in blue, we expect the course to drop back South.
In our alternative scenario, Dow Jones can't turn the trend up this early and continues to drop below the support line at 31 738 points. After crossing this mark, the course should sink further into the blue zone between 31 331 and 29 789 points until wave alt. (iii) in blue hits its low before turning back up to move North. blue hits its low before turning back up to move North.

Is this rally a bear trap or a resuming bull? This is what we will be discussing today, and we are going to study both its technical and fundamental reasons and subsequently to derive why it is a bear trap? Or could it be a new bull in the making?
I hope this tutorial will be helpful, in enabling you to read into the market with greater clarity.
I have started a trading series, purpose for trading into longevity. Last week was on Buy Strategy, today on Sell Strategy. These strategies shared, they all can be applied to most markets and in different time frames.
Content:
a) The sell strategy – applicable to both:
· Long-term – Fundamental & Technical
· Short-term – Fundamental & Technical
b) Bull or Bear?
Some important dates:
14 Dec 21 - Fed: "Inflation no longer transitory"
10 Nov 22 – Oct CPI @ 7.7%, below expectation of 8.2%
Micro E-mini Dow Jones Futures
Minimum fluctuation
1 index point = $0.50
10 = $5
100 = $50
Of course if you need something more sizable, there is the E-mini Dow Jones Futures.
You can refer to the links below, you will find some of my past video tutorials, on how I time the different markets.
As time passes, you will see how nicely most markets trend along our analysis then.
Disclaimer:
• What presented here is not a recommendation, please consult your licensed broker.
• Our mission is to create lateral thinking skills for every investor and trader, knowing when to take a calculated risk with market uncertainty and a bolder risk when opportunity arises.
CME Real-time Market Data help identify trading set-ups in real-time and express my market views. If you have futures in your trading portfolio, you can check out on CME Group data plans available that suit your trading needs www.tradingview.com

DJI futures long by Cosmic GravityPredicting a substantial 5.7% rise as price consolidates inside the Cosmic Gravity] resistance channel. Take profit is set at "R6 line" and stop loss slightly below the resistance channel.

DOWJONES 4hour : be careful from sell , upper target is 360002 scenario on dow possible
1- if it can break high door will open to 36000
2-in bad scenario with bad news it can go down to fibo50 then start wave2 of uptrend WE MUST BUY IT ABOVE GREEN ARROW AFTER PINBAR APPEAR IN 1HOUR,4HOUR,DAILY CHART and hold it 7-8 day to 36000 area
if you have old sell, close them soon as soon or hedge them with higher size: 1.5*total sell size
ALERT : NEW YEAR WILD RALLY CAN START SO DONT PICK SELL ,LOOKING FOR BUY dont forget like gold DOW love buy and upside trend
good luck


Trading Series – The Buy StrategyI am starting a new Trading Series, the whole idea is to create longevity in our trading career, meaning trading should not be a short-live adventure, but we should trade till right into our retirement age.
We all may have read that many build-up their fortunes through business, investing or even trading and suddenly most of their net worth reduced substantially overnight, and this is what I mean they are running it without longevity.
Trading is a very fulfilling job and can be non-stressful when we understanding there is a framework to recognise opportunity and risk from the markets. Our role in this job is to eyeball both that trading opportunities and risks and then make decisions from there whenever we identify either one of them.
I am going to share with you my experience on how to do that in this whole series – Today we will discuss The Buy Strategy, in the next part, we will discuss the sell strategy. And the subsequent parts on the different strategies and how to manage our trades and trading fund into longevity.
Content:
The buy strategy – it can be applied to both:
· Long-term
· Short-term
Minimum fluctuation
1 index point = $5
10 = $50
100 = $500
There is the micro as well. It is one tenth the size of the E-mini. Very manageable especially for those aspiring traders.
Disclaimer:
• What presented here is not a recommendation, please consult your licensed broker.
• Our mission is to create lateral thinking skills for every investor and trader, knowing when to take a calculated risk with market uncertainty and a bolder risk when opportunity arises.
CME Real-time Market Data help identify trading set-ups in real-time and express my market views. If you have futures in your trading portfolio, you can check out on CME Group data plans available that suit your trading needs www.tradingview.com

DOW 4hour : year end rally can start, dow can go up to 36000strongly advice dont pick sell, looking for buy signal and buy pinbar for hold to new high
if you have old sell you must close all near 33000
good luck

DowJones 33800 Target Achieved, New Pattern EmergingTechnical & Trade View
Dow Jones (emini futures contract)
33800 Target Achieved, New Pattern Emerging
Bias: Bullish Above Bearish below 33600
Technicals
Primary support is 33360
Primary pattern objective is 34400
Acceptance above 34000 next pattern confirmation
Acceptance below 33100 opens a test of 32900
20 Day VWAP bullish , 5 Day VWAP bullish


dow bonesgood afternoon.
---
pretty sweet deadcat bounce on the dow,
but every bear bounce eventually comes to an end.
the end is near for the down bones, and i felt like letting you know about it today.
---
tread carefully in the months ahead, and be ready for a 20%+ decline in the broad markets.

dow 4 hour : are you ready for sell ?wait pinbar come on 1hour or 4hour or daily candel then sell with sl on pinbar high
good luck

Dow futures drop below Cosmic Gravity resistanceE-mini Dow Jones futures price fell below Cosmic Gravity "Resistance Channel" (😎) while "Basis Line" turned pink, indicating a possible bearish reversal. Another market correction may happen if price fails to break above "Resistance Channel".

Dow Jones Weekly Volatility Forecast 7-11 November 2022Dow Jones Weekly Volatility Forecast 7-11 November 2022
We can see that this week our volatility is at 3.25% which declined from 3.45% last week.
Currently according to ATR we are on 55th percentile, and according to VXD we are on 30th percentile, indicating in both cases, that we are currently is a stable market.
Now, based on the implied volatility data that we have for this week, lets look into further details.
We can see that currently there is 20.7% chance, that our candle is going to close at the end of the week either above/below the next channel
TOP: 33385
BOT: 31160
This can also be translated as a 79.3% chance that the market is going to move within this established range.
At the same, looking at the previous high/low values of the candle, and taking into account the entire history available of data, we can expect that there is going to be a
35% chance that we are going to touch the previous high of 33100
70% chance that we are going to touch the previous low of 31700

US30USD YM1! DOW 2022 NOV 07 YM1!
US30USD YM1! DOW 2022 NOV 07
Hope you found our analysis from 17 Oct profitable as you saw
Scenario 2 Signs of Breakout being played out.
Possible scenarios:
1) Continuation long
2) Temporary short if 33326 / 32510 is resisted
3) Long if test of breakout 30513 is supported
Price reaction levels
Short on Test and Reject | Long on Test and Accept
35750 34807 34027
33326 32510 31793
30513 28635
Weekly: Supply > Demand high vol down bar = possible weakness
Daily: UT + down bar + High vol up bar close off high = minor weakness
H4: UT + UT + ND = weakness
Remember to like and follow if you find this useful.
Have a profitable week ahead.

Ym (Dow Jones futures) My target for tomorrow ..
Fib level 31,441
White wave - Daily 21ema
DJT help this rebound some today but DJT is at the end of its run

DowJones Targeting A 34000 TestTechnical & Trade View
Dow Jones (emini futures continuous contract)
Bias: Intraday Bullish Above Bearish below 32200
Technicals
Intraday 32200 is primary support
Primary pattern objective is 34000
Acceptance above 33050 next pattern confirmation
Failure below 32200 opens a test of 31900
20 Day VWAP bullish , 5 Day VWAP bullish
Notes
33240 symmetry swing resistance long positions should be risk free if tested
Headline risk FOMC decision
Prefer to play bullish reversal patterns at support on H4/H1 timeframes

Dow Jones future... Ym1This is how double tops are formed..
Stop loss 33k.
Target 32,200
Jolts and ISM at 10a.m EST tomorrow ..
The pattern is there , let's see if we get a catalyst.
Bearish harami showing on the Daily candle

Dow Jones monthly points to WWIII bear trap ruse just like C0V1DThe strong bounce on a confluence of supports--plus the usual "but we've only seen the beginning of the bear market lol" articles--would strongly suggest that the yellow brick inflation road will continue (see both related ideas) and that recent market activity is another ploy to keep retail anxious / confused / short (valid for as long as the highlighted supports hold)

E-MINI DOW JONES ($5) FUTURESE-MINI DOW JONES ($5) FUTURES
A strong rise to the strongest goals and whoever has made a strong correction is likely to continue the rise and there is also a high likelihood that it will descend into the strong areas of demand.

DowJones 32499 Target Achieved, What Next?Technical & Trade View
Dow Jones (emini futures continuous contract)
Bias: Intraday Bullish Above Bearish below 32400
Option Expiry:
32499 Target Achieved…New Pattern Emerging
Technicals
Intraday 32400 is primary support
Primary pattern objective is 33500
Acceptance above 33050 next pattern confirmation
Failure below 32200 opens a test of 31900
20 Day VWAP bullish, 5 Day VWAP bullish

MYM Showing Signs of Bull Trap | Market Structure"Show me the weekly charts and I'll show you the news"
For MYM/ Dow Jones we have a clear market structure being formed with lower highs and lower lows with a distinct trend line. There is still bearish news with inflation until December at least for the feds, the market is showing signs that we are preparing to go short for the next month or so.
If we close Friday with a wick on the weekly, prepare to enjoy some nice trends that shall sink like the Titanic over the next few weeks.
