DOW fut in easy wayAs we are noticing talks about inflation, rise in dollar etsc.
if we see Dow jones charts observations be like:
from past many maonths is making a Lower highs lower lows BUT now the pattern's changing.
Positives
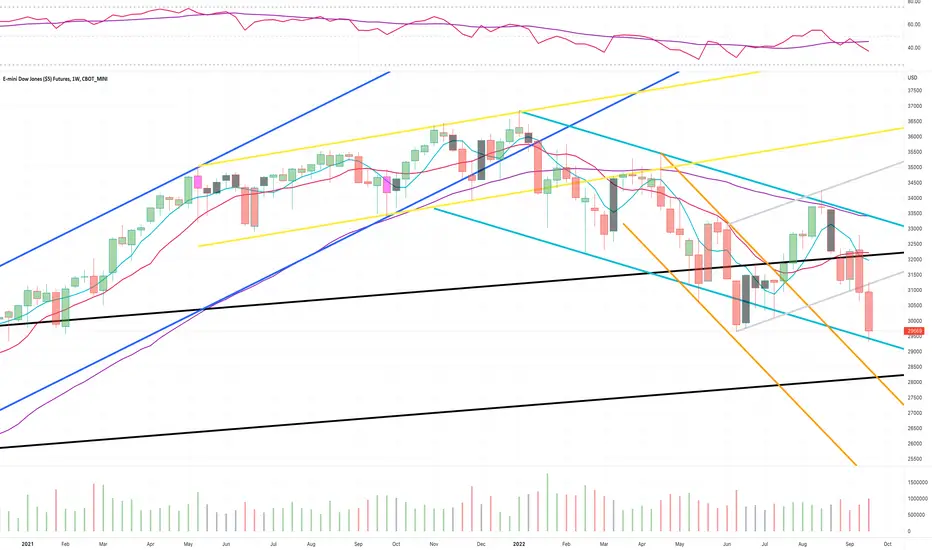
1. 200 MA support : On the weekly charts, it has got support around 29400 levels of 200 MA.
2. RSI divergence : the biggest reflection we are seeing, we can see little bit of RSI now moving otherways as price is tranding towards.
3. if it jump from these lows, we may see LH - LL pattern being distorted ( its very early to say this, but major positive observation)
4. if these levels are breached 26100 is biggest support which definitely will not be affected.
5. looks much oversold
negative
1. Lower lows
2. volume above average.
3. MACD crossover in negative direction.
but as per my observation, if it sustain 29100 - 29200 levels, dow is ready to move in an upside direction. from now onwards can start investing, market shall reward handsomely.
disclaimer: views are personal, please take your advisers advise before taking position.
MYM1! trade ideas

YM1! - Weekly Market Update, 9/26Dow futures finding support at indicated TEAL channel structure below and essentially settled this week double bottoming off of the June 2022 low place earlier this year. The overall market has likely oversold itself these past several weeks, some relief could be anticipated however it appears the bears might be here to stay for a while...
Dow Jones 30600 Make Or BreakIn this update we review the recent price action in the DowJones emini futures contract and identify the next high probability trading opportunity and price objectives to target

My First analysis using SMC at MYMAfter do my analysis i Believe that price will go up price give us CHOCH that point confirme that price will go up and look for previous liqudity we have strong reason why because we have an OB above that OB caused an imbalance that's why we look for long position.
NOTICE:
THIS IS NOT RECOMMENDATION OR SIGNAL I JUST WANT TO SHARE WHAT I HAVE LEARNED

US30USD YM1! DOW 2022 SEP 19 Week
US30USD YM1! DOW 2022 SEP 19 Week
After trapping longs, market declined aggressively. Temporary
demand on average volume has returned, which could be a way of
absorbing any long positions still present in the market.
Possible scenarios:
1) Long if 30406 / 30636 is supported
2) Short on rejection of 31385 / 31042 / trend channel rejection
Price reaction levels
Short on Test and Reject | Long on Test and Accept
32789 31793 31385
31042 30636 30406
Weekly: Higher vol & wider spread than previous bar, close off low
(ave vol on bar itself) = demand coming in
Daily: Ave vol down bar close toward high = Demand overcoming supply
H3: Ultra high vol bar + ave vol up bars = Demand has returned
Remember to like and follow if you find this useful.
Have a profitable week ahead.

YM1! - Weekly Market Update, 9/19All major market indices for this past week have exhibited weakness.
However, none of the futures markets offered a 1%+ settlement confirmation.
Could this be an aggressive retest of the ascending support structure? Possibly.
Could this be setting the stage for a double bottom or even the next leg down? Possibly.
While the bias remains short, the index settlement lack the confirmation I need.

E-MINI DOW JONES ($5) FUTURESA strong requirement has been achieved and a very strong support has been broken. Our goal will be pro support, which is considered strong

Elliott Wave View: Near Term Rally in Dow Futures (YM) Should FaShort term Elliott Wave view on Dow Futures suggests the decline from 8.17.2022 high is unfolding as a zigzag Elliott Wave structure. Down from 8.17.2022 high, wave A ended at 31221. Wave B corrective rally ended at 32791 with internal subdivision as an expanded Flat structure. Up from wave A, wave ((a)) ended at 32029. Wave ((b)) extended below wave A in 3 swing and ended at 30975. Index then rallied in wave ((c)) as a 5 waves impulse.
Up from wave ((b)), wave (i) ended at 31681 and pullback in wave (ii) ended at 31303. Index extended the rally higher in wave (iii) towards 32612, dips in wave (iv) ended at 32488 as triangle, and final leg higher wave (v) ended at 32791 which completed wave ((c)) of B. YM has started to turn lower in wave C. Internal subdivision of wave C should unfold in 5 waves. Expect wave ((i)) of C to end soon with a marginal low, then Index should rally to correct cycle from 9.13.2022 high in 3, 7, or 11 swing in wave ((ii)) before turning lower again. As far as pivot at 32791 high stays intact, expect rally to fail in 3, 7, 11 swing for further downside.

Dow - Further downside expectedThe gloomy outlook for the Dow is likely to head lower with the formation of a triple three corrective wave (WXYZ). Furthermore, we could observe the fractal pattern of Feb and July. And the fall should see a close below 30,000 if it plays out :/

YM buy strong now the YM search 31320 cause we have a strong sell yesterday so we wait the breakout now and good luck guy's

E-mini Dow Jones Futures (YM1!), H4 Potential for Bullish RiseType : Bullish Rise
Resistance : 33432
Pivot: 31862
Support : 30966
Preferred Case: On the H4, with price moving along the ascending trendline and breaking above the ichimoku indicator, we have a bullish bias that price will rise from the pivot at 31862 where the pullback support is to the 1st resistance at 33432 where the overlap resistance, 78.6% fibonacci retracement and 61.8% fibonacci retracement sits
Alternative scenario: Alternatively, price could break pivot structure and drop to the 1st support at 30966 where the swing low support and 78.6% fibonacci retracement are.
Fundamentals: Due to the easing treasury yeilds and oil prices, we have a bullish bias on the Dow Jones Index

E-mini Dow Jones Futures (YM1!), H4 Potential for Bullish RiseType : Bullish Rise
Resistance : 33432
Pivot: 31862
Support : 30966
Preferred Case: On the H4, with price moving along the ascending trendline and breaking above the ichimoku indicator, we have a bullish bias that price will rise from the pivot at 31862 where the pullback support is to the 1st resistance at 33432 where the overlap resistance, 78.6% fibonacci retracement and 61.8% fibonacci retracement are.
Alternative scenario: Alternatively, price could break pivot structure and drop to the 1st support at 30966 where the swing low support and 78.6% fibonacci retracement are.
Fundamentals: Due to the easing treasury yeilds and oil prices, we have a bullish bias on the Dow Jones Index.

US30USD YM1! DOW 2022 SEP 12 Week
US30USD YM1! DOW 2022 SEP 12 Week
Last week's Scenario1 long on support of dotted trend line was good.
Caution: long trap observed, do not chase long.
Possible scenarios:
1) Long if 31450 / 31864-32029 is supported
2) Short on rejection of solid trend line / 32546
3) if triangle formation observed there may be short opportunity
Price reaction levels
Short on Test and Reject | Long on Test and Accept
32546 32029 31864
31450 30975 30406
Weekly: Low vol up bar close off high = minor weakness
Daily: Low vol up bar close off high = weakness
H4: Low vol narrow up bars + narrow close, followed by
ave vol up bar + UT bar = weakness
Remember to like and follow if you find this useful.
Have a profitable week ahead.

YM1! - Weekly Market Update, 9/12Dow futures retained by its 50 day MA based on last weeks price action.
Price was also support by the GRAY channel structure below which contained selling.
As price oscillates between it's recent high (at its 200 day MA) and its recently placed low - I'm anticipating some lack of follow-through broadly.

Dow Jones: Jello 🍮What’s your favorite kind of jello? Cherry? Lemon? Raspberry? Dow Jones seems to prefer woodruff, as the index has been munching through the green jello between 30576 and 31689 points quite efficiently. Now that it has finished wave 2 in green, Dow Jones is already on its way to the next green jello between 37669 and 39249 points, where it should complete wave 3 in green. To take a bite there, it has to climb above the resistance at 34246 points first, though. Also, there is still a 42% chance that Dow Jones could wobble downwards below the support at 30109 points and thus below the next one at 29639 points as well.

E-mini Dow Jones Futures (YM1!), H4 Potential for Bearish DropType : Bearish Drop
Resistance : 32600
Pivot: 31872
Support : 30974
Preferred Case: On the H4, with price moving below the ichimoku indicator, we have a bearish bias that price will drop from pivot at 31872 where the pullback resistance and 23.6% fibonacci retracement are to the 1st support at 30974 where the swing low support and 78.6% fibonacci retracement are.
Alternative scenario: Alternatively, price could break pivot structure and rise to 1st resistance at 32600 where the pullback resistance, 50% fibonacci retracement and 78.6% fibonacci projection are.
Fundamentals: Due to the easing treasury yeilds and oil prices, we have a bullish bias on the Dow Jones Index. We'll need to exercise caution for this setup because our fundamentals and technicals are not completely aligned.

DowJones Pivotal Weekly Trendline TestIn this update we review the recent price action in the emini DowJones futures contract and identify the next high probability trading opportunities and price objectives to target

E-mini Dow Jones Futures (YM1!), H4 Potential for Bearish DropType : Bearish Drop
Resistance : 31860
Pivot: 31240
Support : 30417
Preferred Case: On the H4, with price breaking the ascending trendline and moving below the ichimoku indicator, we have a bearish bias that price will drop to pivot at 31240 where the swing low support and 78.6% fibonacci projection are. Once there is downside confirmation that price has broken pivot structure, we would expect bearish momentum to carry price to 1st support at 30417 where the pullback support and 78.6% fibonacci retracement are.
Alternative scenario: Alternatively, price could rise to 1st resistance at 31860 where the overlap resistance and 23.6% fibonacci retracement are.
Fundamentals: Due to Powell's Hawkish Remarks about monetary policy at the annual Jackson Hole Symposium, we have a bearish view on the Dow Jones Index.

DOW 4HOUR SAY : break 31000 trend line can crash dow to 27000personally i believe dow little will go down but will go up after some zigzag
above green aroow after PINBAR comes on 1 hour or 4hour or daily chart we must pick buy and hold it to new high
be careful stand on fix low size
good luck
US30USD YM1! DOW 2022 SEP 05 Week
US30USD YM1! DOW 2022 SEP 05 Week
Last week's short on retracement/channel rejection was good.
Temporary support at the moment at 31221.
Possible scenarios:
1) Long at 31221 / dotted trend line support
2) Short on rejection of solid trend line / 32029 / 31221 /
retracement on low
volume
Price reaction levels
Short on Test and Reject | Long on Test and Accept
32546 32029 31221
30406 29639
Weekly: Higher vol than previous bar, narrower spread,
close off low = demand coming in
Daily: Ave vol down bar close off low = minor demand
H4: Ultra high vol bar + up bar close of low = minior demand
Remember to like and follow if you find this useful.
Have a profitable week ahead.

YM1! - Weekly Market Update, 9/5Major market indices have all settled BELOW their 50 day moving averages.
I believe the coming weeks are going to be telling for the broader market(s).
Either we regain some traction and take out the recent highs OR we break the recent lows and leg down even further.

E-mini Dow Jones Futures (YM1!), H4 Potential for Bearish DropType : Bearish Drop
Resistance : 32591
Pivot: 31864
Support : 30432
Preferred Case: On the H4, with price breaking the ascending trendline and moving below the ichimoku indicator, ,we have a bearish bias that price will drop from pivot at 31864 where the pullback resistance and 23.6% fibonacci retracement are to 1st support at 30432 where the pullback support and 78.6% fibonacci retracement are.
Alternative scenario: Alternatively, price could break pivot structure and rise to 1st resistance at 32591 in line with pullback resistance, 50% fibonacci retracement and 78.6% fibonacci projection.
Fundamentals: Due to Powell's Hawkish Remarks about monetary policy at the annual Jackson Hole Symposium, we have a bearish view on the Dow Jones Index.
