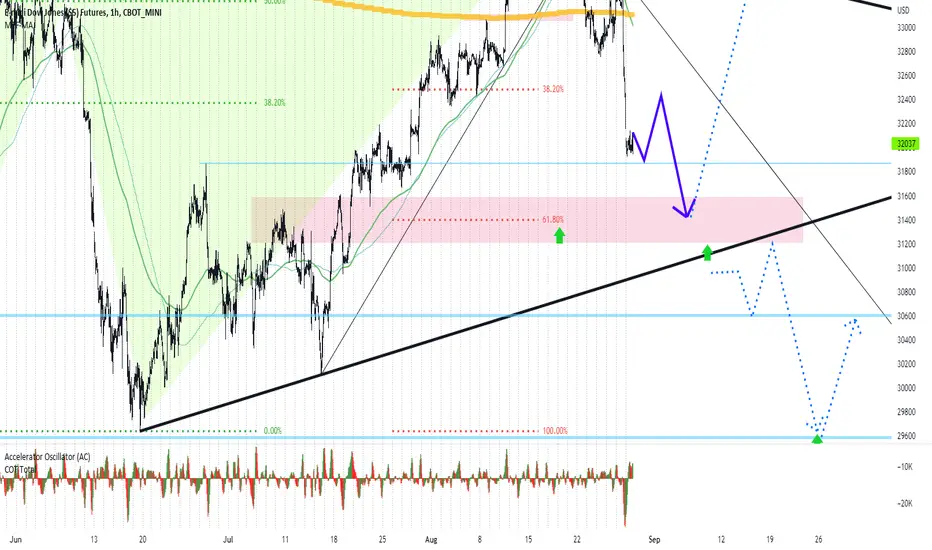
Micro Dow Jones Futures (MYM1!), H4 Potential for Bearish DropType: Bearish Drop
Resistance: 32606
Pivot: 31864
Support : 30405
Preferred Case: On the H4, with price breaking the ascending trendline and moving below the ichimoku indicator, ,we have a bearish bias that price will drop from pivot at 31864 where the pullback resistance and 61.8% fibonacci retracement are to the 1st support at 30405 where the pullback support is.
Alternative scenario: Alternatively, price could break pivot structure and rise to 1st resistance at 32606 in line with pullback resistance, 61.8% fibonacci projection and 38.2% fibonacci retracement.
Fundamentals: Due to Powell's Hawkish Remarks about monetary policy at the annual Jackson Hole Symposium, we have a bearish view on the Dow Jones Index .
MYM1! trade ideas

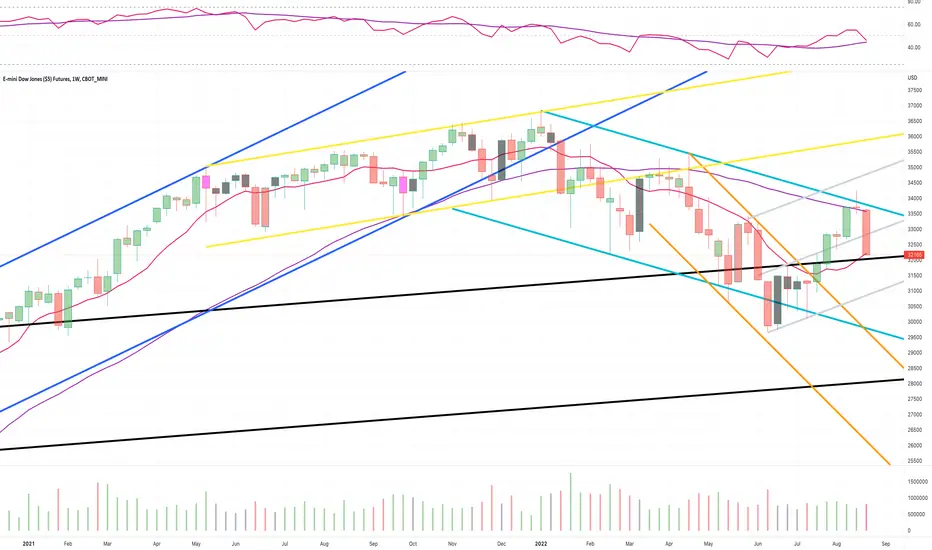
E-MINI DOW JONES ($5) FUTURESVery strong landing and with the break of a very excellent support area and there is a great likelihood that he will continue landing

DOW 1hour say : down move will continue to 31500al eye on fibo 61%
break 31000 trendline can give dow new crash.downtrend
above green arow we can pick buy after PINBAR comes on 1hour or 4hour or daily chart comes SL :pinbar low
good luck
E-mini Dow Jones Futures (YM1!), H4 Potential for Bearish DropType : Bearish Drop
Resistance : 32603
Pivot: 31862
Support : 30417
Preferred Case: On the H4, with price breaking the ascending trendline and moving below the ichimoku indicator, ,we have a bearish bias that price will drop to pivot at 31862 where the pullback support, 100% fibonacci projection , 61.8% fibonacci retracement and 127.2% fibonacci extension are. Should price break pivot structure, we would expect bearish momentum to carry price to 1st support at 30417 where the pullback support is.
Alternative scenario: Alternatively, price could rise to 1st resistance at 32603 in line with pullback resistance.
Fundamentals: Due to Powell's Hawish Remarks about monetary policy at the annual Jackson Hole Symposium, we have a bearish view on the Dow Jones Index.

E-mini Dow Jones Futures (YM1!), H4 Potential for Bearish DropType : Bearish Drop
Resistance : 32603
Pivot: 31862
Support : 30417
Preferred Case: On the H4, with price breaking the ascending trendline and moving below the ichimoku indicator, ,we have a bearish bias that price will drop to pivot at 31862 where the pullback support, 100% fibonacci projection, 61.8% fibonacci retracement and 127.2% fibonacci extension are. Should price break pivot structure, we would expect bearish momentum to carry price to 1st support at 30417 where the pullback support is.
Alternative scenario: Alternatively, price could rise to 1st resistance at 32603 in line with pullback resistance.
Fundamentals: Due to Powell's Hawish Remarks about monetary policy at the annual Jackson Hole Symposium, we have a bearish view on the Dow Jones Index.

US30USD YM1! DOW 2022 AUG 29 Week
US30USD YM1! DOW 2022 AUG 29 Week
Last week's 33205 rejection provided short opportunity.
Possible scenarios:
1) Long at 31780 support
2) Short on rejection of 32546 / 31780 / retracement on low
volume
Price reaction levels
Short on Test and Reject | Long on Test and Accept
34027 33326 32546
31780 31780
Weekly: Ave vol down bar close off low = Supply + some demand
Daily: High vol down bar close toward low = Supply, +
some demand coming in
H4: Climatic + high vol down bar close at low,
breaking down a previous support = bearish absorption
Remember to like and follow if you find this useful.
Have a profitable week ahead.

YM1! - Weekly Market Update, 8/29Dow Futures finding support at its 50 day SMA.
Support below @ 32050 is crucial to hold, if it doesn't this market could leg down.
If broken, next notable support could potentially be found at 30975 for this week.
DowJones Wave Trading Long & Short Set UpsIn this update we review the recent price action in the emini DowJones futures contract and identify the next high probability trading opportunity and price objectives to target

E-mini Dow Jones Futures (YM1!), H4 Potential for Bearish DropType : Bearish Drop
Resistance : 33435
Pivot: 32609
Support : 31851
Preferred Case: On the H4, with price breaking out of the ascending trendline and moving below the ichimoku indicator, we have a bearish bias that price will drop to pivot at 32609 where the pullback support and 38.2% fibonacci retracement are. Once there is downside confirmation of price breaking pivot structure, we would expect bearish momentum to carry price to 1st support at 31851 where the pullback support, 61.8% fibonacci retracement and 127.2% fibonacci extension are.
Alternative scenario: Alternatively, price could rise to 1st resistance at 33435 where the pullback resistance and 50% fibonacci retracement are.
Fundamentals: Due to fears of aggressive interest rate hikes ahead of the central bank’s annual Jackson Hole economic symposium, we have a bearish view on the Dow Jones Index.

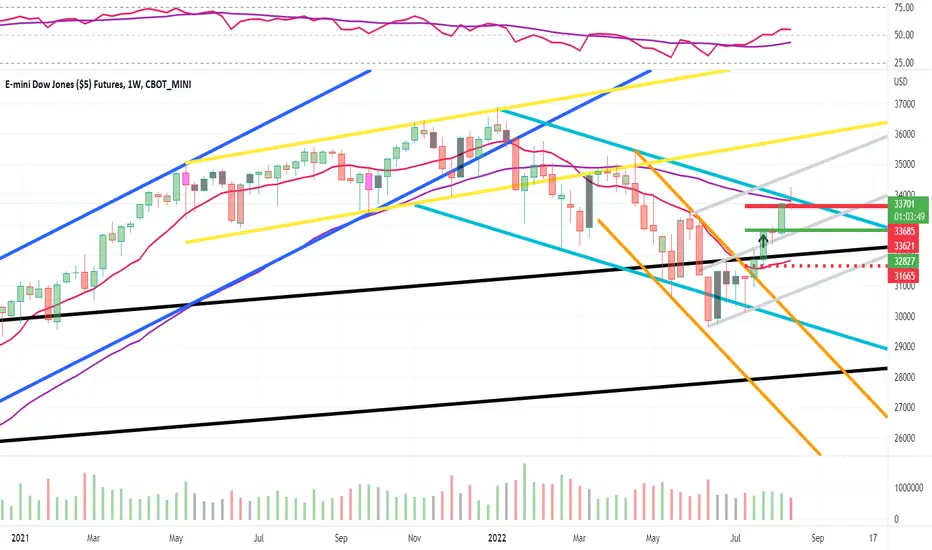
DOW JONES SCENARIOThis is quite a scary scenario, with all the talks of economic disaster, i personally just focus on technical analysis, and allow the charts to do the talking. We have a weekly wedge, that has just formed a doji and next weekly has started to move down, if this closes below 32750 we could see an evening star formation on the weekly timeframe. Overwatch has just pipped the upper boundary, Lower side of the wedge coinsides with a fibb retracement on the daily chart below. Lower tf analysis could catch some nice trades here i feel.

Micro Dow Jones Futures (MYM1!), H4 Potential for Bearish DropType : Bearish Drop
Resistance : 33432
Pivot: 32605
Support : 31852
Preferred Case: On the H4, with price breaking out of the ascending trendline and moving below the ichimoku indicator, we have a bearish bias that price will drop to pivot at 32605 where the pullback support and 38.2% fibonacci retracement are. Once there is downside confirmation of price breaking pivot structure, we would expect bearish momentum to carry price to 1st support at 31852 where the pullback support, 61.8% fibonacci retracement and 127.2% fibonacci extension are.
Alternative scenario: Alternatively, price could rise to 1st resistance at 33432 where the pullback resistance is.
Fundamentals: Due to fears of aggressive interest rate hikes ahead of the central bank’s annual Jackson Hole economic symposium, we have a bearish view on the Dow Jones Index.

CRASH chart #3this is where people lose its money. In 2021 everyone went ALL IN
now it is time to crash and become slave

DowJone Tracking A Potential Wave 4 SequenceIn this update we review the recent price action in the emini DowJones futures contract and identify the next high probability trading pattern and price objectives to target

E-mini Dow Jones Futures (YM1!), H4 Potential for Bullish RiseType : Bullish Rise
Resistance : 34247
Pivot: 33439
Support : 32608
Preferred Case: On the H4, with price moving above the ichimoku indicator and along the ascending trendline , we have a bullish bias that price will rise from pivot at 33439 where the 23.6% fibonacci retracement, 61.8% fibonacci projection and pullback support are to 1st resistance at 34247 where the swing high resistance, -27.2% fibonacci expansion and 127.2% fibonacci extension are.
Alternative scenario: Alternatively, price could break pivot structure and drop to 1st support at 32608 where the pullback support and 38.2% fibonacci retracement are.
Fundamentals: Due to fears of aggressive interest rate hikes ahead of the central bank’s annual Jackson Hole economic symposium, we have a bearish view on the Dow Jones Index. We'll need to exercise caution for this setup because our fundamentals and technicals are not completely aligned.

US30USD YM1! DOW 2022 AUG 22 Week
US30USD YM1! DOW 2022 AUG 22 Week
Last week supply returned for Scenario2 short opportunity.
Possible scenarios:
1) Daily/Weekly analysis showed minor strength,
let's see if demand is able to overcome supply for uptrend
continuation.
2) Short on rejection of 34027 or market
retraced on low volume.
Price reaction levels
Short on Test and Reject | Long on Test and Accept
34807 34027 33205
Weekly: Ave vol down bar close off low = minor strength
Daily: Ave vol down bar close off low = minor strength
H4: Very high volume up bar close off high followed by
down bar = weakness
Remember to like and follow if you find this useful.
Have a profitable week ahead.

YM1! - Weekly Market Update, 8/22DJIA Futures have found resistance at the initial bear market structure and the 200 day SMA.
Price penetrated both but failed to settle above them which is concerning.
We await failure and the next leg down from here or a rally through and settlement above.
Micro Dow Jones Futures (MYM1!), H4 Potential for Bullish RiseType : Bullish Rise
Resistance : 35410
Pivot: 34016
Support : 33432
Preferred Case: On the H4, with price moving above the ichimoku indicator and along the ascending trendline , we have a bullish bias that price will rise to the pivot at 34016 where the pullback resistance is. Once there is upside confirmation that price has broken pivot structure, we would expect bullish momentum to carry price to 1st resistance at 35410 where the swing high resistance, 161.8% fibonacci extension and -61.8% fibonacci expansion are.
Alternative scenario: Alternatively, price could drop to 1st support at 33432 where the pullback support, 23.6% fibonacci retracement and 61.8% fibonacci projection are.
Fundamentals: Since investors have seen evidence that inflation has peaked, we have a bullish view on the dow jones index.

E-mini Dow Jones Futures (YM1!), H4 Potential for Bullish RiseType : Bullish Rise
Resistance : 35402
Pivot: 34029
Support : 33430
Preferred Case: On the H4, with price moving above the ichimoku indicator and along an ascending trendline, we have a bullish bias that price will rise from the pivot at 34029 where the pullback support is to the 1st resistance at 35402 in line with swing high resistance, -61.8% fibonacci expansion and 161.8% fibonacci extension .
Alternative scenario: Alternatively, price could break pivot structure and drop to 1st support at 33430 where the pullback support, 23.6% fibonacci retracement and 61.8% fibonacci projection are.
Fundamentals: Since investors have seen evidence that inflation has peaked, we have a bullish view on the dow jones index.

DowJones Momentum Divergence To Be AddressedIn this update we review the recent price action in the DowJones emini futures contract and identify the next high probability trading patterns and price objectives to target

DJI reversal pointI believe this should be reversing point for markets. DJI is currently at many confluence points and it should start wave C (sharp motive wave)
