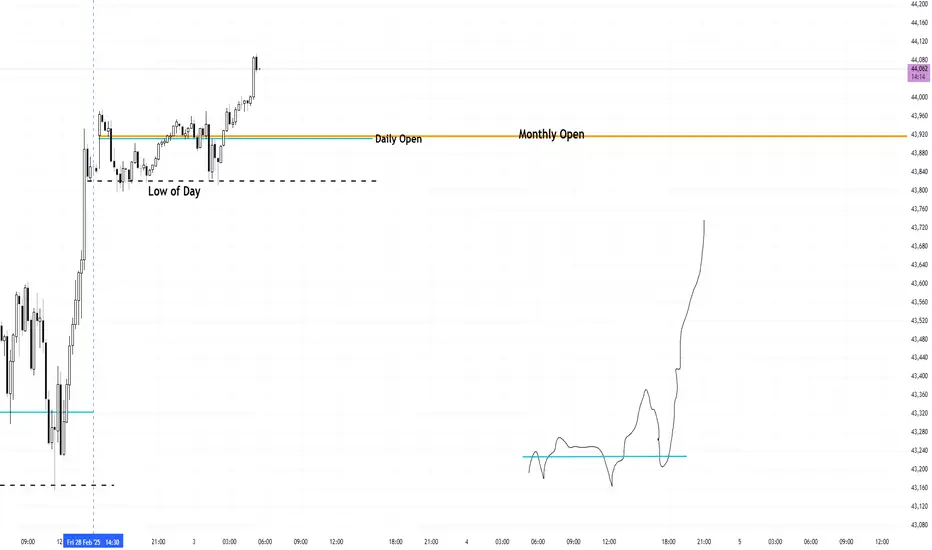
Low of Day/Daily Open Buy Opportunity Trend Day SetupSo far price is setting up for a trend day based on how it is looking. I will wait for a pullback down to the Low of Day and or the Daily open for NY to open. A trend day starts off with NY opening.
MYM1! trade ideas
YM (March 2025) - End of February Analysis- Closed out this month bearish, tickling all time highs but with more uncertainty than ever before. Februarys price range closed inside the previous monthly range
- 42605 bullish monthly order block in my scopes
- Playing the short term ranges going into March is the best solution as the monthly timeframe is indecisive

Bearish Entries 15 Minute Time Frame I am making this post for my own improvement of my entries. If this helps anyone else, then that is a plus as well.
Entry Type 1:
Bearish Engulfments
These types of entries are when NY opens and spikes right through the High of day and engulfs a high bull bar.
Entry Type 1:
Bearish Pullbacks
These types of entries are when NY opens after a move has happened and you are waiting for a better price

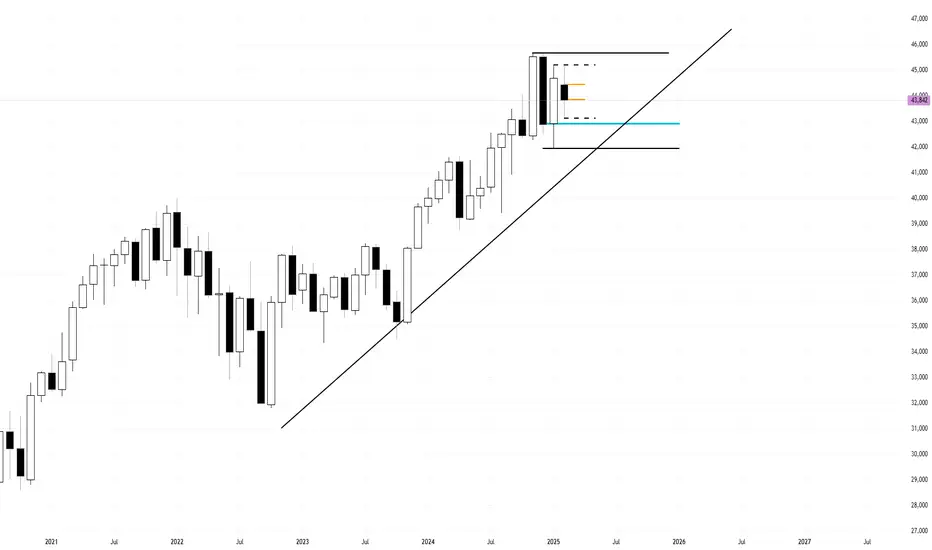
March 2025 Gameplan Another Resting Doji Bar Bearish BiasUsing the monthly chart, I am looking at another bearish month of consolidation. I expect a wick up to February's open in orange and a wick down to January's Low. I then expect a close around 2025's Open at 42,929.
I then expect May to be a monstrous month taking out all of this consolidation and continuing the bullish trend.
I am looking for price to slow down into the 2025 yearly open.
If you look at the monthly candles, February did not take out the high of January. Nor do I expect March to take out the high of February. I DO expect March to take out the Lows of February and January.
I am expecting price to go up first, create the wick but not take out February's high, sell down to take out January's low and rally back up to close at 43,000. A bearish Doji
Dow Jones Bullish Setup for a Friday Dump?We've swept today's lows while also establishing a new high. This sets the stage for a strong buyback toward the 44,000 level, where we previously dumped last Friday. I am eyeing the areas around 43,470 & 43,562 as potential opening structures.
With high-impact news closing out both the week and the month, we should see some solid volatility—presenting prime opportunities to capitalize on market moves. Let’s lock in⚡
Its too early to tell, but I am anticipating a crazy dump on Friday that will take us back to 2025 Open price.

YM - Dow Defies GravityThe frontrunning market book new weekly lows whilst Nasdaq and S&P meander around the 80-90% price range of the previous weeks range.
Going into next week, Dow Jones is the market to lookout for.
Expectation is bearish down to the local PD array @ $43,409 - $43,024

DOW Shorts - Just like that, TP closedThis trade idea was posted earlier and now all positions have been closed, even if someone who followed the trade halfway still got paid big. When you have high resistance liquidity in indices, you look for low resistance assets to trade.

DOW shorts, when ES NQ f. aroundTradingview doesn't show executions but most positions are already taken of and remaining will be adjsuted accordingly. Partial will be taken right on that wick/low and the remaining will be left as runner to see if we can take out the low in H4 tf. SMT with indices, rejection from H4 FVG and invalidation of 15m Bullish FVG.

Dow Jones Possibly Setting Up Double Bottom Low For MarchIf I see a double bottom low forming at the beginning of the new month of March, then this will confirm that there is no dump coming and the highs of February will get taken.
The support from January CPI is holding so far.
Because of this Giant range around 44,000, any dumps seem to be getting bought up.
2025 will be a very ranging year and probably challenging to trade.

Dow Jones Bullish Pullback 2/25I'm looking to take a Long position at the 8:30 AM open tomorrow. I've drawn out two key setups that would confirm my bullish outlook above.
Ideally, we open within the 43,505 - 43,575 range, setting up a strong buying opportunity.
The Daily formed a nice doji candle to close out Monday, so I am really confident that we will see some nice bullish action tomorrow morning.
Just throwing ideas out there, I won't really know anything for certain until around 7am.
Lets collect these ticks⚡

February Closing In Down Month End of Month ShortI will be watching this last bearish candle and how price pullsback into it. I am looking at the daily chart for a doji day and a rolling over of price action. I am expecting it to be near the end of the month. There is only 5 trading days left of February.
Thursday broke out and closed below the last 6 days.
I am letting the market set up and waiting.
Currently, I am up 5% in February. I feel that this is too little of return for the amount of effort I have put in. I believe I am doing too much. I need to hit one or two monster trades in a month with little stress. Hit the trades that are all day holds that the market has no intentions of coming back. Why would I do anything else in between?
Jim Rogers famous quote that really resonated with me,
" I wait until there is money lying in the corner and all I have to do is go over there and pick it up. I do nothing in the meantime "
My trade management approach is using a 100 tick stop after entry, no profit target and hold to the close. I take only the one trade in that day. One loss Max per trading day.
To have the best trading results, paradoxically, one must not trade. Less is more. I am guilty in this. I struggle with an alpha mindset where upon if I am not taking action, then I am not advancing my goals. Although I am a profitable trader, my results could be ten times by doing less.


SPY/QQQ Plan Your Trade For 2-21 : Top Pattern Counter TrendToday's Top pattern in Counter-Trend mode suggests the markets will attempt to move downward, seeking a new support level, then find a base and attempt to roll a bit higher.
I don't expect a big breakdown to take place today, but the YM is already struggling to maintain support - so we may see the ES/NQ break downward if the major markets continue to weaken throughout the day.
I do expect the markets to move into my Major Bottom pattern over the next 3-5+ trading days. So, overall, I expect the markets to reject these recent highs and attempt to move downward.
Gold and Silver should continue to rally with Gold trying to break above $3k and silver trying to break above $35.
Bitcoin is moving into an early stage Excess Phase Peak flagging formation. This should prompt a fairly solid rally phase for Bitcoin over the next few days/weeks.
If my longer-term research is correct, the recent new highs will be rejected and price will roll into a double-bottom type of setup between now and the end of March 2025.
I suspect traders are not prepared for this move and will continue to try to BUY any dip they see over the next 30+ days.
My only advice is to play the short-term trends and avoid position or swing trading too heavily.
The markets are going to become very volatile over the next 30+ days.
Get some.
#trading #research #investing #tradingalgos #tradingsignals #cycles #fibonacci #elliotwave #modelingsystems #stocks #bitcoin #btcusd #cryptos #spy #gold #nq #investing #trading #spytrading #spymarket #tradingmarket #stockmarket #silver

Dow Jones Buy Trade Triggered Now Long 2 Hour ChartTriggered now, is a Long trade at 44,260-275. I currently am Long now at 44.260 using the 2-hour chart. I am using a fixed 125 tick stop and a fixed 500 tick target for a 4 to 1.
If you enter this trade as well, risk appropriately and realize that any trade can fail.
8 Hour Doji forming
2 Hour what I am thinking. A basing near the highs of this candle before a breakout higher

Anticipating a Down Doji Year 2025 Closing Near 42,000I am anticipating a down doji year of 2025 with the high being put in place now. I am expecting a deep pullback to 40,000, followed by a sharp rally back up to the 2025 open of 43,000 and a slow, retracement to close the year at 42,000.
This will give the year a -2.5% return this year.
2026 I am expecting a massive bullish year after this doji year. I am expecting price to open at 42,000 and rip to 48,000-50,000.
Price needs to consolidate, rest and build up strength for the next major rip. 2025, I believe, is not it. One of the biggest clues for me is the post-election exhaustion candle right into the highs and the fact is has little to no follow through. It is THE BIGGEST bar since 2023.
40,000 just happens to be 50% of this move higher
Using the Daily ATR Volatility, you can see volatility has been increasing in the current up channel. Yes, this is a lagging indicator but when it gets back up to the 780 mark, the low will be nearly in place. Let us see if this lines up with the start of 2026
Overall, this is my gameplan for the next two years and I am holding firm until it is invalidated on me.
In summary,
Selling off of 45,000 to dump down to 40,000 in a range consolidation year. Choppy and Whippy. 2025 a doji year.
2026 opens strong and rips to 48,000-50,000


Updated Analysis Dow Jones 45,000 Resistance Bearish RangeLooking at the Daily chart, the entire range is from 42,000-46,000.
Price is bumping its head up against 45,000 multiple times and forming a bearish range.
Major support is down at the 2025 Open from 42,000-43,000.
It looks like one more pump up to around the 45,000 area before the dump.
8 Hour Chart
2 Hour Chart
15 Minute Chart and how selling at the top of the range around 45,000 has been occurring.

Breakdown Of My Personal Strategy On Dow Jones TutorialI will be giving a breakdown on my own personal strategy on how I trade the Dow Jones Futures. I am writing this post for two reasons. First and foremost, to help people. Secondly, to help myself in better understanding.
The way that I trade is using support and resistance, only I don't use the traditional sense of support and resistance that is taught. I use price levels that all traders have. The four price points of a candle stick. I also use major round numbers of 1000's and 500's.
The Open
The Low
The High
The Close
I start by looking at the monthly. When a new month opens, I.E. February 1st for example, I mark the opening price in Orange.
I use the 2 hour chart to look for buying and selling areas, using key price levels. I look for these key price areas and see how price behaves once they get there.
Low of Month trades
Low of the Week trades
Low of the Day trades
High of Month trades
High of the Week trades
High of the Day trades
Example 1:
The month of February opens at 44,444. I mark this with a horizontal trendline in Orange Level 4. I see price gapping down right into 44,000. A major round number of 1000.
I then drill down to my entry timeframe of the 15 minute to find the buy or sell trigger entry. In this case, I saw the creeping push down into the 1000 level followed by a bull 180 bar. I entered in on the close of that bar. I used a 75 tick stop per ATR and a 200 tick target.
This is an actual trade I took. I recently changed my target strategy. I will explain in a bit.
I use the same concept for the following three timeframes.
The Monthly candle
The Weekly candle
The Daily candle
The Monthly candle:
The Weekly candle:
The Daily candle:
Another example of a trade I took
This creeping layering into a level is one of my favorite ways to get into a trade.
What I am doing now is I will set my stop loss of 75 ticks and I will have no profit target. I will hold the trade until the end of the trading day and close it out before the market closes.
On this particular trade, I closed it out at 44,820 for a 343 tick profit.
The weekly template structure:
Some obvious points but worth repeating. Each Weekly candle has an opening price. Within each weekly candle, there are 5 trading days. Monday-Friday. There is a high and low of the week.
Within each trading day, there is also an open, high and a low. I find that when day trading, only to focus on the specific day itself and to not really worry about "multiple time frame analysis"
All you need is the major key levels I laid out up above.
Here is another trade that I took. I was looking for the Monthly open and 44,500 to be used as resistance for a continuation short trade back through the weekly open.
Of course you can see, I lost on this trade. No strategy is ever guaranteed, and I do routinely take losses. My job as a trader is to preserve my capital and to stay alive.
My money management strategy:
One trade per trading day MAX
If lose, DONE
Close out near end of day if in profits, DONE
75 tick stoploss on ALL day trades. DO NOT TOUCH. Do not move up or down. Sometimes to Break-even but only if trade is seeming to fail (more of an intuition thing)
Risk 0.75%-1.5% per trade
Only make slight adjustments to strategy after every 20-trade sample size.
By limiting my losses to only one trade per day, I can easily recover from a losing day with any winning day. Somedays I will either not see the market well, enter at a poor location or just overall, not be at my best. My statistics show that RARELY do I enter another trade after a losing trade, does that one succeed. This tells me that I am not seeing something that particular day. I will wrap it up and try again another day. Revenge trading does no good but to hurt yourself. I admit I am wrong on the day and come back again.
By limiting myself to one trade per day, I am also cutting down on slippage and commissions. Because of slippage and commissions, trading is NOT a zero-sum game, but in fact a NEGATIVE sum game. Your winners are smaller than they ought to be, and your losses are bigger than ought.
I know that I can have three losing days in a row and be right back to normal after one or two winning days. Therefore, who cares if I take a loss. I need to get through the losing trades to find the big, winning trades.

Dow Jones (March Contract) - I Am Sceptical About All-Time HighsUnlike Nasdaq and S&P 500 where their PD arrays was discounted, Dow Jones is showing a different story.
45000 is a stanch psychological resistance level for a number of reasons. For one, a weekly liquidity void in the past aligns with a prior daily SIBI (which price redelivered into and rebalanced 100% of the range) and another gap in the form of a volume imbalance created last week Thursday 6th going into Friday 7th which Dow has rejected this Friday.
Very tight range Dow is working in at the moment and I don’t have the confidence yet to predict Dow jones reaching up into the all-time highs territory yet. There is still a lot more resistance levels to break through compared to ES or NQ.
Going into next week, I want to see 45000 cleared.
Ideally, I want to see a candle body closure above 45227.
Dow Jones is last in the race to attack ATH.

Dow Jones Week 3 February Gameplan Bullish Pullback 44,500 Going into next week, I am looking for a consolidation/layering into the middle of the range and into 44,500. If price sets up, I will look for the Long back up.
In my opinion, I believe price to not return back under February's open, notated in orange. Price should stay above the middle of the range if it will break out bullish.
After the break bullish, I will then expect price to layer into 45,000 as support. But I won't get ahead of myself just yet. Need to wait until we get to that point.
Using the monthly chart as a visualization, this month should end on a strong note.


High of Week 4 to 1 Trade Idea Friday DumpI am expecting price to pull back bullish into my resistance area of around 44,600. Price is still in its bearish move from the high of the range down to the low of the range. Currently, price has been chopping around the middle of the range this week.
This will be my last trade opportunity of the week. I want to see how price reacts into resistance. I will enter if opportunity presents. I will use a 75 tick stop and 300 tick target for a 4 to 1. I feel like the week will end up closing near the low.
The trade I took today ended up in a loss. I was expecting price to pullback and continue short today. Because it is in a range, anything could have happened. I gave it a shot and the trade failed.

Dow Jones (March 2025) - Leading The Stock Index PackAs of recently, YM have been seen stepping outside of the usual correlation ES and NQ would have as YM is presenting me with lower prices for the week than Nasdaq and ES indicating that further downside movement is possible this week.
Just like the rest of the market, there is a lot of indecision based on the tariffs Donald Trump is waiting to implement and we are seeing the splitting image of human psychology for YM. Investors and traders are currently unsure.
