Corn and Rate of Change PotentialCorn – 3mo Continuous: Comparing our current Bull market with the previous 4 major bull markets of the past 50 years. Previous price action on charts are often used for support and resistance. I like to look at rate of change during certain periods. Currently the 24 mo ROC is at 140% and compares to the 95-96 and the 11-12 rally’s. The previous all time high on corn was 8.43 in Aug 12’ and will act as resistance. If we look at potential price above 8.43, the ROC from 71-73 can be used to project potential up to the 9.50 area. If we use the 06-08 ROC that projects price up to 11.35.
**Disclosure** Do not take this as trading advice. The potential is there for 9.50 to 11.35 Corn, but anything could keep us from getting above today’s High.
MZC1! trade ideas

Corn update -25/04/2022expecting a move higher to complete wave ((v)) of 5, key levels to note ( 753 - 813.6 ).

Corn Future (ZC1!), H1 Potential for Bearish ContinuationType : Bearish Continuation
Resistance: 807'4
Pivot: 800'2
Support : 789'6
Preferred case: With price moving below the ichimoku cloud and the descending channel, we see a potential bearish continuation from our pivot level of 800'2 which is in line with 38.2% Fibonacci retracement and horizontal overlap resistance towards our 1st support level of 789'6 which is in line with the horizontal pullback support and 61.8% Fibonacci retracement.
Alternative scenario: Alternatively, price may break our pivot structure and head for 1st resistance level of 807'4 in line with 61.8% Fibonacci retracement and horizontal pullback resistance.
Fundamentals: No major news.

Corn Futures (ZC1! ), H1 Potential for Bearish MomentumType: Bearish Momentum
Resistance: 814'4
Pivot: 807'4
Support: 795'4
Preferred case: We see the potential for a bearish dip from our pivot level at 807'4 in line with 38.2% Fibonacci retracement towards our 1st support level at 795'4 in line with 50% Fibonacci retracement, 61.8% Fibonacci projection and -27.2% Fibonacci expansion.
Alternative scenario: Alternatively, price might break our pivot structure and head for 1st resistance level at 814'4 in line with 78.6% Fibonacci retracement.
Fundamentals: No major news.


Bull FlagOVERBOUGHT on weekly and monthly RSI. RSI is set on 80 versus 70.
Cup and handle.
No recommendation.

Corn Futures Consolidating after S/R Flip$CORN $ZC1! futures currently consolidating above previous resistance turned support. Bull flag setup from a TA perspective. Will long closer to support for another leg up.

Corn is exhausting We have had an amazing commodity run for 2 years, fundamentals are pointing every which way for individual ag coms, as they often do at turning points In the group. BUT the charts are always objective (if your reading them right,) but thats why were here right?
Quarterly:
- Hovering at 15 year highs. Resistance? Time will tell.
Monthly:
- This most recent high is not significant as compared to its predecessor, Also has smaller candles indicating slowing momentum.
Weekly:
- Starting to chop sideways.
- Volume falling as price rises during the last 3 candles.
- Macd divergence from previous highs.
Daily:
- Sitting right at the top of the Keltner Channel for its timeframe.
Wait for trend change confirmation, at least on the daily, before entering.
Enjoy the ride.

Zinc Futures USA Sun Storm Investment Trading Desk & NexGen Wealth Management Service Present's: SSITD & NexGen Portfolio of the Week Series
Focus: Worldwide
By Sun Storm Investment Research & NexGen Wealth Management Service
A Profit & Solutions Strategy & Research
Trading | Investment | Stocks | ETF | Mutual Funds | Crypto | Bonds | Options | Dividend | Futures |
USA | Canada | UK | Germany | France | Italy | Rest of Europe | Mexico | India
Disclaimer: Sun Storm Investment and NexGen are not registered financial advisors, so please do your own research before trading & investing anything. This is information is for only research purposes not for actual trading & investing decision.
#debadipb #profitsolutions

CORN: Rounding Bottom?? + RectangleMain Pattern: Weekly Rounding Bottom??
Confirmation Pattern: Daily Rectangle

FOOD CRISIS bad for stocks?There has been a lot of talk since the Ukraine - Russia war started that the rising prices in the agricultural sector will cause a new Bear Cycle in the stock market. Commodities have been rising across the globe as a result of an inflation build up in recent years, accelerated by the COVID pandemic, but with agriculturals in particular, the story is a little different.
This chart illustrates Corn (blue trend-line), Sugar (orange), Soybeans (teal), Oats (black) and in the pane below them is the S&P500 index (green trend-line). As you see, even though price rallies on the agriculturals have caused minor (from a long-term perspective) pull-backs on S&P (as they did in February/ March), they only coincided with a Bear Cycle in the 2007/08 Bear Cycle, which of course was caused by the subprime mortgages.
So the conclusion we can draw is that global indices' reaction in February/ March with a strong pull-back, was very natural based on the long-term historic action. A Bear Cycle has to have a strongest macro-economic catalyst, strong enough to affect the fundamental structures of the capitalistic/ monetary system that supports the stock markets.
--------------------------------------------------------------------------------------------------------
Please like, subscribe and share your ideas and charts with the community!
--------------------------------------------------------------------------------------------------------

Corn Futures ( ZC1! ), H1 Potential for Bearish ReversalType : Bearish Reversal
Resistance: 778'0
Pivot: 772'6
Support : 762'0
Preferred case: We see the potential for a bearish reversal from our pivot at 772'6 in line with 61.8% Fibonacci retracement towards our 1st support at 762'0 in line with 78.6% Fibonacci retracement and 100% Fibonacci projection. Our bearish bias is supported by the stochastic indicator where price is trading at resistance level.
Alternative scenario: Alternatively, price may break our pivot structure and head for 1st resistance at 778'0 in line with 61.8% Fibonacci projection and 161.8% Fibonacci extension.
Fundamentals: No major news

Profiting From Higher Food Prices and Shortages in 2022March comes in like a lion and goes out like a lamb, and April showers bring May flowers. In the northern hemisphere, farmers are now planting the crops that will feed the world after the fall harvest season. Mother Nature is typically the primary determinate of agricultural products as the weather conditions determine if there will be enough supplies to feed the ever-growing global population. As the world addresses climate change, corn and soybeans requirements for biofuel have put additional upside pressure on prices over the past years. Moreover, rising inflation has increased production costs. The war in Ukraine presents a unique set of concerns for the products that provide nutrition and fuel.
Grains and oilseeds are going into the 2022 US crop year at very high prices
The weather is secondary as the war in Ukraine threatens supplies
Higher prices in the US- The potential for famine in other regions
Food shortages lead to political change
Beans above the teens, corn in the double digits, and wheat explosions could be on the horizon in 2022 and beyond
In 2021, a composite of grain, oilseed, and other leading agricultural products rose 29.71%. In Q1 2022, the composite moved another 18.89% higher. Corn, soybean, and wheat prices are sky-high in early April 2022 as the seeds go into the ground, and the prospects for even higher prices are rising each day.
Grains and oilseeds are going into the 2022 US crop year at very high prices
Nearby May CBOT corn futures settled at $7.4875 on March 31, up 26.21% in Q1.
The chart shows corn’s price was higher on April 8 at the $7.6875 per bushel level. Corn’s all-time high was in 2012 at $8.4375, and the coarse grain reached $8 in March before correcting.
Nearby CBOT soybean futures settled at $16.18250 per bushel on March 31, posting a 21.79% gain in Q1 2022.
Soybean futures were higher at around the $16.89 level on April 8 after reaching a high of $17.65 in February 2022. In 2012, the beans reached a record high of $17.9475 per bushel.
CBOT soft red winter wheat is the most liquid wheat futures contract and a global price benchmark. The CBOT wheat rallied 20.34% in 2021 and was 30.52% higher in Q1 2022.
The CBOT wheat settled at $10.06 per bushel on March 31 and was at over the $10.50 level on April 8. The wheat futures rose to a high of $13.40 in May, eclipsing the 2008 $13.3450 per bushel record peak.
As the seeds go into the ground in the US and other growing regions in the northern hemisphere, prices are at multi-year highs and not far from record levels.
The weather is secondary as the war in Ukraine threatens supplies
The weather typically causes price volatility during the annual planting and growing seasons. However, 2022 is anything but a typical year. Rising inflation has caused input prices to soar, pushing land values, rents, financing costs, energy, labor, equipment, seed, and other expenses higher. Moreover, Russia’s invasion of Ukraine has transformed Europe’s breadbasket into mine and battlefields. Russia and Ukraine export one-third of the world’s annual wheat requirements and substantial amounts of corn, barley, and other agricultural products. The Black Sea ports, a critical logistical hub in the region, is a war zone. Meanwhile, Russia retaliated against sanctions by “temporarily” banning fertilizer exports, sending prices higher, and limiting availabilities. The lack of fertilizers will translate to lower global crop yields.
In April 2022, the weather is secondary to the geopolitical landscape for the commodities that feed the world.
Higher prices in the US- The potential for famine in other regions
In the US, consumers will pay much higher prices for food in the coming months and years. However, as a world-leading agricultural producer, the US food supply is likely to fulfill domestic requirements, barring any catastrophic weather events. Other regions worldwide could face food shortages leading to famine.
In a sign that Russia may cut off agricultural exports, Russian President Vladimir Putin said that the West’s sanctions would make Russia keep a close eye on its food exports to hostile countries. The Russian leader said, “They will inevitably exacerbate food shortages in the poorest regions of the world, spur new waves of migration, and in general drive food prices even higher.”
Even if Russia continues to export to some countries, the production loss caused by the war looks likely to be substantial.
Food shortages lead to political change
When governments cannot feed people, revolutions tend to follow. The French Revolution that cost the last French Queen’s head began as bread riots in Paris. More recently, the 2010 Arab Spring came two years after wheat reached its previous record high. Bread riots in Tunisia and Egypt caused by rising prices and falling availability caused the sweeping political change in North Africa and the Middle East.
Inflation, the war in Ukraine, and sanctions on Russia will have severe ramifications for supplies over the coming years. Feeding people is a government’s primary task, and hungry citizens quickly lose patience with their leaders.
Beans above the teens, corn in the double digits, and wheat explosions could be on the horizon in 2022 and beyond
Soybean futures first traded in the teens in 2008. In 1973, the oilseed futures reached a high of $12.90 per bushel, beginning the chant of “beans in the teens” from those bullish on the oilseed. While it took three and one-half decades for beans to trade in the teens, the next time they move out of the teens could be on the upside at prices above the $20 per bushel level.
Corn has never traded above $8.50 per bushel, but it could head for over $10 in the current environment. CBOT wheat already reached a record high in March 2022, and higher highs could be on the horizon over the coming months and years.
While the weather is secondary for the 2022 crop year, a drought, flood, or other weather events that impact the growing season and weigh on supplies could make matters worse. Anything short of a bumper crop from the US and other growing regions away from Europe’s breadbasket could be disastrous for prices and availabilities.
The bull market that took the grain sector 29.71% higher in 2021 and 18.89% higher in Q1 2022 looks set to continue. The current environment limits the downside while the upside remains explosive. Risk-reward favors the upside in the commodities that feed and increasingly fuel the world.
--
Trading advice given in this communication, if any, is based on information taken from trades and statistical services and other sources that we believe are reliable. The author does not guarantee that such information is accurate or complete and it should not be relied upon as such. Trading advice reflects the author’s good faith judgment at a specific time and is subject to change without notice. There is no guarantee that the advice the author provides will result in profitable trades. There is risk of loss in all futures and options trading. Any investment involves substantial risks, including, but not limited to, pricing volatility , inadequate liquidity, and the potential complete loss of principal. This article does not in any way constitute an offer or solicitation of an offer to buy or sell any investment, security, or commodity discussed herein, or any security in any jurisdiction in which such an offer would be unlawful under the securities laws of such jurisdiction.

Risk/Moneymanagement tippsI added a simply $ value of prior range, point value and allowed contracts to the bottom right of my charts. This allows me to see quickly what each bar is worth.
Entering just 1 contract for a swing trade or 5 contracts with the same risk?
Why not enter on a lower timeframe on a so called intraday setup with the idea in mind to trade a daily swing trade setup?
Lets start with 30 min or 1 hour charts but you can also drill this down to 5 min chart.
At certain points markets will reverse and continue the uptrend on the daily chart.
These areas provide low risk entry points, so set yourself an alert when for example prior days low is crossed, or if we cross the POC (point of control) and so on.
What you can also do is exiting 50% those daytrade positions and keep the rest open for the swing trade.

Continuous Corn SpreadsWhen carry out stocks are plentiful and the market structure is more definable, spreads seem easy to manage.
In the current domestic and world market structure of strong demand and less supply, it seems that trying to add value to hedges with capturing carry may be more of a risk play.
It is wise to manage the risks we know and the risks we can.
Carry Spreads have their limits, Inverse markets have no Rules

Corn Futures (ZC1!), H1 Potential for Bullish rise!Type: Bearish Dip
Resistance : 767'0
Pivot: 750'2
Support : 741'0
Preferred case: With price moving above the ichimoku cloud along with the recent trendline breakout, we have a bullish bias that price will rise to our 1st resistance in line with the 767'0 in line with he swing high resistance from our pivot of 750'2 in line with the 23.6% Fibonacci retracement and the horizontal pullback support.
Alternative scenario: Alternatively, price may break pivot structure and head for 1st support at 741'0 in line with he 61.8% Fibonacci retracement and the swing low support.
Fundamentals: No major news.

Corn - December23 WeeklyUsing the last week of February for high to low retracement targets, 6.42 becomes the Primary target on this next leg higher. Support is the last swing high at 6.03. Volume of support just under 5.50
There are some fairly bullish charts out there, but the big question is how do ag and energy markets react should the equity and financial markets move lower…
A strong volatile move higher in Grains and Energies against the backdrop of a slowing economy would be tough on the deferred grain and oilseed contracts. I do think it is wise to keep an eye on 23’ crops… Don’t hesitate to layer in some small percentage targets…. Targets 5.95, 6.42, and 6.65

Corn - December22 DailyThe fundamentals for new crop corn remain supportive to continuing this bullish market. Technically, to continue bullish enthusiasm, Dec22 Corn needs to hold weekly closes above the 6.31 low posted last week. This market’s upside still remains unmeasurable, but we can try…. Primary target above at 7.11. Should something spark a runaway move higher look at 7.60 then the 8.10 to 8.29 area. Otherwise, look for the 7.11 to 7.30 area to be the next upside targets before a corrective leg lower.

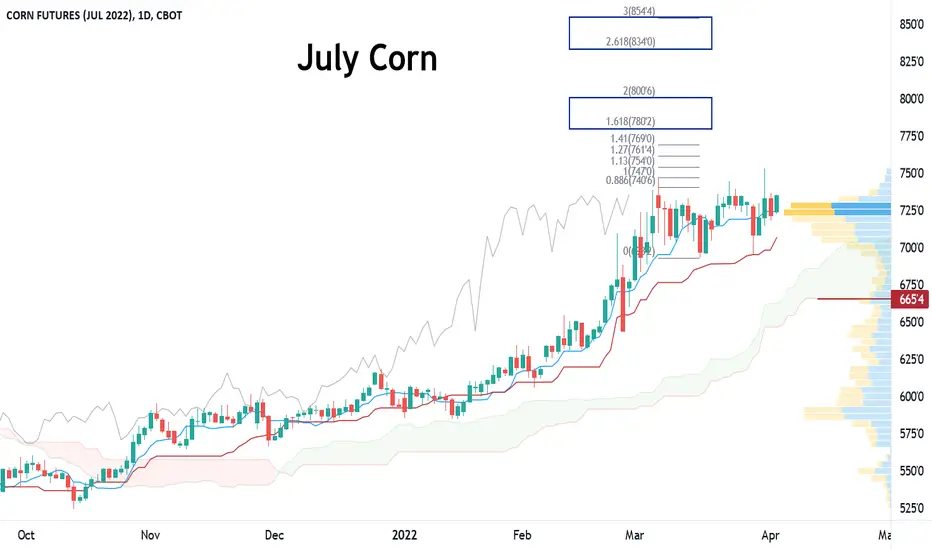
Corn - July22 DailyPrice action mostly in a consolidation or sideways channel between 6.93 and 7.47. Most volume by price in the 7.20-7.30 area. Accumulation ahead of a breakout above, or distribution ahead of a break down below???
Support below at 6.65 with risk identified in the 5.85 to 6.15 area. Using the current high to low retracements, the next primary target above is the 162% retracement at 7.80, that would nearly match the May contrtact’s high at 7.82. Above July corn looks to 8.00, 8.34, and 8.54….
Corn - Weekly ContinuousPrice stalled out in the bull trap area between 7.66 and 8.00 after placing the 7.82 high.
Bull Trap- Mark a new high and clear out any stop orders above previous highs but fail above in the 113%-127% retracement area.
Open interest has been trending lower since last year’s breakout into this bull market. Funds are near record long already but with the amount of money in all markets, it should not surprise to see more fund length enter our commodity space. I feel that the end users control this next move. If they feel the pressure to extend their coverage, I expect the Funds to follow their lead and enter the long side of this market. Any extension to open interest should be positive to Corn prices…. Support 6.97 then 6.45. Resistance 7.66, 7.82, with targets above at 8.32 and 8.82

Corn Futures (ZC1!), H1 Potential for Bearish Dip!Type: Bearish Dip
Resistance : 754'6
Pivot: 747'0
Support : 733'0
Preferred case: We see the potential bearish dip from our Pivot at 747'0 in line 38.2% Fibonacci retracement towards our 1st support at 733'0 in line with the horizontal swing low support. Our bearish bias is further supported by how price is expected to reverse off the ichimoku cloud resistance.
Alternative scenario: Price might move towards the 1st resistance level of 754'6 in line with 61.8% Fibonacci retracement .
Fundamentals: No major news.

Corn: Fish Hook Buy Signalthe March 29 candle created a bearish trap, with a false breakout
the close of the day gave a bullish hammer closed above 650
yesterday was confirmation of the Fish Hook bullish signal
long entry with only 0.30%
the signal is clear, but the figure is late, I would have preferred to see it earlier, and above all it is an isolated small daily pattern not supported by weekly pattern

Corn Commodity USA Sun Storm Investment Trading Desk & NexGen Wealth Management Service Present's: SSITD & NexGen Portfolio of the Week Series
Focus: Worldwide
By Sun Storm Investment Research & NexGen Wealth Management Service
A Profit & Solutions Strategy & Research
Trading | Investment | Stocks | ETF | Mutual Funds | Crypto | Bonds | Options | Dividend | Futures |
USA | Canada | UK | Germany | France | Italy | Rest of Europe | Mexico | India
Disclaimer: Sun Storm Investment and NexGen are not registered financial advisors, so please do your own research before trading & investing anything. This is information is for only research purposes not for actual trading & investing decision.
#debadipb #profitsolutions
