Sustained Downtrend in Corn Futures: Bears Maintain Control
The price is trading below the middle Bollinger Band (20-day SMA), which is sloping downward.
Lower highs and lower lows pattern confirms the bearish market structure.
Price hugging the lower band or staying in the lower half of the band zone — a classic sign of weakness.
Price repeatedly fails to close above the middle band (~20-day SMA), confirming it as dynamic resistance.
XC1! trade ideas

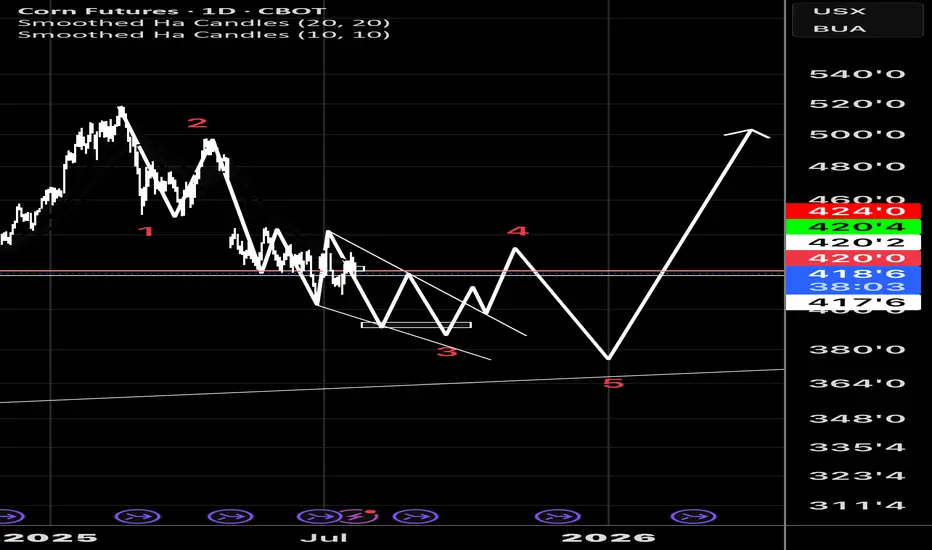
Christmas corn. Can we get under 4.00If the above scenario plays out, looks like we can grind down to 393 in c wave of an ending diagonal to finish a w5 of 3.
Weather and Corn: Understanding the Precipitation Factor1. Introduction: Rain, Grain, and Market Chain Reactions
In the world of agricultural commodities, few forces carry as much weight as weather — and when it comes to corn, precipitation is paramount. Unlike temperature, which can have nuanced and sometimes ambiguous effects depending on the growth stage, rainfall exerts a more direct and consistent influence on crop performance. For traders, understanding the role of rainfall in shaping market sentiment and price behavior isn't just an agricultural curiosity — it's a trading edge.
This article unpacks the relationship between weekly rainfall levels and corn futures prices. By leveraging normalized weather data and historical returns from Corn Futures (ZC), we aim to translate weather signals into actionable market insights. Whether you're managing large agricultural positions or exploring micro futures like MZC, precipitation patterns can provide vital context for your trades.
2. Corn’s Moisture Dependency
Corn is not just sensitive to water — it thrives or suffers because of it. From the moment seeds are planted, the crop enters a delicate dance with precipitation. Too little moisture during the early stages can impair root development. Too much during germination may lead to rot. And during pollination — particularly the tasseling and silking stages — insufficient rainfall can cause the plant to abort kernels, drastically reducing yield.
On the other hand, excessive rainfall isn't necessarily beneficial either. Prolonged wet periods can saturate soil, hinder nutrient uptake, and encourage fungal diseases. Farmers in the U.S. Corn Belt — particularly in states like Iowa, Illinois, and Nebraska — know this well. A single unexpected weather shift in these regions can send ripple effects across global markets, causing speculators to reassess their positions.
For traders, these weather events aren’t just environmental footnotes — they are catalysts that influence prices, volatility, and risk sentiment. And while annual production is important, it's the week-to-week rhythm of the growing season where short-term trades are born.
3. Our Data-Driven Approach: Weekly Rainfall and Corn Returns
To understand how rainfall impacts price, we collected and analyzed decades of historical weather and futures data, aligning weekly precipitation totals from major corn-growing regions with weekly returns from Corn Futures (ZC).
The weather data was normalized using percentiles for each location and week of the year. We then assigned each weekly observation to one of three precipitation categories:
Low rainfall (<25th percentile)
Normal rainfall (25th–75th percentile)
High rainfall (>75th percentile)
We then calculated the weekly percent change in corn futures prices and matched each return to the rainfall category for that week. The result was a dataset that let us measure not just general trends but statistically significant shifts in market behavior based on weather. One key finding stood out: the difference in returns between low-rainfall and high-rainfall weeks was highly significant, with a p-value of approximately 0.0006.
4. What the Numbers Tell Us
The results are striking. During low-rainfall weeks, corn futures often posted higher average returns, suggesting that the market responds to early signs of drought with anticipatory price rallies. Traders and institutions appear to adjust positions quickly when weather models hint at below-normal moisture during key growth stages.
In contrast, high-rainfall weeks displayed lower returns on average — and greater variability. While rain is essential, excess moisture raises fears of waterlogging, planting delays, and quality issues at harvest. The futures market, ever forward-looking, seems to price in both optimism and concern depending on the volume of rain.
Boxplots of these weekly returns reinforce the pattern: drier-than-usual weeks tend to tilt bullish, while wetter periods introduce uncertainty. For discretionary and algorithmic traders alike, this insight opens the door to strategies that incorporate weather forecasts into entry, exit, and risk models.
📊 Boxplot Chart: Weekly corn futures returns plotted against precipitation category (low, normal, high). This visual helps traders grasp how price behavior shifts under varying rainfall conditions.
5. Strategy: How Traders Can Position Themselves
With the clear statistical link between rainfall extremes and price behavior in corn futures, the logical next step is applying this insight to real-world trading. One straightforward approach is to incorporate weather forecast models into your weekly market prep. If a key growing region is expected to receive below-normal rainfall, that could serve as a signal for a potential bullish bias in the upcoming trading sessions.
This doesn’t mean blindly buying futures on dry weeks, but rather layering this data into a broader trading thesis. For example, traders could combine weather signals with volume surges, technical breakouts, or news sentiment to form confluence-based setups. On the risk management side, understanding how price behaves during extreme weather periods can inform smarter stop-loss placements, position sizing, or even the use of option strategies to protect against unexpected reversals.
Additionally, this information becomes particularly valuable during the planting and pollination seasons, when the corn crop is most vulnerable and the market reacts most strongly. Knowing the historical patterns of price behavior in those weeks — and aligning them with current forecast data — offers a clear edge that fundamental and technical analysis alone may not reveal.
🗺️ Global Corn Map Screenshot: A world map highlighting major corn-growing regions with weather overlay. This helps illustrate the geographic variability in rainfall and how it intersects with key production zones.
6. Corn Futures Contracts: Speculating with Flexibility
For traders looking to act on this kind of seasonal weather intelligence, CME Group provides two practical tools: the standard-size Corn Futures contract (ZC) and the Micro Corn Futures contract (MZC).
Here are some quick key points to remember:
Tick size for ZC is ¼ cent (0.0025) per bushel, equating to $12.50 per tick.
For MZC, each tick is 0.0050 equating to $2.50 per tick.
Standard ZC initial margin is approximately $1,000 and MZC margins are around $100 per contract, though this can vary by broker.
Micro contracts are ideal for those who want exposure to corn prices without the capital intensity of full-size contracts. They’re especially helpful for weather-based trades, where your thesis may rely on shorter holding periods, rapid scaling, or position hedging.
7. Conclusion: Rain’s Role in the Corn Trade
Precipitation isn’t just a farmer’s concern — it’s a trader’s opportunity. Our analysis shows that weather data, especially rainfall, has a statistically significant relationship with corn futures prices. By normalizing historical precipitation data and matching it to weekly returns, we uncovered a clear pattern: drought stress tends to lift prices, while excessive moisture creates volatility and downside risk.
For futures traders, understanding this dynamic adds another layer to market analysis.
As part of a broader series, this article is just one piece of a puzzle that spans multiple commodities and weather variables. Stay tuned for our upcoming releases, where we’ll continue exploring how nature’s forces shape the futures markets.
When charting futures, the data provided could be delayed. Traders working with the ticker symbols discussed in this idea may prefer to use CME Group real-time data plan on TradingView: www.tradingview.com - This consideration is particularly important for shorter-term traders, whereas it may be less critical for those focused on longer-term trading strategies.
General Disclaimer:
The trade ideas presented herein are solely for illustrative purposes forming a part of a case study intended to demonstrate key principles in risk management within the context of the specific market scenarios discussed. These ideas are not to be interpreted as investment recommendations or financial advice. They do not endorse or promote any specific trading strategies, financial products, or services. The information provided is based on data believed to be reliable; however, its accuracy or completeness cannot be guaranteed. Trading in financial markets involves risks, including the potential loss of principal. Each individual should conduct their own research and consult with professional financial advisors before making any investment decisions. The author or publisher of this content bears no responsibility for any actions taken based on the information provided or for any resultant financial or other losses.
Potential Bull Pin Weekly Close on Corn FuturesMight be a bullish close below the yearly open on corn futures.
Tariffs can negatively impact prices but maybe some seasonality will drive some higher prices to make a fresh yearly high at some point this summer.
There have only been seven years since 1981 that have not seen a summer corn price rally, while several years have seen multiple. Last year was one of the years that did not see a rally, with 2014 being the second most recent. Only once has there even been two consecutive years without a summer rally — 1985 and 1986. Considering the farm program in those years provided an utterly different dynamic, the chances of that happening again seem low.
There have been 52 summer rallies over the last 44 years; 14 of those rallies began in the first three weeks of May though June is historically the most common time for a rally to begin.

ZCU25 CORN... It ALWAYS comes down to cornAND I'M BACK AND DUMBER THAN EVER
Listen up Honkies, this trade has a 93% probability based on the historical data over the last 30 years. So I bet Muhammad my 3rd ex-wife and a half of my second step child. The reason this trade works is easy! We all have felt and understand FUD (Fear, Uncertainty, and Doubt) and how the market reacts, I understood this on my second ex-wife when she got a boyfriend. So in late June pollination season occurs with corn and the yield is unknown for the next year, this is a very simple way of looking at the agricultural industry and how the market corrects. The trade is set up in two stages in order to maximize profit. The first stage, with the FUD in pollination season typically results in a 15-20% drop, I split the difference at 17% lets make it easier than my first divorce. This usually occurs around June 26th and can extend to July 17th. Around July 15th to the 20th the projected yield is shared and the market recorrects to the upside as the numbers represented due to the FUD don't represent the price action in the futures market, and because the futures market is speculatory (Adult Gambling) the degens will pump the contracts up looking for a quick buck like my third wife. Now in order to not go broke while you're trying to buy your ex wife's boyfriend's son a new car, you need to hedge the contract in a calendar spread aka intra-commodity spread, so do the opposite in combination on the march 2026 corn contract as the maintance is lower and the price action isn't there due to open interest in the market, so let that contract ride if it goes against you. SO! you short the ZCU25 while longing the ZCH26, then offset the contracts when direction changes and long ZCU25 and short ZCH26, it's as easy as 1,2,8. Had to repost this forgot the Tags my bad.
"all I need is one trade to pay all the alimony for this year."
-KewlKat

ZCU25 ITS CORN! AGAINAND I'M BACK AND DUMBER THAN EVER
Listen up Honkies, this trade has a 93% probability based on the historical data over the last 30 years. So I bet Muhammad my 3rd ex-wife and a half of my second step child. The reason this trade works is easy! We all have felt and understand FUD (Fear, Uncertainty, and Doubt) and how the market reacts, I understood this on my second ex-wife when she got a boyfriend. So in late June pollination season occurs with corn and the yield is unknown for the next year, this is a very simple way of looking at the agricultural industry and how the market corrects. The trade is set up in two stages in order to maximize profit. The first stage, with the FUD in pollination season typically results in a 15-20% drop, I split the difference at 17% lets make it easier than my first divorce. This usually occurs around June 26th and can extend to July 17th. Around July 15th to the 20th the projected yield is shared and the market recorrects to the upside as the numbers represented due to the FUD don't represent the price action in the futures market, and because the futures market is speculatory (Adult Gambling) the degens will pump the contracts up looking for a quick buck like my third wife. Now in order to not go broke while you're trying to buy your ex wife's boyfriend's son a new car, you need to hedge the contract in a calendar spread aka intra-commodity spread, so do the opposite in combination on the march 2026 corn contract as the maintance is lower and the price action isn't there due to open interest in the market, so let that contract ride if it goes against you. SO! you short the ZCU25 while longing the ZCH26, then offset the contracts when direction changes and long ZCU25 and short ZCH26, it's as easy as 1,2,8. Anyway now I gotta go do BTC for all the younger degens and my first ex-wife's boyfriend.
"all I need is one trade to pay all the alimony for this year."
-KewlKat

Daily ZC analysisDaily ZC analysis
Sell trade with target and stop loss as shown in the chart
The trend is down and we may see more drop in the coming period in the medium term
All the best, I hope for your participation in the analysis, and for any inquiries, please send in the comments.
He gave a signal from the strongest areas of entry, special recommendations, with a success rate of 95%, for any inquiry or request for analysis, contact me

Corn - 450-460Corn may continue the trend higher, reaching at least 450 but a more likely projection 460.

CORN.c CORN.c Short Trade Plan (Daily Timeframe)
📍 Trade Setup
Direction: Short
Entry: Instant / Current Market Price (CMP)
Stop Loss (SL): 465.97
Take Profit 1 (TP1): 403.36 (≈ 1:1 Risk-Reward)
Take Profit 2 (TP2): 387.00 (≈ 1:1.5 Risk-Reward)
📊 Technical Justification
Trend: Downtrend confirmed – price forming Lower Highs and Lower Lows.
Candle Pattern: Bearish shooting star near resistance – strong rejection signal.
🌽 Top 3 Bearish Fundamental Reasons
Favorable U.S. Weather Conditions
→ Ideal for crop growth → higher yield expectations → bearish pressure.
Weak Global Export Demand
→ Sluggish corn exports (e.g., China slowdown) → less global demand for U.S. corn.
Strong U.S. Dollar
→ Makes U.S. corn more expensive internationally → lowers export competitiveness.
🎯 Risk Management & Execution Plan
Risk-Reward (TP1): ~1:1
Risk-Reward (TP2): ~1:1.5
📌 Once TP1 is hit:
✅ Move SL to Entry (Breakeven) to protect capital and ride remaining position to TP2.

Corn at the Cliff Edge: Bearish Breakdown or Smart Money Trap?📉 1. Price Action & Technical Context (Weekly Chart – ZC1!)
Price is currently sitting around 439'0, after rejecting the 462'2 supply zone (gray block) and confirming rejection from the macro supply area between 472'6–480'0 (red block).
The last four weekly candles show a failed recovery attempt (three green candles trapped between two strong red ones), culminating in a bearish breakout below the intermediate demand zone (445'0–442'0).
Now, price is back inside the key demand zone between 439'0–433'4, an area with heavy volume and previous significant lows.
🔍 Technical takeaway: Bearish breakout confirmed. Price is testing the last major weekly support before opening the door toward the yearly lows (~420'0).
📊 2. Commitment of Traders (COT Report – May 27, 2025)
Non-Commercials (Speculators):
Long: 324,377 (▼ -17,952)
Short: 344,710 (▼ -9,171)
Net Position: -20,333 → Bearish, but the unwinding of both sides suggests profit-taking.
Commercials (Institutions):
Long: 766,211 (▲ +12,588)
Short: 713,647 (▼ -962)
Net Position: +52,564 → Increasing → Institutional accumulation.
🔎 Key observation: Commercials are increasing their net longs, while speculators are reducing exposure. This diverges from price action and may signal institutional accumulation under 440.
📉 3. Net Positioning vs Price (COT Chart)
The chart shows a clear decline in speculative longs since March, with a new low this week.
Meanwhile, commercials are gradually increasing their long exposure, positioning themselves against the current bearish trend.
💡 Combined view: While price keeps dropping, the "smart money" is accumulating → possible bottom forming, though not yet confirmed technically.
🌾 4. Seasonality
June Performance:
20-Year Avg: -4.25%
15-Year Avg: +12.31%
5-Year Avg: +1.15%
2-Year Avg: +28.61%
📈 Seasonal Conclusion: The seasonal bias has turned strongly bullish in the last 2–5 years. June–July is often a rally period for Corn following the late-May bottoms — likely tied to U.S. planting season dynamics.

Weather and Corn: A Deep Dive into Temperature Impact1. Introduction: Corn and Climate – An Inseparable Relationship
For traders navigating the corn futures market, weather isn't just a background noise—it's a market mover. Few agricultural commodities are as sensitive to environmental variables as corn, especially temperature. Corn is grown across vast regions, and its development is directly tied to how hot or cold the season plays out. This makes weather not just a topic of interest but a core input in any corn trader’s playbook.
In this article, we go beyond conventional wisdom. Instead of simply assuming “hotter equals bullish,” we bring data into the equation—weather data normalized by percentile, matched with price returns on CME Group's corn futures. The results? Useful for anyone trading ZC or MZC contracts.
2. How Temperature Affects Corn Physiology and Yields
At the biological level, corn thrives best in temperatures between 77°F (25°C) and 91°F (33°C) during its growth stages. During pollination—a critical yield-defining window—extreme heat (especially above 95°F / 35°C) can cause irreversible damage. When hot weather coincides with drought, the impact on yields can be catastrophic.
Historical drought years like 2012 and 1988 serve as powerful examples. In 2012, persistent heat and dryness across the US Midwest led to a national yield drop of over 25%, sending futures skyrocketing. But heat doesn't always spell disaster. Timing matters. A heat wave in early June may have little impact. That same wave during tasseling in July? Major consequences.
3. The Market Mechanism: How Traders Respond to Temperature Surprises
Markets are forward-looking. Futures prices don’t just reflect today’s weather—they reflect expectations. A dry June may already be priced in by the time USDA issues its report. This dynamic creates an interesting challenge for traders: separating noise from signal.
During July and August—the critical reproductive phase—temperature updates from NOAA and private forecasters often trigger major moves. Rumors of an incoming heat dome? Corn futures might gap up overnight. But if it fizzles out, retracements can be just as dramatic. Traders who rely on headlines without considering what’s already priced in are often late to the move.
4. Our Analysis: What the Data Reveals About Corn and Temperature
To cut through the fog, we performed a percentile-based analysis using decades of weather and price data. Rather than looking at raw temperatures, we classified each week into temperature “categories”:
Low Temperature Weeks: Bottom 25% of the historical distribution
Normal Temperature Weeks: Middle 50%
High Temperature Weeks: Top 25%
We then analyzed weekly percentage returns for the corn futures contract (ZC) in each category. The outcome? On average, high-temperature weeks showed higher volatility—but not always higher returns. In fact, the data revealed that some extreme heat periods were already fully priced in, limiting upside.
5. Statistically Significant or Not? T-Tests and Interpretation
To test whether the temperature categories had statistically significant impacts on weekly returns, we ran a t-test comparing the “Low” vs. “High” temperature groups. The result: highly significant. Corn returns during high-temperature weeks were, on average, notably different than those during cooler weeks, with a p-value far below 0.01 (4.10854357245787E-13).
This tells us that traders can't ignore temperature anomalies. Extreme heat does more than influence the narrative—it materially shifts price behavior. That said, the direction of this shift isn't always bullish. Sometimes, high heat correlates with selling, especially if it’s viewed as destructive beyond repair.
6. Strategic Takeaways for Corn Traders
Traders can use this information in several ways:
Anticipatory Positioning: Use temperature forecasts to adjust exposure ahead of key USDA reports.
Risk Management: Understand that volatility spikes in extreme temperature conditions and plan stops accordingly.
Calendar Sensitivity: Prioritize weather signals more heavily in July than in May, when crops are less vulnerable.
Combining weather percentile models with weekly return expectations can elevate a trader’s edge beyond gut feel.
7. CME Group Corn Futures and Micro Corn Contracts
Corn traders have options when it comes to accessing this market. The flagship ZC futures contract from CME Group represents 5,000 bushels of corn and is widely used by commercial hedgers and speculators alike. For those seeking more precision or lower capital requirements, the recently launched Micro Corn Futures (MZC) represent just 1/10th the size.
This fractional sizing makes temperature-driven strategies more accessible to retail traders, allowing them to deploy seasonal or event-based trades without excessive risk exposure.
Here are some quick key points to remember:
Tick size for ZC is ¼ cent (0.0025) per bushel, equating to $12.50 per tick.
For MZC, each tick is 0.0050 equating to $2.50 per tick.
Standard ZC initial margin is approximately $1,000 and MZC margins are around $100 per contract, though this can vary by broker.
8. Wrapping Up: Temperature's Role in a Complex Equation
While temperature is a key driver in corn futures, it doesn't act in isolation. Precipitation, global demand, currency fluctuations, and government policies also play crucial roles. However, by quantifying the impact of extreme temperatures, traders gain a potential edge in anticipating market behavior.
Future articles will expand this framework to include precipitation, international weather events, and multi-variable models.
This article is part of a broader series exploring how weather impacts the corn, wheat, and soybean futures markets. Stay tuned for the next release, which builds directly on these insights.
When charting futures, the data provided could be delayed. Traders working with the ticker symbols discussed in this idea may prefer to use CME Group real-time data plan on TradingView: www.tradingview.com - This consideration is particularly important for shorter-term traders, whereas it may be less critical for those focused on longer-term trading strategies.
General Disclaimer:
The trade ideas presented herein are solely for illustrative purposes forming a part of a case study intended to demonstrate key principles in risk management within the context of the specific market scenarios discussed. These ideas are not to be interpreted as investment recommendations or financial advice. They do not endorse or promote any specific trading strategies, financial products, or services. The information provided is based on data believed to be reliable; however, its accuracy or completeness cannot be guaranteed. Trading in financial markets involves risks, including the potential loss of principal. Each individual should conduct their own research and consult with professional financial advisors before making any investment decisions. The author or publisher of this content bears no responsibility for any actions taken based on the information provided or for any resultant financial or other losses.

Corn at a Historical Turning Point? Corn futures are currently at a technically significant juncture. After an extended bearish phase from the yearly highs, price has reached a key monthly demand zone between 445 and 435 cents, an area that has historically triggered major reversals. This level is further validated by technical signals indicating potential exhaustion of the bearish momentum: the price action is showing rejection candles, and the RSI is recovering from oversold territory, creating room for a possible upside move.
However, it’s important to consider the seasonal context, which doesn’t favor an immediate reversal. Historical data shows that May, June, and July are statistically the weakest months for Corn. In particular, July tends to be highly bearish, with an average performance of -22% over the last 20 years and -36% over the last 10. This means that while the technical setup may suggest a potential bounce, seasonal pressure may continue to cap prices in the short term, making a sustained rally unlikely before August.
The COT positioning adds another layer of insight. Non-commercial traders (speculators) have recently closed a significant number of long positions and added shorts, reflecting strong bearish sentiment. In contrast, commercials (hedgers) have increased long exposure and decreased shorts, signaling optimism and a willingness to accumulate at these levels. This divergence often marks contrarian opportunities, especially when speculators are heavily short and commercials are heavily long—often a sign of a market bottom forming.
🧠 Summary:
Corn is sitting on major structural support, with early signs of a potential rebound. Yet, the seasonality remains bearish through mid-summer. The COT report, however, supports a bullish medium-term outlook, particularly heading into August–September, when prices historically begin to climb decisively.
🔔 Trading Outlook:
In the short term, tactical longs can be considered if the 445–435 area holds, with tight risk management. Initial targets are set at 465 and 472. The true strategic setup, however, is more likely to emerge in the coming months, with August as the key window for a sustained upside move supported by both seasonal and COT positioning.

Corn Prices Face Headwinds from Supply Optimism & Trade TensionsCorn futures rallied in early April after President Trump’s new tariffs, driven by front-loaded U.S. exports, a weaker dollar, and a tighter domestic supply.
But by mid-April, prices fell as favourable planting conditions in the U.S., easing supply fears in South America, and escalating trade tensions between the U.S. and China.
As of May 4, 40% of the U.S. corn crop was planted , far above the levels from last year (35%) and above the five-year average of 39%. The sharp jump in plantings between 27/April and 4/May has introduced a bearish backdrop with abundant supply.
Higher crop estimates from Brazil and Argentina added pressure, while slowing export sales signalled that much demand had already been met.
TECHNICAL ANALYSIS
Corn futures flashed a bearish death cross on May 1, as the 9-day moving average (MA) crossed below the 21-day MA. Since then, prices have continued their decline at a rapid pace.
The MACD is turning more negative, and the RSI is nearing oversold territory while staying below its 14-day average, signalling mounting bearish pressure and the potential for further near-term downside.
COMMITMENT OF TRADERS AND OPTIONS DATA
For the week ending April 29, Managed Money sharply increased short positions by 17.1% and trimmed long positions by 5.5%, resulting in a 36.8% drop in net longs. The shift signals growing bearish sentiment and reduced confidence in the near-term price outlook.
Despite the April 2 tariffs, implied volatility stayed muted until mid-April, then rose as prices fell. Skew briefly turned negative on April 8. It has since rebounded to its highest-level YTD, even as prices hit new lows, suggesting that traders remain cautious of further price decline.
Source: CME CVOL
Past week open interest trends are intriguing. While call OI on the OZCM5 contract (23/May expiry) increased, call OI contracted on the OZCN5 contract (20/June expiry) suggesting near-term hedging on price rebound risks with continued build-up of longer-term bearish positions.
Source: CME CVOL
HYPOTHETICAL TRADE SETUP
Given the bleak fundamentals and bearish technical signals, corn prices may see further downside. While a brief, modest technical rebound is possible, it is likely to be short-lived as the underlying fundamentals remain weak, with few catalysts for a meaningful reversal.
To express views on these trends, portfolio managers can use CME Micro Corn Futures to short the near-term July contract (MZCN2025), which expires on June 20. A hypothetical trade setup offering a reward-to-risk ratio of 1.8x is outlined below:
MARKET DATA
CME Real-time Market Data helps identify trading set-ups and express market views better. If you have futures in your trading portfolio, you can check out on CME Group data plans available that suit your trading needs tradingview.com/cme.
DISCLAIMER
This case study is for educational purposes only and does not constitute investment recommendations or advice. Nor are they used to promote any specific products, or services.
Trading or investment ideas cited here are for illustration only, as an integral part of a case study to demonstrate the fundamental concepts in risk management or trading under the market scenarios being discussed. Please read the FULL DISCLAIMER the link to which is provided in our profile description.

The Golden Grain: Trading Corn in Global Markets🟡 1. Introduction
Corn isn’t just something you eat off the cob at a summer barbecue — it’s one of the most widely traded agricultural commodities in the world. Behind every kernel lies a powerful story of food security, global trade, biofuels, and speculative capital.
Whether you’re a farmer managing risk, a trader chasing macro trends, or simply curious about how weather affects global prices, corn futures sit at the crossroads of agriculture and finance. In this article, we’ll explore what makes corn a global economic driver, how it behaves as a futures product, and what traders need to know to approach the corn market intelligently.
🌎 2. Where Corn Grows: Global Powerhouses
Corn is cultivated on every continent except Antarctica, but a handful of countries dominate production and exports.
United States – By far the largest producer and exporter. The “Corn Belt” — spanning Iowa, Illinois, Indiana, Nebraska, and parts of Ohio and Missouri — produces the majority of U.S. corn. U.S. exports also set global benchmarks for pricing.
Brazil & Argentina – These two South American powerhouses are crucial to the global corn supply, especially during the Northern Hemisphere’s off-season.
China – Though a top producer, China consumes most of its own supply and has become a key importer during deficit years.
Corn is typically planted in the U.S. between late April and early June and harvested from September through November. In Brazil, two crops per year are common — including the important safrinha (second crop), harvested mid-year.
Understanding where and when corn is grown is vital. Weather disruptions in any of these regions can ripple through the futures market within hours — or even minutes.
💹 3. Corn as a Futures Market Power Player
Corn is one of the most liquid agricultural futures markets in the world, traded primarily on the CME Group’s CBOT (Chicago Board of Trade). It attracts a diverse set of participants:
Producers and Commercials: Farmers, ethanol refiners, and food manufacturers use corn futures to hedge price risk.
Speculators and Funds: Hedge funds and retail traders speculate on corn price direction, volatility, and seasonal patterns.
Arbitrageurs and Spreads: Traders bet on relative price differences between contracts (e.g., old crop vs. new crop spreads).
The deep liquidity and relatively low tick size make corn accessible, but its price is highly sensitive to weather, government reports (like WASDE), and international trade policies.
🏗️ 4. CME Group Corn Futures: What You Can Trade
The CME Group offers both standard and micro-sized contracts for corn. Here’s a quick overview:
o Standard Corn
Ticker: ZC
Size = 5,000 bushels
Tick = 0.0025 = $12.50
Margin = ~$1,050
o Micro Corn
Ticker: XC
Size = 1,000 bushels
Tick = 0.0050 = $2.50
Margin = ~$105
⚠️ Always confirm margin requirements with your broker. They change with market volatility and exchange updates.
The availability of micro corn contracts has opened the door for smaller traders to manage risk or test strategies without over-leveraging.
📊 5. Historical Price Behavior & Seasonality
Corn is deeply seasonal — and so is its price action.
During planting season (April–May), traders watch weekly USDA crop progress reports and early weather forecasts like hawks. A wet spring can delay planting, leading to tighter supply expectations and early price spikes.
Then comes pollination (July) — the most critical stage. This is when heatwaves or drought can do serious damage to yield potential. If temperatures are unusually high or rainfall is scarce during this window, markets often react with urgency, bidding up futures prices in anticipation of reduced output.
By harvest (September–November), prices often stabilize — especially if production matches expectations. But early frost, wind storms, or excessive rain during harvest can still trigger sharp volatility.
Many experienced traders overlay weather models, soil moisture maps, and historical USDA data to anticipate season-driven price shifts.
Even international factors play a role. For example, when Brazil’s safrinha crop suffers a drought, global corn supply tightens — impacting CME prices even though the crop is thousands of miles away.
🧠 6. What Every New Trader Should Know
If you’re new to corn trading, here are some key principles:
Watch the Weather: It’s not optional. Daily forecasts, drought monitors, and precipitation anomalies can move markets. NOAA, Open-Meteo, and private ag weather services are your friends.
Know the Reports: The WASDE report (World Agricultural Supply and Demand Estimates), USDA Crop Progress, and Prospective Plantings reports can shake up pricing more than you might expect — even if changes seem small.
Mind the Time of Year: Seasonality affects liquidity, volatility, and trader behavior. March–August tends to be the most active period.
Understand Global Demand: The U.S. exports a huge portion of its crop — with China, Mexico, and Japan as major buyers. A tariff tweak or surprise Chinese cancellation can cause wild price swings.
🛠️ Good corn trading is 50% strategy, 50% meteorology.
🧭 This article is part of a broader educational series exploring the relationship between agricultural commodities and weather patterns. In the upcoming pieces, we’ll dive deeper into how temperature and precipitation affect corn, wheat, and soybeans — with real data, charts, and trading insights.
📅 Watch for the next release: “Breadbasket Basics: Trading Wheat Futures.”
When charting futures, the data provided could be delayed. Traders working with the ticker symbols discussed in this idea may prefer to use CME Group real-time data plan on TradingView: www.tradingview.com - This consideration is particularly important for shorter-term traders, whereas it may be less critical for those focused on longer-term trading strategies.
General Disclaimer:
The trade ideas presented herein are solely for illustrative purposes forming a part of a case study intended to demonstrate key principles in risk management within the context of the specific market scenarios discussed. These ideas are not to be interpreted as investment recommendations or financial advice. They do not endorse or promote any specific trading strategies, financial products, or services. The information provided is based on data believed to be reliable; however, its accuracy or completeness cannot be guaranteed. Trading in financial markets involves risks, including the potential loss of principal. Each individual should conduct their own research and consult with professional financial advisors before making any investment decisions. The author or publisher of this content bears no responsibility for any actions taken based on the information provided or for any resultant financial or other losses.

Corn Futures This is my first time looking at Corn Futures. I am already loving what I see. This market trends well. Lots of opportunities to get in this market. We can see that we are in a bearish market. Respecting the 1 hour trend line that I place at the market high. It has been following it for some time now. Looking to see if we continue to push down some more this week.

Daily Chart Uptrend in Corn: Key Levels at 4,820 Support & 5,000
This market analysis suggests that the price of corn futures is currently in an uptrend, particularly if it stays above the 20-day moving average and the March low. Breaking above the 5,000 price level would signal a potential move towards higher targets, indicating continued strength. However, falling below the key support level of the 20-day moving average would suggest the trend is weakening and could lead to a decline towards lower price zones

CORN ShortCorn Futures short on the regression break.
The roll on this pair is (+1.6%)
I am not sure about this pair and if the risk reward is there.

Corn Export Boom: Trading Opportunities in a Competitive MarketThe US corn market is experiencing a notable export boom in April. The WASDE report shows to us a 100 million bushel increase in US corn exports, driven by competitive pricing, though this comes at the expense of ending stocks, which are down 75 million bushels to 1.5 billion. With the season-average price steady at $4.35 per bushel, traders have a unique opportunity to capitalize on this export-driven momentum in corn futures.
US Corn Market: Exports Surge, Stocks Tighten
The WASDE report paints a dynamic picture for the US corn market in the 2024/25 season. Exports are raised by 100 million bushels to 2.098 billion, reflecting a strong pace of sales and shipments, underpinned by relatively competitive US prices in the global market. This export surge is particularly notable given the broader context of the US-China trade war, which has imposed tariffs on US agricultural goods, yet demand from other regions—like the EU, Mexico, Turkey, and Peru, where corn imports are up—has bolstered US shipments. However, this export boom has tightened domestic supplies, with ending stocks lowered by 75 million bushels to 1.5 billion, as feed and residual use is cut by 25 million bushels to 5.8 billion.
Despite these supply adjustments, the season-average corn price remains unchanged at $4.35 per bushel, signaling market stability even as stocks tighten. This price resilience suggests that demand is absorbing the export-driven supply reduction without immediate upward pressure on prices, creating a balanced yet potentially bullish setup for traders in the near term.
Global Context: A Tightening Supply Landscape
Globally, the corn market is also under pressure, adding a layer of complexity for traders. The WASDE report forecasts global corn ending stocks at 287.7 million tons, down 1.3 million tons from the prior estimate, reflecting a tighter supply picture. Foreign corn production is slightly up, with increases in the EU (up 0.5 million tons, driven by larger crops in Poland, Croatia, France, and Germany), Tanzania (up 0.2 million tons), and Honduras (up 0.1 million tons), but these gains are offset by declines in Moldova (down 0.2 million tons), Cambodia (down 0.1 million tons), and Kenya (down 0.1 million tons). Global trade sees higher US exports, but a reduction in Pakistan’s exports (down 0.1 million tons) partially offsets this, while foreign corn ending stocks rise in South Korea and Pakistan, further tightening the global supply-demand balance.
This global stock decline to 287.7 million tons, combined with the US export boom, introduces a bullish undercurrent for corn prices, particularly if export demand continues to outpace supply growth or if weather disruptions affect key producing regions like the EU or South America.
Trading Signals and Strategies
The corn market’s export-driven momentum, with US exports surging by 100 million bushels and ending stocks tightening to 1.5 billion bushels, still suggests potential upside in the longer term, especially as global stocks decline to 287.7 million tons. However, recent price action indicates a shift in short-term sentiment for Chicago Board of Trade Corn Futures CBOT:ZC1! . As of April 23, ZC futures are trading at $4.722 per bushel having recently peaked at $4.874 and showing a significant decline from that level. The WASDE’s season-average price of $4.35 per bushel remains a key support level, but technical indicators like the MACD, which shows a recent bearish crossover with the MACD line at -1.2 and the signal line at -1.0, signal downward momentum in the near term.
Given this updated price action, a bearish strategy emerges as the primary short-term opportunity. As we may see, the chart shows ZC futures have broken below the recent support of $4.80, a level where prices briefly consolidated, and are now testing $4.722. A continued decline toward the next support at $4.65 as a prior consolidation zone—could offer a 1-2% downside in the short term.
For those eyeing a reversal play, the global stock decline to 287.7 million tons and the US export boom still provide a bullish backdrop. If ZC futures hold above $4.65 and reclaim $4.80 with strong volume and a MACD crossover above the signal line, prices could target a return to $4.874, a 3-4% gain. This setup would require a shift in momentum, potentially driven by renewed export demand or supply disruptions in key producing regions.
Risks to Watch
Trading corn futures carries risks, particularly given the export-driven nature of the current rally. The US-China trade war, with tariffs impacting agricultural exports, could dampen demand if economic growth slows in key importing regions like Mexico or the EU, where imports are up but remain sensitive to global conditions. The WASDE’s historical data indicates a 6.7% root mean square error for US corn export forecasts, with differences ranging up to 7.2 million bushels, suggesting potential volatility in future reports. Additionally, the global stock decline to 287.7 million tons could reverse if production in the EU or South America exceeds expectations, easing supply concerns and pressuring prices downward.

Front-loaded Exports has fuelled rally in Corn. Can it last?After President Trump instituted broad new tariffs on 2nd April 2025, corn futures initially wavered but then rallied sharply. While this may seem counterintuitive given tariffs' disruptive impact on trade, near-term support for corn comes from front-loaded U.S. exports, a weaker dollar, and lower-than-expected domestic supply.
However, prices are likely to face downward pressure as the U.S. harvest season approaches. This paper examines the short-term bullish factors, outlines the potential risks ahead, and presents a hypothetical trade setup involving a calendar spread on CME Micro Corn futures.
CME Corn futures gapped lower on 3rd April but quickly recovered, jumping 4.5% over the next three trading days to six-week highs by 9th April. This move aligns with the typical spring seasonal trend, as corn often firms in late spring during planting & strong demand season.
Surging Export Commitments Amid Tariffs
Export commitments have surged post-tariff announcement. USDA reports that U.S. exporters had already booked about 85% of the 2024/25 season target by early April, according to Reuters , well above the 5‐year average.
In the week ending 3rd April, net U.S. corn sales hit ~40.2 million bushels, reflecting heavy front-loading. Large private sales continue: for example, in early April exporters announced a 9.4-million-bushel sale of 2024/25 corn to Spain.
These front-loaded sales (especially to Mexico & Europe) suggest buyers are rushing to secure supply before possible trade disruptions. Overall, extraordinarily strong export pace and large “flash” sales are underpinning the market.
Supply is Weaker than Initially Thought
USDA’s April WASDE cut U.S. 2024/25 ending stocks to just 1.465 billion bushels – a 75 million bushels reduction – implying a stocks/use ratio around 9.6%. For context, that ratio is near multi-decade lows for corn. The USDA simultaneously raised exports to 2.55 billion bushels, a full 100 million bushels above the previous estimate.
On the supply side, USDA’s Prospective Plantings (March 2025) projected 95.3 million corn acres for 2025, roughly 5% higher than 2024, above expectations (highlighted by Mint Finance in a previous paper ). This suggests that while near-term stocks remain stressed the situation is likely to improve drastically following the harvest.
Weaker Dollar Supports Increased Corn Exports
A key bullish factor for U.S. corn exports is the recent weakness of the U.S. dollar. After the tariff announcement, the trade-weighted dollar tumbled – hitting fresh lows (e.g. a 10-year low versus the Swiss franc). Through April 10, the dollar was down ~2–3% on the week. A weaker dollar makes U.S. corn cheaper for overseas buyers, supporting export competitiveness. With dollar at multi-year lows, U.S. corn is more attractive globally, partly offsetting any Chinese retaliatory tariffs.
COT and Options Data
Managed-money funds have dramatically pared back their long corn bets since the beginning of March. CFTC COT data show net long positions peaking around 364,000 contracts in early February, then plunging to ~54,000 by the 8th April report. However, the pace of decline has slowed dramatically over the past few weeks and seems to be signalling an end of the cutback by asset managers.
Interestingly, despite the tariff introduction (2/April) and the WASDE release (10/April), implied volatility (IV) moderated. IV has since normalized from the spike observed in March. During this period, skew also declined, reaching a negative value on 8th April - indicating that put options briefly became more expensive than calls.
Although this trend has since reversed, skew remains near its lowest levels in 2025, suggesting sustained interest in put options among market participants.
Source: CME CVOL
OI shift over the past week also signals a cautious tone despite the rally. Near term options have seen an increase in put OI, suggesting participants remain cautious despite the rally.
Source: CME QuikStrike
Hypothetical Trade Setup
While bullish factors have driven a sharp rally in corn prices over the past two weeks, there are dark clouds on the horizon. Tariffs risk disrupting trade and as most importers have already loaded up on US corn, they could slow the pace of future purchases.
Additionally, a downbeat seasonal trend along with an expected bumper harvest signal that prices could reverse sharply from here. On the technical front, momentum remains solidly bullish but approaching a potential overbought level amid a slowing bullish trend.
Corn prices remain pressured from a bumper harvest expected in September. Along with expected trade disruptions and a slowdown in the pace of US exports, prices are likely to decline during the summer. Regardless, prices remain bullish in the near term from a weakening dollar and near-term front loading.
To express views on these converging trends, investors can deploy a calendar spread on CME Micro Corn futures consisting of a long position on the near-term May contract (MZCK2025) and a short position on the September contract (MZCU2025). A hypothetical trade setup providing a reward to risk ratio of 1.8x is mentioned below:
A calendar spread on CME Micro Corn Futures is highly capital efficient with the above trade requiring maintenance margin of just USD 23 as of 15/April. The position remains protected from near-term price increase but benefits from the eventual price decline in September during harvest season.
MARKET DATA
CME Real-time Market Data helps identify trading set-ups and express market views better. If you have futures in your trading portfolio, you can check out on CME Group data plans available that suit your trading needs tradingview.com/cme .
DISCLAIMER
This case study is for educational purposes only and does not constitute investment recommendations or advice. Nor are they used to promote any specific products, or services.
Trading or investment ideas cited here are for illustration only, as an integral part of a case study to demonstrate the fundamental concepts in risk management or trading under the market scenarios being discussed. Please read the FULL DISCLAIMER the link to which is provided in our profile description.

Corn Contract will retracementI put short entry on the corn contract.
I draw fibo 75 and use ATR with ratio 1:3

Corn Futures LongCorn is now net long on the regression break.
The roll long on this pair is (-1.2%) per a month.
I am not taking this trade.

How to Trend the Trend for Beginners part 2Hey Traders so today we are going to continue the series for beginners about how to trade trends using techincal analysis.
So today we will go over what I believe is the best way to identify trends at the beginning.
Enjoy!
Clifford

Gartley pattern setup for a continuation to the upside? July corn has setup on the buy side , lets see if we can hold yesterdays low for a push bck to the upside
