XC1! trade ideas

Corn Futures (ZC1!), H1 Bullish BounceType : Bullish Bounce
Resistance : 756'4
Pivot: 745'2
Support : 738'0
Preferred case: We see the potential for bullish bounce from our Pivot level at 756'4 in line 28.6% Fibonacci retracement and 127.2% Fibonacci extension towards our 1st resistance level at 756'4 in line with 61.8% Fibonacci projection and 50% Fibonacci retracement. Our bullish bias is supported by stochastic indicator where it is at support level.
Alternative scenario: If price continues to dip, it can potentially move towards our 1st support level at 738'0 which is in line with 161.8% Fibonacci extension.
Fundamentals: No Major News.

Corn Commodity USA Sun Storm Investment Trading Desk & NexGen Wealth Management Service Present's: SSITD & NexGen Portfolio of the Week Series
Focus: Worldwide
By Sun Storm Investment Research & NexGen Wealth Management Service
A Profit & Solutions Strategy & Research
Trading | Investment | Stocks | ETF | Mutual Funds | Crypto | Bonds | Options | Dividend | Futures |
USA | Canada | UK | Germany | France | Italy | Rest of Europe | Mexico | India
Disclaimer: Sun Storm Investment and NexGen are not registered financial advisors, so please do your own research before trading & investing anything. This is information is for only research purposes not for actual trading & investing decision.
#debadipb #profitsolutions

Long above the bar that crossed prior closing priceWith the enhancement rules
Unprofitable sideways markets become profitable, but keep in mind that each market trades different, a 1 hour trailing stops works on corn better than on crude oil…
Anyway trading higher highs dont work all the time, so lets also trade breakouts from the 1 hour bar that crossed prior days closing price

Breakout - A long position Corn future May 2022 - ZCK2022
Break out of the triangle pattern. Uptrend continues
Buy at current price 754
Stoploss: 740
Take profit - TP1: 782, TP2: 824.

Corn Futures (ZC1!), H4 Bearish ReversalType : Bearish Reversal
Resistance : 782'2
Pivot: 765'0
Support : 730'0
Preferred case: We see the potential for bearish dip from our Pivot level at 765'0 in line 61.8% Fibonacci retracement and 100% Fibonacci projection towards our 1st Support at 730'0 in line with 78.6% Fibonacci projection .
Alternative scenario: If price continues to go up, it can potentially move towards our 1st Resistance level at 782'2 which is in line with a graphical swing high resistance.
Fundamentals: No Major News.

Corn Futures (ZC1!), H4 Bearish ReversalType : Bearish Reversal
Resistance : 782'2
Pivot: 765'0
Support : 730'0
Preferred case: We see the potential for bearish dip from our Pivot level at 765'0 in line 61.8% Fibonacci retracement and 100% Fibonacci projection towards our 1st Support at 730'0 in line with 78.6% Fibonacci projection.
Alternative scenario: If price continues to go up, it can potentially move towards our 1st Resistance level at 782'2 which is in line with a graphical swing high resistance.
Fundamentals: No Major News.

The mysterious connection between Corn and Gaming CompaniesRead these few interesting articles here , here and here

Corn: Continuation FlagMajor pattern: Weekly Channel
Minor continuation Pattern: Flag
Long on close above 765

Corn ( ZC1!) , H4 Potential bullish continuationType : Bullish continuation
Resistance : 797'4
Pivot: 763'2
Support : 778'2
Preferred Case: With price expected to reverse off the stochastics indicator, we are bias that price will drop to our 1st support of 728'4 in line with the 38.2% Fibonacci retracement and 78.6% Fibonacci retracement area from our pivot of 763'2 in line with the horizontal swing high resistance and 61.8% Fibonacci retracement.
Alternative scenario: Alternatively, price may break our pivot structure and head for 1st support at 778'2 in line with the horizontal swing high resistance.
Fundamentals: No major news event.

Corn ( ZC1!) , H4 Potential bullish continuationType : Bullish continuation
Resistance : 780'0
Pivot: 729'0
Support : 719'0
Preferred Case: With price moving the ichimoku cloud , we have a bullish bias that price will rise to our 1st resistance at 780'0 in line with the horizontal swing resistance from our pivot of 729'0 in line with the 78.6% Fibonacci retracement and horizontal swing low support.
Alternative scenario: Alternatively, price may break our pivot structure and head for 1st support at 719'0 in line with the 50% Fibonacci retracement .
Fundamentals: No major news event.

Corn ( ZC1!) , H4 Potential bullish continuationType : Bullish continuation
Resistance : 780'0
Pivot: 729'0
Support : 719'0
Preferred Case: With price moving the ichimoku cloud, we have a bullish bias that price will rise to our 1st resistance at 780'0 in line with the horizontal swing resistance from our pivot of 729'0 in line with the 78.6% Fibonacci retracement and horizontal swing low support.
Alternative scenario: Alternatively, price may break our pivot structure and head for 1st support at 719'0 in line with the 50% Fibonacci retracement.
Fundamentals: No major news event.

10 year Corn Projection (potentially) 10yr Corn outlook: 1 thought (of many I have) on the potential course of the corn market for the next 10 years. I feel the job of the market is to find a price high enough to ration future demand. Could be 7.80, maybe 8.50, or even 9.50. The potential is there for any of those numbers to mark a major swing high for Corn. The higher that mark is nearby, the more corn rations future demand. The low found after a major high is made could mark an area for the future multi year market structure. The market should remain very sensitive for another few years. Sensitive to world demand and production misses across the globe. There are many climate cycles coming ahead that are all supportive to potential Ag production shortages. **Not a prediction, something to watch**
At some point we return to a tighter, more defined market structure working low prices against the long term uptrend line… 4.50-5.25 ???

Corn ( ZC1!) , H4 Potential bullish continuationType : Bullish continuation
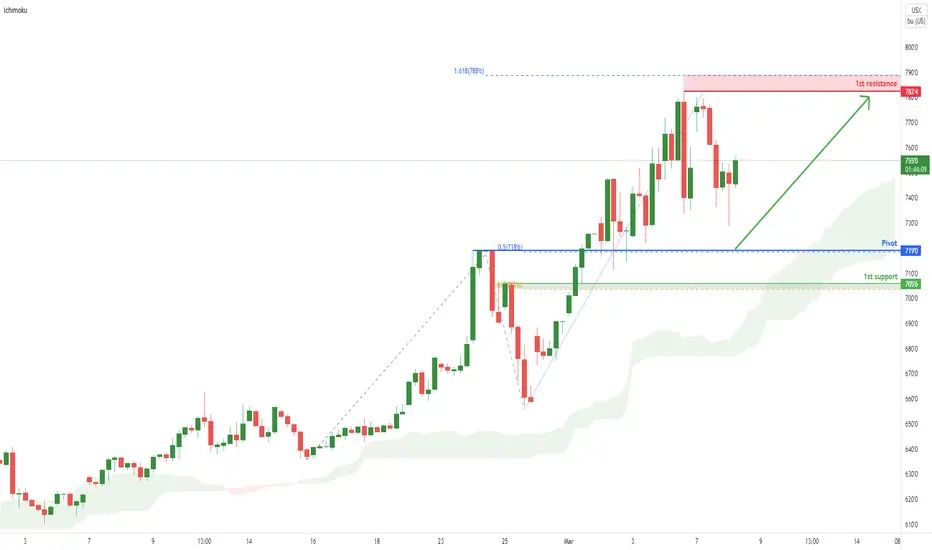
Resistance : 782'4
Pivot: 719'0
Support : 705'6
Preferred Case: On the H4 chart, price is near our pivot of 719'0 in line with horizontal overlap support and 50% Fibonacci retracement . Price can potentially rise to our 1st resistance level at 782'4 in line with the 161.8% Fibonacci extension . Our bullish bias is supported by how price is moving above the ichimoku cloud .
Alternative scenario: Alternatively, price may head to our 1st support at 705'6 in line with the horizontal overlap support and 61.8% Fibonacci retracement.
Fundamentals: No major news event.

Corn ( ZC1!) , H4 Potential bullish continuationType : Bullish continuation
Resistance : 793'6
Pivot: 719'4
Support : 659'0
Preferred Case: On the H4 chart, price is near our pivot of 719'0 in line with horizontal overlap support and 50% Fibonacci retracement . Price can potentially rise to our 1st resistance level at 782'4 in line with the 161.8% Fibonacci extension . Our bullish bias is supported by how price is moving above the ichimoku cloud .
Alternative scenario: Alternatively, price may head to our 1st support at 705'6 in line with the horizontal overlap support and 61.8% Fibonacci retracement.
Fundamentals: No major news event.
Mar 7, 22 Corn Pullback - Buy opp?In looking at Corn, you know that Crop Planting in the Ulraine is in less than 60 days. Who here thinks that that is actually going to happen with what's going on over there??
If they can't get their corn planted, there could be some supply issues. Add the shipping delays that the world is experiencing and the price could continue to go up. How high? Not sure. But last week corn was on a tear up. Today it is coming down some.
Maybe a Buy Order in around 720? I will keep watch to see how low it will go but 720 seems like a support level to me. Obviously if price crashes through it and moves down 700 would be the next logical support, and buying point.
Wheat has gone limit up for over 5 days now - Corn went crazy last week and today is in a pullback. I don't know for sure, but I believe over the next month, Corn will continue to go up. I just want to get in on a pullback and ride price up so that's what I'm looking for.
Stay safe.
Heiko


Corn Futures - /ZC - Monthly chart going for All-Time High?Corn Futures - /ZC - pushing through the Points on the monthly chart. Will we see new highs for corn? Get you popcorn now and watch the show. Big things are happening in the world.

Corn ( ZC1!) , H4 Potential bullish continuationType : Bullish continuation
Resistance : 793'6
Pivot: 719'4
Support : 659'0
Preferred Case: On the H4 chart, price is near our pivot of 719'4 in line with horizontal overlap support and 50% Fibonacci retracement . Price can potentially rise to our 1st resistance level at 760'0 in line with the 161.8% Fibonacci extension . Our bullish bias is supported by how price is moving above the ichimoku cloud .
Alternative scenario: Alternatively, price may head to our 1st support at 659'0 in line with the horizontal swing low support.
Fundamentals: No major news event.

Corn ( ZC1!) , H4 Potential bullish continuationOn the H4 chart, price is near our pivot of 719'0 in line with horizontal overlap support and 38.2% Fibonacci retracement . Price can potentially rise to our 1st resistance level at 760'0 in line with the 127.2% Fibonacci projection and 161.8% Fibonacci extension . Alternatively, price may head to our 1st support at 689'4 in line with he 61.8% Fibonacci retracement level. Our bullish bias is supported by how price is moving above the ichimoku cloud .
Any opinions, news, research, analyses, prices, other information, or links to third-party sites contained on this website are provided on an "as-is" basis, as general market commentary, and do not constitute investment advice. The market commentary has not been prepared in accordance with legal requirements designed to promote the independence of investment research, and it is therefore not subject to any prohibition on dealing ahead of dissemination. Although this commentary is not produced by an independent source, FXCM takes all sufficient steps to eliminate or prevent any conflicts of interest arising out of the production and dissemination of this communication. The employees of FXCM commit to acting in the clients' best interests and represent their views without misleading, deceiving, or otherwise impairing the clients' ability to make informed investment decisions. For more information about the FXCM's internal organizational and administrative arrangements for the prevention of conflicts, please refer to the Firms' Managing Conflicts Policy. Please ensure that you read and understand our Full Disclaimer and Liability provision concerning the foregoing Information, which can be accessed on the website.

🌾CORN - BitCorn is Back🌽🌮🍿Last year we bought because of inflation.
This year things are even more serious, there is a war between Russia and Ukraine.
Column: Concerns rise over Black Sea spring crops amid Russia-Ukraine war: www.reuters.com
Looks like Fajitas and Tacos🌮, Kellogs frosties 🐯 and other cereal , corn on the cob 🌽, even go ''pop'' in the cinema🍿 might become expensier. On a more serious note, poverty will hit some and food will become a luxury for some.
Sad but true. Scary...
May logic prevail,
the FXPROFESSOR 🌾

Corn ( ZC1!) , H4 Potential bullish continuationOn the H4 chart, price is near our pivot of 719'0 in line with horizontal overlap support and 38.2% Fibonacci retracement. Price can potentially rise to our 1st resistance level at 760'0 in line with the 127.2% Fibonacci projection and 161.8% Fibonacci extension. Alternatively, price may head to our 1st support at 689'4 in line with he 61.8% Fibonacci retracement level. Our bullish bias is supported by how price is moving above the ichimoku cloud.
Any opinions, news, research, analyses, prices, other information, or links to third-party sites contained on this website are provided on an "as-is" basis, as general market commentary, and do not constitute investment advice. The market commentary has not been prepared in accordance with legal requirements designed to promote the independence of investment research, and it is therefore not subject to any prohibition on dealing ahead of dissemination. Although this commentary is not produced by an independent source, FXCM takes all sufficient steps to eliminate or prevent any conflicts of interest arising out of the production and dissemination of this communication. The employees of FXCM commit to acting in the clients' best interests and represent their views without misleading, deceiving, or otherwise impairing the clients' ability to make informed investment decisions. For more information about the FXCM's internal organizational and administrative arrangements for the prevention of conflicts, please refer to the Firms' Managing Conflicts Policy. Please ensure that you read and understand our Full Disclaimer and Liability provision concerning the foregoing Information, which can be accessed on the website.
