Corn Futures Probable Decline, first to 560 then LowerLooking at corn July futures, we expect price to drop now to the 560 level. The orthodox peak was actually on April 27th where wave 5 ended near 684. The following rise to 735 was only wave B up of the overall downward correction, but it indicates that price is itching to go higher. 560 also represents a 38.2% retracement of the 5-wave rise of this thrust, which originated from a lower B-wave triangle. We expect that, after 560, price will recover near to the peak again and then fall still lower, reaching down closer to 61.8%. It will be inclined to hit the level of that 4th wave below.
As with other commodities such as crude oil, this rally from last year's bottom is itself only the upward part of a larger downward correction (a final C wave up of a larger B wave up, which will be followed by a larger C wave down) but may reach impressive highs before turning down again.
XC1! trade ideas


Short CornWe have already broke the trendline, but I think we might come back and hit that resistance one more time before coming down. This one might not play out but lets sit and wait, if we miss this opportunity don't worry always another day to catch some profits.

LONG after CorrectionCorn made crazy bull run and finally made nice correction to 0.236 Fib.
COT are still extremely bullish by huge net long positions by NON COMERCIAL .
Now I expect to move up for new high.

Buy anything callAm i looking at wrong, right? tell me i'm wrong..
We're in a really crazy world.
The Fed is announcing that there is no inflation yet, but this is bullshit. imo Crazy inflation is at the starting point.
If the price of raw materials goes up so rapidly, All prices are reflected in the market.
I don't know how much hamburgers will cost expensively in near future.
Seriously, consider investing in Bitcoin. It's okay if it's not Bitcoin.
Since it doesn't have to be Bitcoin, but buy an etf (qqq, tqqq, spy) instead.
I think it will be the last chance if the Fed gives the rate-raising card, and this will be the last dip to the market.
Fed cannot raise interest rates. Employment indicators are smashed. and This is a problem that cannot be solved forever.


How to make money online ?Now, before you get too excited about it, I am not selling you any course, products or even membership , haha. If you get spam mails, FB advertisments, text messages about how someone can make money earning 4, 5, 6 or even 7 figures income online, you know for a fact these things :
1. Millions of people have attempted to sell something online to make money
(Only the top 10% or lesser really make good money, many are just struggling)
2. The notion that it is advertised as easy, no need software, special domain knowledge and yet can make more money than a regular job has enticed many to part with their hard earned money to these smooth talking course providers!
I too had my fair share trying to hawk wares online but with limited success. I discovered unless you have a unique product that is in high demand (like this ), else you would need to have a differentiating point so that others would come and visit your site.
So, in the past, I would search online everyday, read lots of news and articles trying to be the first to find the Holy Grail product , affordable and yet within my means to do the business. It was an uphill, stressful task.
Then, after much hits and misses, I discovered trading and stock investment. Of course, I lost money , burnt my accounts thinking I could retire early (dreams some course providers would sell you)..... I did not give up for some reasons and persevere and am proud to say this has now become one stream of income for me. And the best part, I love this business.
You see, in stock investment, you need not be the first to discover the company. That would be like buying IPOs , some like Amazon and FB or Macdonald would made you a millionaire but how many has that kind of foresight ? The good thing is anybody can catch the train to this path and at your own budget , time and risk appetite. There is something for everyone, that's the beauty.
For example, late last year, I had plough aside some capital to invest in many commodities, from corn, wheat, soy, copper, silver ,gold to agricultural companies like Yihai Kerry, Wilmar, etc. I am thankful to God for he has once more blessed me abundantly.
It is all about demand and supply ! The more buyers for this commodity, say Corn, the more the prices will be push up.So, you can be a buyer or seller online unlike the traditional mode of making money online - you need to be a seller only (you buy from wholesaler or manufacturer and in turn sell to retailers for a profit).
And you need not put in a lot of capital to start this business, which is what I like about it. You can now buy shares in fractional shares, very affordable and with more brokers offering zero commission, you net profits is even higher if you get it right.
And getting this game right is not difficult - just follow the trend. By that , I mean think big picture - who is the biggest, most popular social media company globally? Most would say FB , right ? Or in China, it would be Tencent who owns wechat and many other apps. They monopolised the market and that is why the government now is taking action against them.
So, if you can't be an influencer with millions of followers to make the advertisment income, consider this option. There are tons of free materials online, videos , books in library, etc that can make you sounds like an expert. Then, there is of course, my favourite social site, TV which offers a plethora of services - cool charts to begin with and different authors for you to follow. You can cross check your own analysis with others and do paper trader for a while before you gain more confidence.
Oh, did I say you need not be licensed to buy or sell shares ? I mean, other than the legal age required and you are not a bankrupt, the barriers to entry is really really low. There is no requirement on your educational background, job titles you held before, etc. The janitor can buy FB shares just like the CEO of a MNC company. No discrimination here !
Give yourself the opportunity and if you have any questions, ask around TV. Many people would be more than happy to help, for free.
Have fun and enjoy the ride up ! Or down (if you are selling)

ZCK2021. Ags have been the market to be in.The ag's have been hotter than bitcoin this spring, and I've been so stuck in my little learner's bubble I barely noticed.
I'm looking at corn thinking this is some buyer exhaustion, but I also see that typically corn prices stay on the rise through June/July.
This zone I have highlighted seems like a really friendly place to enter the market, however, I don't understand what is going on at the top, and if that is some kind of artificial capping done by market makers I absolutely don't want to be buying just under it.
What in the world is going on here?

🍿 ''Bit''CORN keeps FLYING!🌽🌮🌾We knew we could have the rewards of a ''cryptocurrency trade'' with aq traditional, soft commodity and we knew that was Corn.
Further to our previous idea the chart was agreeing with the statement and we are now half way through to the 918 target.
So, allow me to call it ''BitCorn''
ps. Fun fact :
''Corn has proven itself to be one of the most effective alternative energy sources, placing it in the ranks of coal, gas, wood, etc. Corn is an excellent energy source because the corn cob is very dense and slow burning.
Is corn an efficient energy source?
Corn ethanol seems like a renewable energy source — a source that cannot run out — because corn can be planted again and again, and the energy in corn comes from the sun, not a limited supply of coal or oil in the ground. ... Most of this energy currently comes from fossil fuels like coal, oil and natural gas''.
the FXPROFESSOR

July Corn Sell Idea175% crosses 2x1 line for a sell opportunity. Expecting a 2 day reaction before continuation.

corn is the smart money move since last july china had one of the largest corn purchases to date and largest purchases with the usa since 1980 something since august corn has been on a rampage and i expect it to keep going to new ath's.

So here we are... Trend continues. Palladium ATH today!Bulls exhausted the bears finally.
I got kicked out of soybeans and missed buying corn at the bottom of the triangle by little, I was too slow to decide and to look into it I think.
Commodities are going up. Gold not so much, investors are not interested.
But metals used in the real world, prices are all going up.
Today Palladium marked a new all time high.
Copper is 38 cents away from its ath, it retraced more than 90% only 6-7 to go.
Hard commodities like lumber got a lot of attention but while no one was watching food it kept going up.
And we got used to plentyful food, no one can imagine the west struggling to buy it, Corn & Soybeans are not far from ath.
China did an outstanding move by developing their financial markets (and conquering Hong Kong for its financial center - I'm just looking at the economics not here to argue about ethics & politics), to allow them starting to distance themselves from CME/American prices.
One has to admit regardless of what "side" they're on, that sometimes, when the leaders are intelligent, the planned economy can do something right.
Makes no sense to have irrational biases. If I offend someone well nothing I can do, just post silly indicators that no one made money from? Complete waste of time.
Less influence from the American economy in general, american commodity market prices, american fundamentals, american currency.
China got away from the building just before it collapses, just like in action movies where the fuse has 2 seconds left.
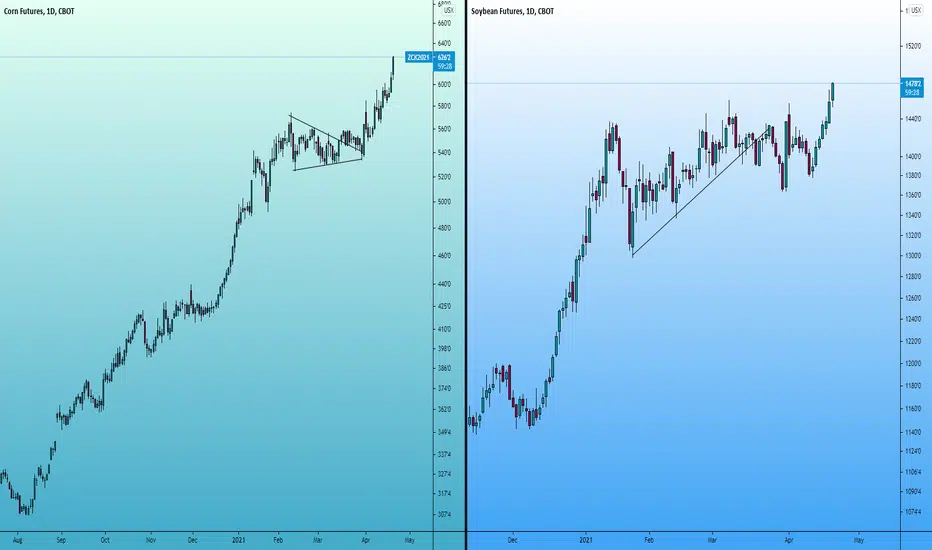
I really wish I didn't miss. I think I want to stay away from Corn as it has been the leader but I think Soybeans will be the next one.
Now all I have to do is wait for a pullback, around 1525 preferably.
I knew an explosion was imminent, but can't predict exactly when nor the random volatility.
This happens really often to me, being so right but missing out, I wish I had the ability to just buy a call for these.
Already rich people get that option, not me.
🌾CORN - Some Call it 'BitCorn🌽🌮🍿No, it's not a cryptocurrency poised to double in price, it's just the price of CORN (yes, the one we eat).
You can make Fajitas and Tacos with it🌮, use it as a topping on your pizza or omelets or eat it on the cob 🌽, you can even go ''pop'' in the cinema🍿
Over resistance, tested it as support and not gonna stop until it hits 900 this year.
the FXPROFESSOR 🌾
ps. if you like futures check our cotton ideas

This Corn Spread Can PopThis is a good spread to trade. If you’ve not traded Corn before, just read on, because this style of spread trading is interesting. It has both technical and fundamental aspects and is built on a history of good stats.
Corn has an annual crop cycle. It’s planted in April/May, subject to weather issues in the following months, then harvested for first delivery on the Dec futures contracts. The Dec contract is based on what they call the ‘new crop’.
But before then, there are other contracts still banging about.
Corn futures have March, May, July, Sep and Dec maturities. So any active contracts before Dec are based on the ‘old crop’, the stuff that was harvested last year.
So early to mid-year, we have a situation where some of the futures contracts are based on known supply and others (Dec and beyond) are based on the stuff that is still green. That young and growing crop is subject to uncertainty of weather and other growing conditions.
Spreads are great tools in which to trade shifting certainty. And with something like an annual cycle of growth and harvest, you build a database and look for what they call seasonal patterns.
The Trade:
Selling the Sep and buying Dec for a hold of several months, in the past has proven to be a very reliable trade.
In fact, optimized for timing, an entry during May and an exit early August has been profitable 95% of the time in the last 20 years.
For 2020, I like this spread now given the market is in backwardation. That means the near (short) month is trading above the back (long) month. Corn has had a great run up over the past few months and pull back might see that backwardation reverse to contango and move with the seasonal trend.
Stats:
19yrs out on 20yrs profitable. That’s selling the spread in May and buying back in August. Optimized timing of course, but still the numbers are good.
In the last 10yrs, profit has averaged about 10 cents, or $500 per spread. Drawdowns have been three figures also, aside from 2011-2013 when things went a bit crazy.
Trading;
This one has an exchange listed spread so entry, exit and GTC stops are easy.
For something like this, I would tend to start with a 3*ATR for a stop and see where it goes. Entries by way of selling into rallies.
Check your broker offers SPAN margining. If not, get a new broker.
Alternatives:
The same spread can be achieved by selling July instead of Sep. Some years that is a better option, some not. More often than not, it would carry more volatility (up and down).

Everything is set for a large bull run - Corn
Corn looks very bullish to me.
Corn has large gaps between support/resistance levels. That means when the price moves it moves fast.
Corn price has broken two resistance levels and broken out of a symmetric triangle to continue the bullish momentum. The large time gap between the previous high and the breakout could mean that Corn could move to the next level quickly as well.
This is not a financial advice, do your own research before investing.

New Highs in Corn
Corn probes above $6 for the first time since 2013
Farmers will favor beans
Keep an eye on gasoline and ethanol prices
Corn continues to pop going into the planting and growing seasons- It’s all about the weather
Backwardation as the market has high hopes for 2021 output
In late April 2020, the corn price fell to its lowest level since 2008 when the continuous corn futures contract found a bottom at $3.0025 per bushel. The pandemic pushed prices lower across all asset classes. Corn is the primary ingredient in US ethanol production. The ethanol mandate that requires a blend of gasoline and biofuel in the US closely ties corn’s price to crude oil and gasoline. In April 2020, crude oil fell below zero to a low of negative $40.32 per barrel. Gasoline prices declined to 37.60 cents per gallon wholesale in March 2020, the lowest price since 1999. The price carnage in the energy sector and selling in all markets pushed corn to the $3 level where it found a bottom.
Last week, corn moved to its highest price since July 2013 at nearly double the April 2020 low. Nearby May futures probed above the $6 per bushel level.
Corn probes above $6 for the first time since 2013
On April 15, corn futures put in the most recent high when they traded to $6.015 per bushel on the nearby March futures contract.
The chart highlights eight consecutive months of gains in the corn market as of mid-April 2021. A close above the $5.6425 level at the end of April will mark the ninth straight monthly price increase in the coarse grain.
Open interest, the total number of long and short positions in the corn futures arena has been rising with the grain’s price. Increasing open interest as the price of a futures market rises is typically a validation of a bullish trend. Monthly price momentum and relative strength indicators are in overbought conditions, but they continue to rise. Monthly historical volatility at 22.31% signifies the rally is slow and steady.
Corn futures are bullish, with the price at its highest level since July 2013. The next upside target is $7.30 per bushel, that month’s peak, which is a gateway to the 2012 $8.4375 all-time high in the corn futures market.
Keep an eye on gasoline and ethanol prices
The US ethanol mandate ties corn’s price to gasoline. The US is the world’s leading corn producer and exporter. Corn is the input into US ethanol processing. In Brazil, sugar is the input. Like corn, sugar prices have been rallying over the past months as the demand for ethanol rises with gasoline prices.
The chart shows that gasoline futures rose from the lowest price of this century at 37.6 cents per gallon in March 2020 to the highest level since 2018 at $2.17 per gallon in March 2021. Higher gasoline prices have pushed ethanol to a multi-year peak.
The monthly ethanol futures chart illustrates that the biofuel’s cost has risen to its highest level since December 2014 at $2.01 per gallon. Higher ethanol prices support higher corn prices.
Continue reading the full article using the link below.
Trading advice given in this communication, if any, is based on information taken from trades and statistical services and other sources that we believe are reliable. The author does not guarantee that such information is accurate or complete and it should not be relied upon as such. Trading advice reflects the author’s good faith judgment at a specific time and is subject to change without notice. There is no guarantee that the advice the author provides will result in profitable trades. There is risk of loss in all futures and options trading.

Brazilian Corn is on the runProjecting that triangle move we could be touching the 92,5 in the next days for another test of the 87 support from the last top.
Keep it safe, have a good one.

Corn Futures Towards a Decline With Very High Probability!Hello ladies and gentlemen, according to my graphical analysis Of The Corn Futures , there is a very high probability of drop to the 549'4 level in the coming weeks.

Corn at key level for the week My bias is still short on corn. Will look for a pull back down to around 535. Based on price action above 555 it may be prime to cover and go back in long with a target of 565 - 570

CORN FUTURES Towards a Decline With High Probability!Hello ladies and gentlemen, according to my graphical analysis Of The Corn Futures, there is a high probability of drop to the 524'0 level in the coming weeks.

Corn support - monthly chartCorn at a 10 year support on monthly chart. Funds in extreme short position and Commercials extreme long could move the price higher soon.

Traditional|ZC1!|LongLong ZC1!
Activation of the transaction only when the blue zone is fixed/broken.
The author recommends the use of anchoring fixed the blue zone, this variation is less risky.
If there is increased volatility in the market and the price is held for more than 2-3 minutes behind the activation zone after the breakdown, then the activation of the idea occurs at the prices behind the activation zone.
The idea is to work out the resistance level .
* Possible closing of a trade before reaching the take/stop zone. The author can close the deal for subjective reasons, this does not completely cancel the idea and is not a call to the same action, you can continue working out the idea according to your data, but without the support of the author.
+ Maybe right now we will go even lower, then it's okay, the idea is not activated and simply canceled.
+ ! - zone highlighted by the ellipse is a zone of increased resistance, in this area there is a possible reversal for a correction, please take this factor into account in this transaction.
The "forecast" tool is used for more noticeable display of % (for the place of the usual % scale) of the price change, I do not put the date and time of the transaction, only %.
Blue zones - activation zones.
Green zones - take zones.
The red zone - stop zone.
Working out the stop when the price returns to the level after activation + fixing in the red zone.
Orange arrow - the direction of take.
Black arrow - neutral scenario without activating the trade.
The red arrow - the direction of the stop.
SUM PNL: This parameter displays the total % of all closed ideas of the "new" format (according to the author) for this sector at the time of publication of the idea. The calculation is very "clumsy" just the sum of the profits of all the ideas, based on this indicator, you can more accurately assess the risks when working with my ideas of this sector. I present you the construction of the idea, you can use it yourself as you like based on your subjective view and risks, the calculation of the PNL indicator is carried out only on transactions that the author closed on TV in manual mode or by take.
P.S Please use RM (risk management) and MM (money management) if you decide to use my ideas, there will always be unprofitable ideas, this will definitely happen, the goal of the system is that there will be more profitable ideas at a distance.
