Soy beans set up spread longSoy on the year over year spread is getting to its widest point and could be setting up a good buying spot. This is a great way to get long beans from this low with great reduction of buying power. After a confirmed bounce off bottom and if we still have enough time will look to adding a theta component to the trade. Please feel free to ask questions.
XK1! trade ideas


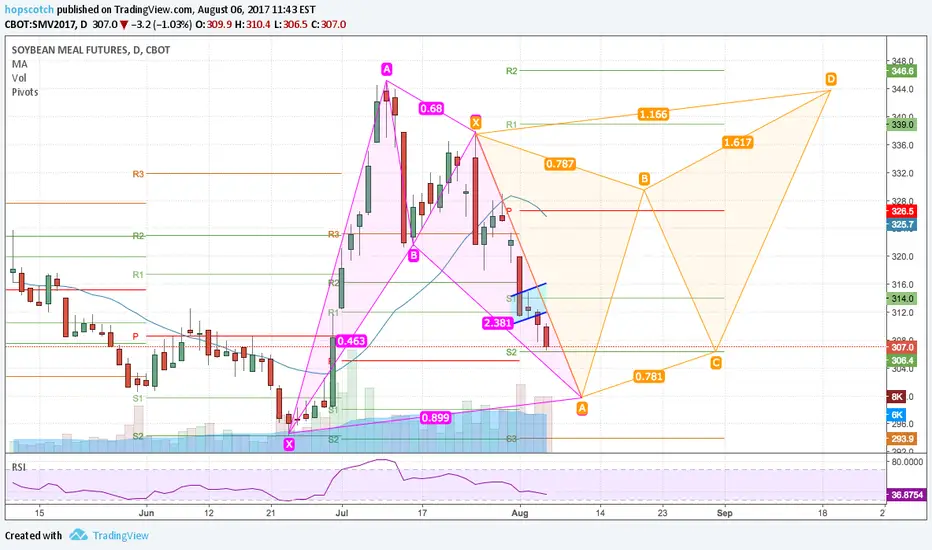
Bullish Bat Setup of Soybean MealA bullish bat is being created for October Soybean Meal. Next downside target at 297.9 at two S1s ago. This would bottom out SM on RSI. "Farm Futures expects next week’s USDA report to cut 2017/2018 ending stocks to 415 million from USDA’s July 460 million due in part to expected lower production of 4.214 billion vs 4.26 billion." At the moment predicting Bearish Cypher for next pattern.

Near double topHeiken Ashi confirmation candle on the 1 hour, 4 hr oversold, definetly the start of a change in trend.
SL 1057

SOYBEAN OIL (DAILY)Yesterday soybean oil breakout from sideway with momentum and closed above the blue line. Expecting more upside from this commodity.


The weakest agri, with some interesting divergences
d- No doubt, Soybeans is absolutely the weakes in agri space, it is quite bearish. However there are few interesting signs, which call bears to be cautious.
Weekly:
- Bearish Ichimoku
- Bearish Heikin-Ashi
- Bearish EWO and MACD
- Only questionmark is the 909 key supp/resistance level
Daily:
- Bearish Ichimoku
- Counter trend (swing) bullish / neutral Heikin-Ashi
- What makes me think is the possible bullish wedge formation in combination with quite relevant positive ivergence in EWO and MACD
- Keye reversal levels are: 928 and 946

R&R AKA The Bull's Glare Strategy!Go Long when price trades within the entry or go short when price trades withing the short entry level

SOYBEANS is the downtrend over?Hi guys, I hope you're all having a wonderful weekend.
Very hot in London, and about to have a barbecue and take advantage of the weather! Before that I will quickly post this analysis :-)
SOYBEANS looks good for upside. It looks like the down trend is overextended and the move is over. I am expecting the start of a new trend to the highs from here. Could be an impulsive move, but I will soon find out. I will update this idea on smaller timeframe as it progresses.
Like & follow all my ideas to motivate me to publish more content.
Best regards,
Tom_Killick

Some WD Gann Aplications To Soybean Price forecast on soybean futures for 15th of June. based on "natural trends".


Soybean futures: Daily uptrend signal, potential monthly bottomI am long Soybeans here, I think we can see a monthly bear trap from here onwards.
There is a daily uptrend signal, yet to be confirmed but likely to occur. I'd reccomend entering longs gradually, to ride the monthly trend.
Best of luck,
Ivan Labrie.

Bearish Bean Oil Channel Close to Resistance Simple trade strategy, DEC Bean Oil has been in a bearish channel for a while now. Price is close to reaching resistance. I think its a decent long play (possibly short term) until resistance is hit, then look for direction:
1. If breakout, buy signal
2. If resistance holds, sell signal
(The Stoch RSI seem to look very overbought to me. I could see the commodity staying overbought until the price is close to the resistance, and then selling off)
Again, this is a simple strategy with not much depth behind it. The channel is clearly a valid one, and could provide traders with a good indication of price movement.
Opinions and Ideas are my own, Happy trading!

SOYBEANS DAILY UPDATEHi guys,
SOYBEANS looks good for upside out of the consolidation. Use your tested trading strategy to determine where you should take the buy.
Well done to anyone following my Trading view page this week, my ideas on Trading view alone made over 600 pips already! So like and follow to see more great ideas.
Best regards,
Tom_Killick

SOYBEANS longHi traders,
Keep an eye on this one. The next impulse will be up, but the question is, is the downside over? I guess soon we will all find out. Maybe one more down move before the big move up.

Soybean Futures Bearish CypherJuly Soybeans rising higher. Potential target 990'2 to build out a Bearish Cypher.

Soybean Meal Rose off Shark PatternJuly Soybean Meal rose off Shark pattern. Too much Soybean in market right now so rise is probably getting rid of oversold position before starting down again. Projecting rise to somewhere around 328-324. Next projected pattern bearish butterfly.

SOYBEANS watch for a buy.Hi traders,
Soybeans look good for a buy. Price is at major technical level, and watching for a buy is likely a very good idea.
Best regards,
Tom_Killick

Potential Bullish Shark for BeansUSDA report put Beans lower Friday. Be alert for spring and summer rallies, which have occurred in the previous two years. Next downside for Beans is a retest of 947.

Soybeans Doji Series with HaramiMay Soybeans has formed a series of long legged dojis at the end of a completed bullish Butterfly that are rising. This could be a rising flag that will create further downside selling, or turn to and upward movement. Waiting for confirmation. Open Interest is slowly rolling suggesting a turn, and RSI is very bearish. Today marked a harami reversal pattern. We are forecasting a Gartley as next pattern to resistance at 1036

Soybean Meal Gartley Almost CompleteMay Soybean Meal Gartley pattern almost complete, but may turn into a Bullish Butterfly. We may see a pause at 78.6 before trending lower depending on how fast Brazil can take off their large crop, and what the feelings are of traders. Major support for butterfly comes in at 313.7. Gartley comes in at 322.7
