Beans on the moveFormed a double bottom against yearly pivot level. Now on the way up again. First target S3
XK1! trade ideas

Beans on the reboundBeans made a second bottom at the same yearly fib pivot. See if it can get past the last swing high after a bounce I noted earlier this year on the same level.

Soybeans testing key supportSoybeans
Technicals (May)
May soybean futures broke lower but found support at our 4-star support pocket which we've outlined in recent reports as 1128 1/2-1133 1/2. The Bulls need to see this pocket defended, a failure to do so could accelerate the selling pressure. Below this support pocket and prices are back in uncharted territory, the next support level would be the psychologically significant $11.00 level.
Bias: Neutral/Bearish
Resistance: 1155-1160***, 1170-1175***
Pivot: 1150
Support: 1128 1/2-1133 1/2****, 1100**
Fund Positioning
Friday's Commitment of Traders report showed Funds were net sellers of roughly 1k contracts, putting their net short position at 139,310 contracts. Broken down, that
is 54,057 longs VS 193,367 shorts.
Seasonal Trends
(Past performance is not necessarily indicative of future results)
Below is a look at price averages for November soybeans, using the 5, 10, 15, 20, and 30 year averages.
Check out CME Group real-time data plans available on TradingView here: www.tradingview.com
Disclaimers:
CME Real-time Market Data help identify trading set-ups and express my market views. If you have futures in your trading portfolio, you can check out on CME Group data plans available that suit your trading needs www.tradingview.com
*Trade ideas cited above are for illustration only, as an integral part of a case study to demonstrate the fundamental concepts in risk management under the market scenarios being discussed. They shall not be construed as investment recommendations or advice. Nor are they used to promote any specific products, or services.
Futures trading involves substantial risk of loss and may not be suitable for all investors. Trading advice is based on information taken from trade and statistical services and other sources Blue Line Futures, LLC believes are reliable. We do not guarantee that such information is accurate or complete and it should not be relied upon as such. Trading advice reflects our good faith judgment at a specific time and is subject to change without notice. There is no guarantee that the advice we give will result in profitable trades. All trading decisions will be made by the account holder. Past performance is not necessarily indicative of future results.

Soybeans Drift LowerSoybeans
Technicals (May)
May soybean futures attempted to hold ground yesterday, but it lacked conviction. Prices are giving back those gains in today’s trade. 1155-1160 is the first resistance pocket the Bulls need to overcome to help spark a bigger relief rally. A failure to do so keeps the potential for new lows alive and well.
Bias: Neutral/Bearish
Resistance: 1155-1160, 1170-1175
Pivot: 1150
Support: 1128 1/2-1133 1/2****
Fund Positioning
Friday’s Commitment of Traders report showed Funds were net sellers of roughly 1k contracts, putting their net short position at 139,310 contracts. Broken down that is 54,057 longs VS 193,367 shorts.
Seasonal Trends
(Past performance is not necessarily indicative of future results)
Below is a look at price averages for November soybeans, using the 5, 10, 15, 20, and 30 year averages.
Check out CME Group real-time data plans available on TradingView here: www.tradingview.com
Disclaimers:
CME Real-time Market Data help identify trading set-ups and express my market views. If you have futures in your trading portfolio, you can check out on CME Group data plans available that suit your trading needs www.tradingview.com
*Trade ideas cited above are for illustration only, as an integral part of a case study to demonstrate the fundamental concepts in risk management under the market scenarios being discussed. They shall not be construed as investment recommendations or advice. Nor are they used to promote any specific products, or services.
Futures trading involves substantial risk of loss and may not be suitable for all investors. Trading advice is based on information taken from trade and statistical services and other sources Blue Line Futures, LLC believes are reliable. We do not guarantee that such information is accurate or complete and it should not be relied upon as such. Trading advice reflects our good faith judgment at a specific time and is subject to change without notice. There is no guarantee that the advice we give will result in profitable trades. All trading decisions will be made by the account holder. Past performance is not necessarily indicative of future results.

Soybeans Under PressureSoybeans
Technicals (May)
May soybean futures broke back below support yesterday which accelerated the selling pressure and keeps the door open for a retest of the February lows in play, that comes in from 1128 1/2-1133 1/2.
Bias: Neutral
Resistance: 1155-1160***, 1170-1175***
Pivot: 1150
Support: 1128 1/2-1133 1/2****
Fund Positioning
Friday's Commitment of Traders report showed Funds were net sellers of roughly 1k contracts, putting their net short position at 139,310 contracts. Broken down that is 54,057 longs VS 193,367 shorts.
Seasonal Trends
(Past performance is not necessarily indicative of future results)
Below is a look at price averages for November soybeans, using the 5, 10, 15, 20, and 30 year averages.
Check out CME Group real-time data plans available on TradingView here: www.tradingview.com
Disclaimers:
CME Real-time Market Data help identify trading set-ups and express my market views. If you have futures in your trading portfolio, you can check out on CME Group data plans available that suit your trading needs www.tradingview.com
*Trade ideas cited above are for illustration only, as an integral part of a case study to demonstrate the fundamental concepts in risk management under the market scenarios being discussed. They shall not be construed as investment recommendations or advice. Nor are they used to promote any specific products, or services.
Futures trading involves substantial risk of loss and may not be suitable for all investors. Trading advice is based on information taken from trade and statistical services and other sources Blue Line Futures, LLC believes are reliable. We do not guarantee that such information is accurate or complete and it should not be relied upon as such. Trading advice reflects our good faith judgment at a specific time and is subject to change without notice. There is no guarantee that the advice we give will result in profitable trades. All trading decisions will be made by the account holder. Past performance is not necessarily indicative of future results.

CBOT soybeans sink on technical selling, spillover from lower grChicago Board of Trade (CBOT) soybean futures dropped on Tuesday on technical selling and spillover support from lower corn and wheat.
-CBOT May soybeans ended down 11-3/4 cents at $11.74 per bushel after touching the lowest level since March 8.
-Selling accelerated as the benchmark contract broke through technical chart support at its 20- and 50-day moving averages and a recent low posted last Thursday.
-CBOT May soymeal settled $5.10 lower at $328.30 per short ton, and May soyoil gained 0.36 cent to settle at 48.60 cents per pound.
-Stiff competition for U.S. export sales from Brazil and concerns about demand from top-importer China still hang over the market.

CBOT soybeans end weaker on dull demand, lower grainsChicago Board of Trade soybean futures eased on Monday on good supplies, seasonally slowing U.S. export demand and spillover pressure from falling corn and wheat prices.
-CBOT May soybeans settled down 5-3/4 cents at $11.85-3/4 per bushel.
-CBOT May soymeal settled $4.30 lower at $333.40 per short ton, and May soyoil gained 0.29 cent to settle at 48.24 cents per pound.
-Stiff competition for U.S. export sales from Brazil and concerns about demand from top-importer China still hang over the market.
-Brazil's soybean harvest for the 2023/24 cycle had reached 74% of the planted area as of last Thursday, agribusiness consultancy AgRural said on Monday, up 5 percentage points from the previous week.
-Traders continued to digest U.S. Department of Agriculture (USDA) data released last Thursday that projected U.S. 2024 soy plantings at 86.5 million acres, in line with trade expectations and up 3% from 2023. The acreage total is likely to shift with changing spring planting conditions.
-The USDA on Monday morning said export inspections of U.S. soybeans totaled 414,484 metric tons in the week ended March 28, below trade estimates for at least 500,000 tons.
-The USDA is due to release its monthly soy crush report later on Monday. Analysts surveyed by Reuters on average expect the government to report that processors crushed 196.4 million bushels of soybeans in February, up 0.8% from January and up 11.0% from the same month a year earlier.

Are Soybeans Setup For a Bigger Rally?Thursday marked the last trading day of the month and first quarter, which coincides with one of the more highly anticipated USDA reports of the year; quarterly stocks and prospective plantings.
The USDA estimates that there will be 86.51 million acres of soybeans planted in the U.S. this year, that was a hair below the average analyst estimate of 86.53 million but still nearly 3 million acres more than last year. Quarterly stocks were reported at 1.845 billion bushels, this was slightly above the average estimate of 1.828 billion, and above last years 1.687 billion.
With the headline numbers coming in close to expectations, the market was little changed at the close. From a technical perspective though, the Bulls were happy to see support near $12.00 hold, which is both technically and psychologically significant. As you can see on the chart, $12.00 has acted as somewhat of an inflection point through the first three months of the year. On top of that, you also have two major moving averages (the 20 and 50 day) coming in there. The 20 day appears to be nearing a crossover of the 50-day moving average which is often looked at as a bullish signal by technicians.
The big hurdle for the Bulls to overcome comes in from 1225-1232. If the Bulls can achieve consecutive closes above this pocket we could see that spur prices higher with the next upside objective being the 100-day moving average. Above that, and there’s the potential to fill the gap from January 2nd, which comes in from 1305 ¼-1311 ¾.
Check out CME Group real-time data plans available on TradingView here: www.tradingview.com
Disclaimers:
CME Real-time Market Data help identify trading set-ups and express my market views. If you have futures in your trading portfolio, you can check out on CME Group data plans available that suit your trading needs www.tradingview.com
*Trade ideas cited above are for illustration only, as an integral part of a case study to demonstrate the fundamental concepts in risk management under the market scenarios being discussed. They shall not be construed as investment recommendations or advice. Nor are they used to promote any specific products, or services.
Futures trading involves substantial risk of loss and may not be suitable for all investors. Trading advice is based on information taken from trade and statistical services and other sources Blue Line Futures, LLC believes are reliable. We do not guarantee that such information is accurate or complete and it should not be relied upon as such. Trading advice reflects our good faith judgment at a specific time and is subject to change without notice. There is no guarantee that the advice we give will result in profitable trades. All trading decisions will be made by the account holder. Past performance is not necessarily indicative of future results.

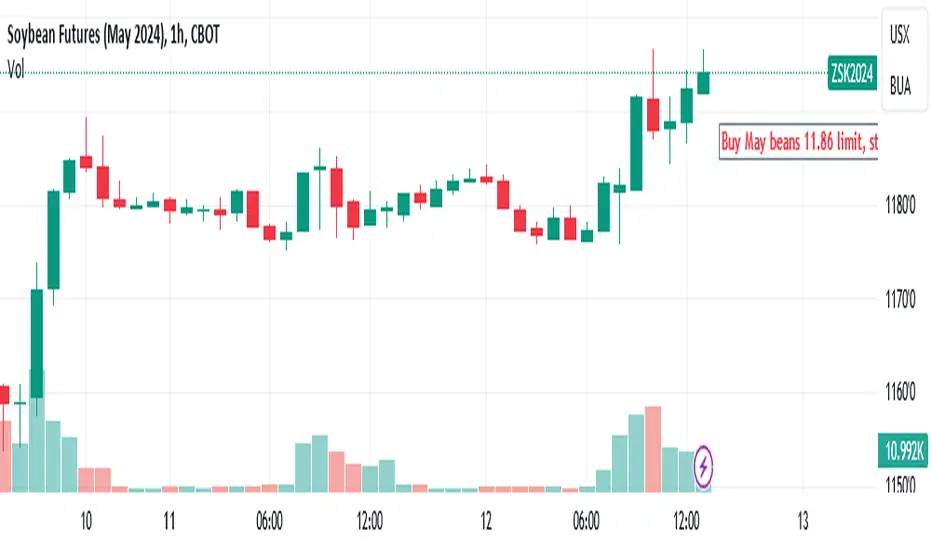
Buy May beans 11.86 limit, stop at: 11.63, tgt 12.42May Soybeans are rallying on short covering. We will try to catch a ride. Buy May beans 11.86 limit, stop at: 11.63, tgt 12.42
SOYBEANS Excellent buy opportunity.Soybeans (ZS1!) has been trading within a Channel Down pattern since early 2023 just last week, it almost hit its bottom (Lower Lows trend-line). So far the price has reacted with a minor rebound, while the 1D RSI has been on a major Bullish Divergence (Higher Lows against the price's Lower Lows).
This is the best buy signal since the May 31 2023 bottom where again after an RSI Bullish Divergence, the price rebounded aggressively to the 0.618 Fib on a +12.56% rally. So far within this long-term Channel Down, we have had similar rebounds of +12.56%, +14.26% and +11.86%.
Assuming the minimum of +11.86%, we are setting a Target on Soybeans at 1263'5, which may almost make contact with the 1D MA200 (orange trend-line), which has been the natural technical Resistance since April 24 2023.
-------------------------------------------------------------------------------
** Please LIKE 👍, FOLLOW ✅, SHARE 🙌 and COMMENT ✍ if you enjoy this idea! Also share your ideas and charts in the comments section below! This is best way to keep it relevant, support us, keep the content here free and allow the idea to reach as many people as possible. **
-------------------------------------------------------------------------------
💸💸💸💸💸💸
👇 👇 👇 👇 👇 👇

LET'S PLAY A GAME... (FRACTALS)Hi everyone... a quick take on Soybeans Futures
The current composite stock market sentiment is widely accepted to be a repeated cycle from the past. Some markets are leading within the cycle, others are lagging, yet, all are in a continuous band..... And now, SOYBEANS
This is the DJIA structure between November 1903 to February 1915, a 11.3 year cycle.
The bottoming section is the trend between July 1910 and July 1914. The stock market closed in July 1914 into world war 1 and reopened in December 1914. The actual bottom is disputed between the July 1914 closing low and February 1915 low
The current cycle commenced on 13/05/2019, the bottoming section is the trend from 18th July 2022 to the XXX ending date and holds striking similarities.
Current ZS
DJIA Fractal
There are a total of 4 bottoms completing the bottoming cycle
The 4 bottoms are synchronized in Solar harmony (in month)
Here is how the harmony looks on solar time scale
The month of the cycle lows are well aligned within a variation of 2 weeks using the weekly candle, with July being the approximate cycle month.
For the 1903 - 1915 cycle, the entire duration was 589 weeks or 135.5 months. The bottoming cycle took 1673 calendar days. 1673 is one week less the harmonic cycle of 1680 days.
The current fractal has an origin point on 13/05/2019, if we use the February 1915 low as the marker then the duration of the current fractal will be 1750 days or 250 weeks ending on 26/02/2024. The bottoming section will then take 588 days or 84 weeks
Notice that 588 occurs twice in both cycles in weeks for the 11.3 year cycle(589 weeks) and days (588 days) in the current fractal. This also is 84 weeks in current fractal and 135.5 months in the 1903/1915 pattern
(84 * 1.618) = 135.91 units
Now the entire structure of the current cycle is clear, the low at 13/05/2019 was 791.0.
The high within the cycle is 1784.0
Total price advance = (1784 - 791) = 993 units
Entire expected duration = 1750 days
Bottoming cycle duration = 588 days
In a previous post we projected the 1008 points advance and squared out using 1008 trading days. The time of the first high was 1016 days, price at second high is +993 points.
Notice that 993 points is 1008 units less 15 points.
15 units is equivalent to 2 weeks on the weekly chart or two candles
Our next projection then puts the structure as a golden rectangle 1.618 with price and time.
The price at 1170 is the current 0.618 correction/active bottom
Putting it all together, this is the phase to expect after the cycle is complete
We have a timeline for the long bets, we can also make projections into the extent of the next expansion
Check back, stay safe
Good luck

Descending Wedge & Bullish Divergence on March SoybeansFundamental Outlook:
There’s no beating around the bush - the fundamental outlook for soybeans is bearish. Global ending stocks are now at all time highs per the last WASDE report, and export demand for U.S. soybeans has slowed considerably - currently down around 19% year-over-year. As South American harvest progresses, the outlook of the Brazilian soybean crop has also improved.
Talking Technicals:
Despite the bearish fundamental outlook - the descending wedge, bullish divergence on 14-day RSI, and declining volume profile presents a bullish setup. Managed money funds remain aggressively short - holding a net-short position greater than 150,000 contracts across futures and options on soybeans. An upside breakout could result in short-covering, ultimately propelling prices higher in the near-term. Descending wedge patterns typically see sharp, upside breakouts which would be akin to the price action observed in a short-covering rally.
Check out CME Group real-time data plans available on TradingView here: www.tradingview.com
Disclaimers:
CME Real-time Market Data help identify trading set-ups and express my market views. If you have futures in your trading portfolio, you can check out on CME Group data plans available that suit your trading needs www.tradingview.com
*Trade ideas cited above are for illustration only, as an integral part of a case study to demonstrate the fundamental concepts in risk management under the market scenarios being discussed. They shall not be construed as investment recommendations or advice. Nor are they used to promote any specific products, or services.
Futures trading involves substantial risk of loss and may not be suitable for all investors. Trading advice is based on information taken from trade and statistical services and other sources Blue Line Futures, LLC believes are reliable. We do not guarantee that such information is accurate or complete and it should not be relied upon as such. Trading advice reflects our good faith judgment at a specific time and is subject to change without notice. There is no guarantee that the advice we give will result in profitable trades. All trading decisions will be made by the account holder. Past performance is not necessarily indicative of future results.

1st Short Target on Soybeans reached2nd target the 1:1 extension
re-entry on any FVG
1st Short Target on Soybeans reached

sell march beans market on opensell march beans market on open stop 13.08, tgt 12.18
Based on R/S level

Sell march bean oil 49.11 stop 51.94Sell march bean oil 49.11 stop 51.94
good entry to join the downtrend

Where is the bottom for soybeans? Soybean futures are off to a rough start in 2024. In the first week of trading, March soybeans were down nearly 42 cents on the back of beneficial rains sweeping Central Brazil. Selling pressure permeated into Monday’s session as well, with soybeans trading down into the mid 1230’s. So, the question now becomes, will March soybeans make new contract lows?
Fundamental Snapshot :
Monday’s lower price action is not all that surprising considering U.S. export inspections for soybeans were reported at 675k metric tons - below average trade estimates. Meanwhile, Brazil has been exporting both corn and soybeans at record paces each of the past two years, and is expected to have a record or near-record soybean crop this year as well. Wednesday, CONAB will release data pertaining to their estimations of corn and soybeans. Currently, they are less optimistic about the state of the Brazilian soybean crop than the USDA, and USDA will release their World Agricultural Supply and Demand Expectations report on Friday. If we see sweeping downward adjustments to production estimates from both CONAB and USDA, it may help soybeans find a bottom. However, if the market is disappointed in the data released this week, we may see soybeans test 1200 sooner rather than later.
Technical Outlook :
After last week’s precipitous drop, it was surprising that March beans failed to enter oversold territory. However, it did not take long to break into OS territory on Monday’s session. The head-and-shoulders pattern that’s developed over the past fiscal quarter has a difference of approximately $1.20/bu, which puts an operative price target between 1198 and 1208. That also happens to be the 78.6% retracement level between the mid-June lows and late-July highs. Markets can stay in overbought/oversold territory for extended periods of time, so if data disappoints this week, we may see the head-and-shoulders reach its price target. However, a positive reception to fundamental data this week may serve as a launching pad for soybeans to start moving higher.
Check out CME Group real-time data plans available on TradingView here: www.tradingview.com
Disclaimers:
CME Real-time Market Data help identify trading set-ups and express my market views. If you have futures in your trading portfolio, you can check out on CME Group data plans available that suit your trading needs www.tradingview.com
*Trade ideas cited above are for illustration only, as an integral part of a case study to demonstrate the fundamental concepts in risk management under the market scenarios being discussed. They shall not be construed as investment recommendations or advice. Nor are they used to promote any specific products, or services.
Futures trading involves substantial risk of loss and may not be suitable for all investors. Trading advice is based on information taken from trade and statistical services and other sources Blue Line Futures, LLC believes are reliable. We do not guarantee that such information is accurate or complete and it should not be relied upon as such. Trading advice reflects our good faith judgment at a specific time and is subject to change without notice. There is no guarantee that the advice we give will result in profitable trades. All trading decisions will be made by the account holder. Past performance is not necessarily indicative of future results.

Micro Crude WinnerTrendCloud signal on Micro Crude Oil worked out great today.
Hit our targets on Crude and also Corn.
TrendCloud Scanner picked up on both of them this morning.
15 min trend and 1 hour CCI momentum were both down.
This gave us a 5 min TrendCloud signal that hit our targets for profit taking as we scaled out of the position.

Soybean Futures almost formed a bullish pattern; 1550 then 1770Weekly chart, Soybean Futures almost formed a bullish chart pattern - Descending Wedge.
After crossing resistance 2 line and line 1, the target will be 1550 then 1770
The other side probability is activated by breaking down support line 1.
However, support line 2 can be a strong barrier and force a price rebounding.

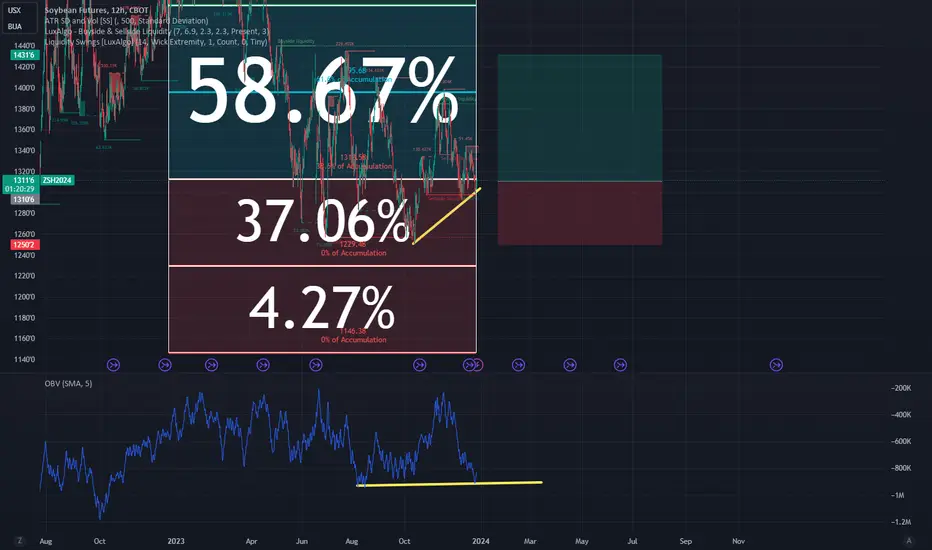
Bullish on Soybean FuturesIn the Soybean futures market, a stabilization trend is evident. Several indicators suggest that this bottoming process appears to be sustainable.
When considering the price in relation to standard deviations, it becomes apparent that the current price is within the range of its mean.
Given the presence of a concealed yet distinctly bullish On-Balance Volume (OBV) divergence, there is a reasonable expectation that the Soybean futures will soon ascend to the 1430 level, coinciding with a Buyside Liquidity zone.
For these reasons, we maintain a bullish outlook on Soybean futures.
The outlined trade idea is presented as a suggestion for a specific trade with a Risk-Reward Ratio (RRR) exceeding 2.0:1.
🌱 Soybean Update 🆕Fundamental Data👇
🌱Soybean Marketing Year Progress (23/24)
▓▓▓▓░░░░░░░░░░░ 27.62%
Export Inspections 🚢➡️🌎
1,108,864 Metric Tons
⬇️ 464,425 Metric Tons week vs. last week
⬇️ 1,120,580 Metric Tons this week vs. this week last year
⬇️ 800,246 Metric Tons this week vs. 5-Year Average This Week
Export Sales🗺️🫰
32,399,826 Metric Tons (Cumulative, Current Marketing Year)
⬇️ 4,898,256 Metric Tons this week vs. this week last year
Price Sentiment (Community Polling)📊
Bullish 🟩🟩🟩⬜️⬜️⬜️⬜️⬜️⬜️⬜️ 24%
Neutral 🟫🟫🟫⬜️⬜️⬜️⬜️⬜️⬜️⬜️ 27%
Bearish 🟥🟥🟥🟥🟥⬜️⬜️⬜️⬜️⬜️ 44%
Fund Net Position💰
Chicago Soybeans: +36,633 Contracts (Position as of 12/05)
Funds have been reducing their net long position 3 weeks in a row
Noteworthy News / Trends 🆕
🔴 Funds have been reducing their net long position, 3 weeks in a row
🔴/🟢 Export interest for US Soybeans is considerably weak in comparison to previous marketing years, but has improved recently
🔴 The spread between January-March futures continues to show weakness (carry is not bullish)
🟢 Brazilian Soybean production decreased to 161 MMT (USDA) and 160.177 MMT (CONAB)
Commentary & Technicals💹
*None this week*
Watch the following levels 👇
🟢 Upside Targets: 13.51, 13.89, 13.98
🔴 Downside Targets: 12.92, 12.705, 12.66
Investment Risk Disclaimer⚠️
This information is provided for informational and educational purposes only and is not intended to constitute investment, financial, legal, tax or accounting advice. The views expressed are those of the author and do not necessarily represent the opinions or advice of our firm. Futures, options, and over-the-counter derivatives involve a high degree of risk and may not be suitable for all investors. Past performance is not indicative of future results.
Investments or strategies mentioned herein may not be suitable for you. The information contained herein does not take into account the particular investment objectives, financial situations, or needs of individual users. Before making any investment decision, you should perform due diligence and consider seeking advice from an independent financial or investment advisor.
All investments involve risk, including the possible loss of principal. You should therefore carefully consider whether such trading is suitable for you in light of your financial condition. We do not guarantee any outcomes regarding your use of the information provided.

Solid Brazilian Rains Dampen Soybean PricesSoybean prices have been on a rollercoaster fuelled by turbulence over the last month amid elevated weather concerns, changing production yields, and geopolitical upheavals affecting prices. Winters are vital for bean traders. This paper delves into the various forces at play to guide traders and portfolio managers to navigate through the rough weather.
Favourable weather combined tail winds for Soybean harvests plus weakness in destination markets are setting the ground for bearishness in bean prices. A short position in CME Soybean futures can be used to manage risk.
US SOYBEAN HARVEST RESULTS
Soybean harvest in the US has concluded providing a more certain supply outlook for the ongoing marketing year. Next Soybean harvest will take place in March-June in South America. Until then, current inventories will have to meet the demand.
As per USDA update , Soy harvesting in the US is 90% complete. Yields for the 2023/2024 marketing year were updated to 49.9 bushels/acre in the November WASDE report compared to 49.6 bushels/acre in the October report.
This resulted in an upward revision to the production and ending stocks figures as well since the consumption forecast remained unchanged. A similar update was reported by USDA in the global soybean outlook which suggested that global soybean production would be marginally higher.
Despite the upward revisions, the US production figures represent a YoY decline of 4 million MT (-3.3%). The upward revision then, provides a larger buffer to account for potentially higher consumption.
This is vital because bean inventory balances in the US this year are tighter than the previous two years. US Ending stocks are forecast to be 6.68 million MT compared to 7.3 million MT last year.
As a result, although the upward revision expanded the buffer, it is quite narrow which could exacerbate a shortage in case consumption edges higher.
SEASONAL TRENDS
As highlighted by Mint in a previous paper , seasonal trends in Soybean futures are affected by harvest. During harvest, prices decline before recovering post-harvest as inventories are depleted. However, the seasonal trend is distinct during El Niño years where returns underperform the usual average, especially in December-January.
BRAZIL WEATHER CONCERNS LIFTED
Soybean markets are heavily influenced by weather in Brazil. Hotter than expected weather and erratic precipitation raised concerns for Brazilian crops which drove Soybean prices higher over the past month.
Brazil experienced a strong heat wave last month which has a negative effect on crops. Weather effects on crop yields are most pronounced during the early stages of growth.
However, weather is now set to improve as weather forecasts suggest the arrival of rains and milder temperatures ahead. Both are positive for the bean crop.
Still, higher-than-expected precipitation remains a concern for the crop. As highlighted by University of Delaware , too much rainfall during the planting stage can lead to significant yield reduction.
Source: USDA
Brazil is the largest producer of Soybean and its harvest had been expanding rapidly over the past three years. This had previously led to oversupply concerns in global markets, exacerbated by a low demand environment in the largest soybean consumer China.
Though consumption in China is forecast to increase YoY, it will not be enough to match the increase in global production (especially in Brazil) per the latest WASDE estimates . Net effect is larger ending stocks globally which is bearish for Soybean prices.
EL NIÑO UPDATE
In this El Niño year, unexpected weather pose significant concerns as it deviates from the anticipated impact on soybean crops outlined in our previous paper . While El Niño typically brings favourable conditions, such as increased rainfall and mild weather leading to a 3.5% higher soybean yield on average.
Brazil is experiencing unexpectedly warm weather and low precipitation, diverging from the usual patterns. The unpredictability of these conditions amplifies their potential impact on prices compared to previously expected El Niño effects.
Source - NOAA
El Niño continues to evolve adversely as Oceanic Niño Index (ONI) has reached its highest level since 2016. Sea Surface Temperatures (SST) at Niño 3.4 is another indicator that has reached an all-time-high.
Source - NOAA
SIGNAL FROM SOYBEAN FUTURES MARKET
Technical signals suggest a bearish trend in bean futures. Front month bean contract was on an upward trend since mid-October. The front month contract tested but failed to pass a key pivot resistance level of 1,381 USc/bushel. Price has since declined 5% and points to a reversal as the Moving Averages close to forming a bearish crossover.
Asset managers switched from net short to net long positioning over the past month. However, over the last 2 weeks, asset managers have reduced net long positioning by 20k contracts.
Options markets point to bearishness as participants are positioned for Soybean price to decline with a P/C ratio of 1.31 which suggests more bearish bets than bullish ones.
Further, bearish bets have increased sharply over the past week with the largest increase in puts on the April monthly contract and December monthly contract. Moreover, participants have reduced call OI on the front-month December contract.
HYPOTHETICAL TRADE SETUP
With the overhang of negative weather in Brazil lifted, bean prices are likely to decline and pare gains from the past month due to a weak demand environment. Market metrics also suggest a bearish trend. To gain exposure, investors can deploy a short position on Soybean futures expiring in Feb ( ZSH2024 ).
CME Soybean futures expiring in March require a maintenance margin of USD 2,800 (as of December 4th) and provide exposure to 5000 bushels.
Entry: USc 1,336
Target: USc 1,272.25
Stop Loss: USc 1,381
Profit at Target: USD 3,187
Loss at Stop: USD 2,250
Reward/Risk: 1.42x
MARKET DATA
CME Real-time Market Data helps identify trading set-ups and express market views better. If you have futures in your trading portfolio, you can check out on CME Group data plans available that suit your trading needs www.tradingview.com
DISCLAIMER
This case study is for educational purposes only and does not constitute investment recommendations or advice. Nor are they used to promote any specific products, or services.
Trading or investment ideas cited here are for illustration only, as an integral part of a case study to demonstrate the fundamental concepts in risk management or trading under the market scenarios being discussed. Please read the FULL DISCLAIMER the link to which is provided in our profile description.

Soybean Update 🌱Fundamental Data👇
🌱Soybean Marketing Year Progress (23/24)
▓▓▓▓░░░░░░░░░░░ 23.76%
Export Inspections 🚢➡️🌎
1,609,413 Metric Tons
⬇️ 330,666 Metric Tons week vs. last week
⬇️ 420,260 Metric Tons this week vs. last week
⬇️ 319,437 Metric Tons this week vs. 5-Year Average This Week
Export Sales🗺️🫰
29,054,927 Metric Tons (Cumulative, Current Marketing Year)
⬇️ 6,928,917 Metric Tons this week vs. this week last year
Price Sentiment (Community Polling)📊
Bullish 🟩🟩🟩🟩🟩⬜️⬜️⬜️⬜️⬜️ 47%
Neutral 🟫🟫⬜️⬜️⬜️⬜️⬜️⬜️⬜️⬜️ 18%
Bearish 🟥🟥🟥⬜️⬜️⬜️⬜️⬜️⬜️⬜️ 24%
Fund Net Position💰
Chicago Soybeans: +87,913 Contracts (Position as of 11/14)
Funds have been adding to their net position 5 weeks in a row
(Fund position will be updated on 11/27 due to Thanksgiving holiday)
Noteworthy News / Trends 🆕
🔴 Brazilian production is still seen at a record +160 million metric tons, according to analysts
🔴 Import interest into China (from US) is considerably weak, even when considering recent China purchases (+ Unknown)
🔴 The spread between January-March futures continues to widen (carry is not bullish)
🟢 5-day precipitation is mixed for Brazil - rains in the forecast in the southern states, but lack of rain in the northern growing regions
🟢/🔴 Logistics at the ports of Brazil are mounting (congestion). For US Logistics the constraint appears to be the Panama Canal which has announced a reduction of the number of ships that will be able to transit through the canal daily from 24 currently to 18 in February 2024.
Fund Net Position💰
Chicago Soybeans: +87,913 Contracts (Position as of 11/14)
Funds have been adding to their net position 5 weeks in a row
(Fund position will be updated on 11/27 due to Thanksgiving holiday)
Commentary & Technicals💹
Not much to add that has not been explained already.
Watch the following levels 👇
🟢 Upside Targets: 13.78, 13.89, 13.98
🔴 Downside Targets: 13.27, 13.15, 13.00
Investment Risk Disclaimer⚠️
This information is provided for informational and educational purposes only and is not intended to constitute investment, financial, legal, tax or accounting advice. The views expressed are those of the author and do not necessarily represent the opinions or advice of our firm. Futures, options, and over-the-counter derivatives involve a high degree of risk and may not be suitable for all investors. Past performance is not indicative of future results.
Investments or strategies mentioned herein may not be suitable for you. The information contained herein does not take into account the particular investment objectives, financial situations, or needs of individual users. Before making any investment decision, you should perform due diligence and consider seeking advice from an independent financial or investment advisor.
All investments involve risk, including the possible loss of principal. You should therefore carefully consider whether such trading is suitable for you in light of your financial condition. We do not guarantee any outcomes regarding your use of the information provided.

🌱 Soybeans - 🔥Brazil and Argentina 💵Fundamental Data👇
🌱Soybean Marketing Year Progress (23/24)
▓▓▓░░░░░░░░░░░░ 21.77%
Soybean Harvest Progress 🚜➡️🌱
▓▓▓▓▓▓▓▓▓▓▓▓▓▓░ 95%
Export Inspections 🚢➡️🌎
1,666,467 Metric Tons
⬇️ 516,368 Metric Tons week vs. last week
⬇️ 941,965 Metric Tons this week vs. last week
⬇️ 549,183 Metric Tons this week vs. 5-Year Average This Week
Export Sales🗺️🫰
28,159,427 Metric Tons (Cumulative, Current Marketing Year)
⬇️ 4,933,183 Metric Tons this week vs. this week last year
Price Sentiment (Community Polling)📊
Bullish 🟩🟩🟩🟩🟩🟩⬜️⬜️⬜️⬜️ 52%
Neutral 🟫🟫🟫⬜️⬜️⬜️⬜️⬜️⬜️⬜️ 28%
Bearish 🟥🟥⬜️⬜️⬜️⬜️⬜️⬜️⬜️⬜️ 13%
Noteworthy News / Trends 🆕
🟢 Brazilian Soybean crop continues to suffer through drought and heat stress conditions. Some of the crop is even being replanted as Cotton. (check our Twitter for more info)
🟢 Precipitation in Brazil is well below normal from a low of 13% of normal to a high of 70%, with most around the 30-40% range as far as November precipitation is concerned.
🟢 Funds have been adding to their net long position for five weeks in a row.
🟢 US Crush margins continue to show strength
🟢 The US had the largest weekly sales of Soybeans in +10 years
🟢/🔴 Logistics at the ports of Brazil are mounting (congestion). For US Logistics the constraint appears to be the Panama Canal which has announced a reduction of the number of ships that will be able to transit through the canal daily from 24 currently to 18 in February 2024.
🟢/🔴 It’s too early to tell what happens with the Argentine elections, but one could assume that Milei winning would be bearish Soybeans as he vows to dollarize the economy. This would pave the way for Argentine farmers to sell their grain for Dollars instead of the hyperinflated Argentine Peso. (Basically the market will not encourage hoarding of grain off the market anymore)
🟢/🔴 5 Day forecast is calling for rains in Brazil in key areas that need the rain the most. Will they hit? That’s TBD.
Fund Net Position💰
Chicago Soybeans: +87,913 Contracts (Position as of 11/14)
Funds have been adding to their net position 5 weeks in a row
Commentary & Technicals💹
All attention in the grain and oilseed markets continues to be pointing to two things in South America.
1. The ongoing heat and lack of rain in Brazil affecting Soybean production 🔥
2.The presidential race in Argentina which could structurally shift everything in the Argentine economy IF Javier Milei wins 💵
These all come at a time when the US farmer will largely remain absent completing harvest as well as taking much needed time off during Thanksgiving.
We believe then based on the above that we may experience heightened volatility and lessening liquidity as we start pricing in which portion of the matrix becomes the most probabilistic outcome (Rain/Drought, Javier Wins/Loses).
Watch the following levels 👇
🟢 Upside Targets: 13.62, 13.87, 13.98
🔴 Downside Targets: 13.36, 13.14, 13.00
Investment Risk Disclaimer⚠️
This information is provided for informational and educational purposes only and is not intended to constitute investment, financial, legal, tax or accounting advice. The views expressed are those of the author and do not necessarily represent the opinions or advice of our firm. Futures, options, and over-the-counter derivatives involve a high degree of risk and may not be suitable for all investors. Past performance is not indicative of future results.
Investments or strategies mentioned herein may not be suitable for you. The information contained herein does not take into account the particular investment objectives, financial situations, or needs of individual users. Before making any investment decision, you should perform due diligence and consider seeking advice from an independent financial or investment advisor.
All investments involve risk, including the possible loss of principal. You should therefore carefully consider whether such trading is suitable for you in light of your financial condition. We do not guarantee any outcomes regarding your use of the information provided.
