Will the sell-off in grains hold?Grains have been on a pullback since the last WASDE and we have another one coming up in a couple of weeks when stocks and demand will all be forefront in how much more prices could hold and go higher. The weekly CoT report from the CFTC showed net new buying and short covering from the soybean spec traders during the past week. That throws the the net longs for the November expiration by about 25k contracts to 120,739. Commercial hedgers added 42k new shorts amounting to about 10-12% of the overall open interest through the week taking their net short positions to 187,370 contracts.
Support now sits in a 50-odd point price band between 1295~1346 and falling to the lower edge of this support cannot be ruled out given the situation with supply and true demand. Last week, export numbers were encouraging causing some stir in prices as we squeezed higher. The downside here has more potential owing to the imbalance in longs-vs-shorts. Keep and eye on the support band and trade cautiously.
Short-term, resistance is at 1380.25 and the initial profit target for the short trade is 1340.
XK1! trade ideas

zsx23 The reason... blah, blah, blah. Remember the old bible rhyme. Oh the C. H. A. R. T, that's the thing for me. Something like that anyway.

SOYBEAN FUTURES (LONG)I am looking for a long position in Soy and the probability to go higher is high. A long position will be entered at the price given.


Soybean Prices Continue to ClimbSoybean futures prices are continuing to grind higher in the early morning trade, taking prices back towards the upper end of the recent range with more significant resistance coming in near the psychologically significant $14.00 level. We continue to believe the Bulls have the technical advantage so long as the Bulls continue to defend 1315-1320. A break and close below that pocket would neutralize our bias.
Today's USDA report is scheduled to be released at 11am CT.
The average analyst estimate for yield comes in at 51.4 bushels per acre. The average production estimate is 4.253 billion bushels.

Soybeans poised for a drop?Soybeans have certainly caught our attention as a classic head and shoulders pattern has emerged, suggesting a possible trend reversal. This implies a potential drop equivalent to the height from the head to the neckline, taking us towards the 900 level. Could this be signalling more downside in the soybean market?
The current price action is intriguing as an attempt to break the neckline was rejected and prices now hover just below the neckline. Is this the prime moment to consider a short position on soybeans? We think it's worth exploring, and here's why...
As we’ve last pointed out in the “It’s Corn!” idea in March, prices of the 3 major agriculture crops, Soybean, Wheat and Corn generally move together. Back then, we were highlighting the excessive premium in Corn futures as well as the break of a technical chart pattern. Now, we're witnessing a similar tale with Soybean stepping into the spotlight.
From 2019 until now, these three crops have jockeyed for position in terms of percentage gain. Currently, Soybean is in the lead, when compared to Wheat and Corn, in terms of % gain from pre-COVID times and the onset of the Russia-Ukraine conflict.
Another way to look at it is to compare the ratio between Soybean & Corn as well as Wheat. The Soybean/Corn ratio is now at the higher end of its 7-year range, and while the Soybean/Wheat ratio not as extreme, is still closer to its range top.
Another interesting dynamic we can look into is the Natural Gas – Fertilizers – Soybean dynamic. As natural gas is a key input in fertilisers production, the spectacular fall in natural gas prices has preceded falling fertiliser prices. This in turn, impacts soybean prices as well.
Hence, we see a potential downside for Soybean as it trades at a premium as compared to Corn & Wheat. We can consider a short position on the Soybean Futures at the current level of 1340 with a stop at 1450 and take profits at 1250 followed by a subsequent take profit level at 900. This will allow profits on the anticipated downward move while also considering the head and shoulders pattern's target. CME’s Soybean Futures is quoted in U.S. cents per bushel. Each 0.0025 increment equal to 12.5$.
The charts above were generated using CME’s Real-Time data available on TradingView. Inspirante Trading Solutions is subscribed to both TradingView Premium and CME Real-time Market Data which allows us to identify trading set-ups in real-time and express our market opinions. If you have futures in your trading portfolio, you can check out on CME Group data plans available that suit your trading needs www.tradingview.com
Disclaimer:
The contents in this Idea are intended for information purpose only and do not constitute investment recommendation or advice. Nor are they used to promote any specific products or services. They serve as an integral part of a case study to demonstrate fundamental concepts in risk management under given market scenarios. A full version of the disclaimer is available in our profile description.
Reference:
www.cmegroup.com

November Soybeans DivergenceThere is divergence between price and oscillators such as Bollinger Band %B, Accumulation/Distribution AD%, RSI, DMI, and MACD. Price has also retested a point of control level just shy of 1400’ after attempting a significant drop down to 1100’. The red circle highlights that the lower BB has curled up after an up move in price suggesting the up move in price is over. The main support is the 20-day SMA which appears to have been the reason for the most recent move up. There is room for significant downside. Natural gas prices have collapsed and there has been ample rain in the US as of late. Looking for day trade short entries and setting a stop at B/E asap is probably a good approach. Will be watching this tonight (Sunday night 6/9/23).
Additional notes:
Wheat has an epic H&S with retest of neckline
Corn is putting in new 2-year lows
wheat has a 50% drop from its peak
corn has a 40% drop from its peak
soybeans have a 25% drop from their peak (it may have some catching up to do)

Price of Soybeans Relative to CornBig inflection point! Soybeans are the most expensive relative to Corn since December 2020, but they are also hitting trend line resistance.

1D: Soybean Future...Rising wedge appears in progressAs above.
Rising wedge on the 1D chart...breakdown >>>> breakout potential. 1300-1280 possible target if turns bearish.
Good luck traders!

TOFU Futures UpdateThe Fed and ECB maintained a hawkish stance but the market pumped anyways. This is beginning to look like a bull flag on tofu futures.
The problem is, the Fed never reduced their balance sheet so there's too much money floating around. www.federalreserve.gov
Get ready for rebound inflation later this year. In fact, it may even show up in June numbers next month. The inflation battle isn't over yet, but enjoy the bull ride until the numbers come out.

A second chance?Check my previous post down below. I you missed the first one, now we have a another chance to jump in.

CBOT Soybean Complex: An IntroductionCBOT: Soybean ( CBOT:ZS1! ), Soybean Meal ( CBOT:ZM1! ), Soybean Oil ( CBOT:ZL1! )
Today, I am starting a new series on CBOT soybeans, one of the most liquid commodities contracts in the world. In March 2023, Soybean, Soybean Meal, and Soybean Oil together traded 14.0 million lots, contributing to 42.6% of CME Group agricultural futures and options volume, and 2.0% of overall Exchange monthly volume.
Soybean Market Fundamentals
Soybeans are the world’s largest source of animal protein feed and the second largest source of vegetable oil. Soybeans are the most-traded agricultural commodities, comprising more than 10% of the total value of global agriculture trade.
According to the World Agricultural Supply and Demand Estimates (WASDE), global soybean production for 2022/2023 crop year is 369.6 million metric tons. Let’s visualize this: If we were to distribute the entire crops to the world population evenly, each person would get approximately 46 kilograms of soybeans.
The U.S., Brazil and Argentina are the largest soybean producers, accounting for 80% of the global production. The U.S. is the single largest soybean producer and exporter, harvesting 4.3 billion bushels a year and exporting 47% of it, according to the WASDE.
The heart of U.S. soybean production is the Midwest. In the main part of the soybean belt, planting takes place from late April through June, with harvest beginning in late September and ending in late November.
About two thirds of the total soybean crop is processed, or crushed, into soybean oil and soybean meal. The term “crush” refers to the physical process of converting soybeans into its oil and meal byproducts.
The crush spread refers to the difference between the value of soybean meal and oil and the price of soybeans. It represents the gross processing margin from crushing soybeans.
When a bushel of soybeans weighing 60 pounds is crushed, the typical results are:
• 11 pounds of soybean oil (18%)
• 44 pounds of soybean meal (73%)
• 4 pounds of hulls (6%)
• 1 pound of waste (2%)
Soybean meal is used by feed manufacturers as a prime ingredient in high-protein animal feed for poultry and livestock. It is further processed into human foods, such as soy grits and flour, and is a key component in meat or dairy substitutes, like soymilk and tofu.
After initial processing, soybean oil is further refined and used in cooking oils, margarines, mayonnaise and salad dressings and industrial chemicals. Soybean oil may also be left unprocessed and used in the production of biodiesel fuels.
Exports are big business for U.S. soybean farmers. According to the data from U.S. Bureau of Economic Analysis, soybean exports totaled $6.9 billion in the first two months of 2023, contributing to 1.4% of all U.S. exports of goods and services. Soybean exports have increased dramatically since 2000 as the demand for meat and poultry grew in Europe and Asia, particularly in China.
CBOT Soybeans Futures and Options
Soybean futures began trading at the Chicago Board of Trade in 1932, followed by futures on its byproducts: Soybean Oil in 1946 and Soybean Meal in 1947.
Soybean (ZS) futures are physically delivered contracts based on No. 2 yellow soybeans. Each contract has a notional value of 5,000 bushels, equivalent to 136 metric tons. Soybean contracts are listed for the months of Nov., Jan., Mar., May, Jul., Aug., and Sep., projecting out about 3.5 years in the future.
You may have heard of the terms “New Crop” and “Old Crop”. The former refers to crops that have not been harvested. For soybeans, it’s Nov. contract (ZSX3), which coincides with the harvest season. For contract months May, Jul., Aug., and Sep. 2023, soybeans available for sales are from the previous crop year, hence the name “Old Crop”.
Soybean options (OZS) have a contract unit of 1 ZS futures contract. It is deliverable by the corresponding futures contract, with the last trading day set at one month prior to futures expiration month.
Soybean Meal (ZM) futures are also physically delivered contracts. Each contract has a notional value of 100 short tons, equivalent to 91 metric tons. Soybean Meal contracts are listed for the months of Jan., Mar., May., Jul., Aug., Sep., Oct., and Dec. A total of 25 contracts are listed simultaneously. Because of the use of soybean meal for animal feed, its demand is closely aligned with the livestock and poultry industry. For the export market, instead of soybean meal, buyers usually buy soybeans and process them in their home country.
Soybean Meal options (OZM) have a contract unit of 1 ZM futures contract and are deliverable by the corresponding futures contract.
Soybean Oil (ZL) futures are physically delivered contracts. Each contract has a notional value of 60,000 pounds, equivalent to 27.2 metric tons. Soybean Oil contracts are listed for the months of Jan., Mar., May., Jul., Aug., Sep., Oct., and Dec. A total of 27 contracts are listed simultaneously. While soybean oil is a leading ingredient for edible oil, oilseeds also include rapeseed, sunflower, sesame, groundnut, mustard, coconut, cotton seeds and palm oil. Whenever one of them becomes too expensive, food companies would substitute it with a cheaper ingredient. Hence, soybean oil price is highly correlated with the other oilseed products.
Use Cases for CBOT Soybeans Contracts
At every stage of the soybean production chain, from planting, growing and harvest, to exporting and processing, market participants face the risk of adverse price movements. Prices of soybean and its byproducts continuously fluctuate, largely determined by crop production cycles, weather, livestock production cycles, and ongoing shifts in global market demand.
In this section, I will illustrate how producer, storer, processor and soybean user could use CBOT soybeans futures and options to hedge market risks.
Soybean Farmer (Producer)
When a US soybean farmer plants the crops in April, he is said to have a Long Cash position. The farmer is exposed to the risk of falling soybean price during the November harvest season. To hedge the price risk, our farmer could enter a Short Futures position now, and buy back and offset the futures when he is ready to sell the crops.
Since the cash market and futures market are highly correlated, loss or gain in the cash market will be largely offset by the gain or loss in the futures market. The farmer is left with basis risk, which is adverse changes of the cash-futures spread. It is usually much smaller than the outright price risk. In the context of futures trading, notably commodities, basis refers to the difference between the spot (cash) price of a commodity and the price of a futures contract for that same commodity.
Grain Elevator (Storer)
After the crop is harvested, farmer or merchandiser would usually store the soybeans in a grain elevator and wait for the right time and price to sell. Soybeans could be stored for a year but would incur monthly storage costs. The decision to store depends on whether expected future price gains outweigh the storage costs.
The merchandizer is exposed to the risk of falling soybean price, which would cause his soybean inventory (old crop) to decline in value. To hedge the price risks, he could establish a Short Futures position for the expected period of storage and buy it back when he is ready to sell.
Oilseed Processor
For soybean processing mill, crush spread represents the gross processing margin from crushing soybeans. It is exposed to the risk of rising soybean price where meal and oil prices fail to catch up.
Soybeans trade in bushels, soybean meal trades in short tons and soybean oil trades in pounds. The prices of the three commodities need to be converted to a common unit for an accurate calculation. A bushel of soybeans produces about 44 pounds of soybean meal. Since Soybean Meal futures are priced per ton, multiplying the meal price by 0.022 represents the meal price per 44 pounds. That same bushel of soybeans also produces 11 pounds of soybean oil. Since Soybean Oil futures are priced per pound, multiplying the soybean oil price by 0.11 represents the oil price per 11 pounds. (www.cmegroup.com)
Processor could lock in the crush margin by a crush spread trade. To ease the difficulty of constructing and executing the spread, CME Group facilitates the board crush that consists of a total of 30 contracts; 10 Soybean, 11 Soybean Meal, and 9 Soybean Oil.
Livestock Farmer (User)
Large-scale farms usually buy corn, soybean meal and other ingredients to produce their own feed. Farmers are exposed to the risk of rising ingredient costs. They could hedge the price risk by establishing long positions in CBOT corn and soybean meal futures.
For hog farmers, gross production profit is represented by the Hog Crush Margin. It is defined by the value of lean hog (LH) less the cost of weaned pig (WP), corn (C) and soybean meal (SBM). In the futures market, traders could replicate the economic hog crush margin with a Hog Feeding Spread involving CME lean hog (HE), CBOT Corn (ZC) and CBOT Soybean Meal (ZM). There is no futures contract for weaned pig (piglet).
If you expect hog margin to grow, Long the feeding spread: Buy lean hog, sell corn and soybean meal. For a shrinking margin, Short the spread: Sell hog, buy corn and meal.
This concludes Part 1 of our introduction to CBOT Soybean complex. In Part 2, I plan to discuss major reports that move the soybean markets:
• World Agricultural Supply and Demand Estimates (WASDE)
• USDA Prospective Plantings Report
• USDA Grain Stocks Report
• CFTC Commitment of Traders Report
Happy Trading.
(To be continued)
Disclaimers
*Trade ideas cited above are for illustration only, as an integral part of a case study to demonstrate the fundamental concepts in risk management under the market scenarios being discussed. They shall not be construed as investment recommendations or advice. Nor are they used to promote any specific products, or services.
CME Real-time Market Data help identify trading set-ups and express my market views. If you have futures in your trading portfolio, you can check out on CME Group data plans available that suit your trading needs www.tradingview.com

Heavy Exports Weighing Down SoybeansSoybean is among the world’s most traded crop. It is used in various industries. Soybean drives global food prices. It can tilt trade balances of an entire nation.
This paper describes the importance of Soybean. It lists key producers, consumer and maps the harvesting cycle across the calendar by top producing countries.
Given rising Brazilian exports, higher US planting, and asset manager’s positioning, this paper articulates a case study for a short position in CME Soybeans Futures delivering a 1.3x reward to risk with entry at USc 1,452.5/bushel and target of USc 1,350/bushel hedged by a stop at USc 1,530/bushel.
SOYBEAN IS THE WORLD’S MOST TRADED GRAIN
Soybean is high in protein. Hence, it is a key component of livestock feed for meat & dairy production. Rising consumption of the latter two continues to push Soybeans demand.
Two-thirds of Soybean is used for crushing into oil and meal. Soybean oil is among the most widely used vegetable oils. It is also used as biodiesel.
The two American continents form 80% of global production. Brazil (42%) and the US (31%) are the two largest producers of Soybeans. Argentina is a distant third (7%).
China drives demand. It is the largest importer of Soybeans. It comprises 60% of global imports. Soybeans is
used to feed China’s massive livestock.
Soybean prices are cyclical and prone to price shocks.
HARVESTING CYCLE, WEATHER & TRADE POLICY HUGELY INFLUENCES PRICES
Prices vary through the year. It is lowest at harvest. Increases during the year with rising inventory holding costs.
Harvest seasons are spread differently across North & South America. US harvest is from September to November. While the Brazil & Argentina harvest from March until June.
Not surprisingly, Brazilian and US harvest has an enormous impact on Soybean prices. Actual production deviating from expectations in these two majors can send prices surging or tumbling.
Soybean prices since 2015 is visualised below. Prices have structurally moved up. Prices have surged driven by robust demand since 2020.
Soybean prices on average have ranged 14% from its lowest to the highest over the last eight years with large price gyrations in 2016 and 2020.
Price behaviour during and post-harvest since 2015 is visually described in the heatmap below. All things being equal, Soybean prices trend lower during harvesting followed by price recovery post-harvest.
However, each year presents idiosyncratic conditions related to weather, trade policy, yield and output, causing price fluctuation.
Beyond the harvest cycle, climate has a significant impact. North and South America is heavily affected by El Niño-Southern Oscillation which is a natural climate pattern causing hotter/dryer climate every three to seven years. El- Niño also elevates the chances of droughts and floods.
Demand for Soybean Oil is also impacted by supply and demand of other vegetable oils like Palm Oil due to substitution effect.
Global trade policy has a considerable influence too. Trade restrictions can disrupt global supply-demand balance, resulting in increased volatility.
HIGHER PLANTING IN US, RISING BRAZILIAN EXPORTS, AND FALLING YIELDS IN ARGENTINA
USA : In its recent Market Outlook, the USDA reported that US farmers were planning to plant marginally higher than last year but below market expectations. As per National Oilseed Processors Association (NOPA), soybean crushing spiked to a 15-month high and the second highest level for any month on record in March. The crushing pace jumped as processors bounce back from maintenance related downtime.
Brazil : Soybean exports from Brazil surged 42.5% YoY during the first half of April. Bean prices have trended lower on larger than expected supply.
Argentina : USDA reduced its forecast of Argentina’s soybean crop to twenty-seven million metric tons down from thirty-three million metric tons last month.
Argentina’s soybean yields sunk to historical lows last week as per Buenos Aires Grains Exchange’s (BAGE) weekly report. BAGE warned that its projection, currently at twenty-five million metric tons, could be reduced if yield remains suppressed.
COMMITMENT OF TRADERS REPORT
Two-thirds of soybean crop is crushed into oil and meal. The crush spread, also sometimes referred to as simply the crush, refers to the difference between the value of soybean meal and oil and the price of soybeans. The “crush” is gross processing margin from crushing soybeans.
As such, these three products are deeply intertwined.
Asset managers have reduced net longs in all three contracts since the start of 2023. Intriguingly, asset managers have reduced net longs much more sharply for Oil and Meal relative to Soybeans.
TRADE SET UP
Four key drivers at play. First, rising supply from Brazil. Second, higher planting by US farmers. Third, bearish asset manager positioning. Finally, first three offset by marginal impact of lower yields in Argentina.
In forming a holistic view, this paper posits a short position in CME Soybeans July contract. Each lot provides exposure to 5,000 bushels (~136 tons).
Prices are quoted in U.S. cents per bushel. Minimum price fluctuation (tick) is one-fourth of one-cent. Therefore, every tick represents a change of USD 12.50 per lot.
● Entry: USc 1,452.5
● Target: USc 1,350
● Stop: USc 1,530
● Profit at target: USD 5,125
● Loss at stop: USD 3,875
● Reward-to-risk: 1.3x
MARKET DATA
CME Real-time Market Data helps identify trading set-ups and express market views better. If you have futures in your trading portfolio, you can check out on CME Group data plans available that suit your trading needs www.tradingview.com
DISCLAIMER
This case study is for educational purposes only and does not constitute investment recommendations or advice. Nor are they used to promote any specific products, or services.
Trading or investment ideas cited here are for illustration only, as an integral part of a case study to demonstrate the fundamental concepts in risk management or trading under the market scenarios being discussed. Please read the FULL DISCLAIMER the link to which is provided in our profile description.

SOYBEAN FUTURES Weekly Technical AnalysisZS1! Weekly - No RECOMMENDATION or ADVICE Status / EDUCATIONAL only - Support, Resistance, Trend Lines, Cluster, Confluence, Parallel Channels, Pitchfork, Fibonacci Extension - Hope it Helps, Good Luck
DISCLAIMER - This communication is not trading or investment advice, recommendation or solicitation to buy, sell or hold any investment product is provided for informational, educational and research purposes only. All illustrations, forecasts or hypothetical data are for illustrative purposes only. The author or persons involved in the conception, production and distribution of this material cannot be held responsible for transactions or any financial loss or damages resulting directly or indirectly from the use or application of any concepts or information contained in or derived from this material. Past performance is not indicative of future results. Any person who chooses to use this information as a basis for their trading assumes all the liability and risk for themselves.

Tofu FuturesAs always, when the market pumps the stock market, they also pump commodities.
The commodity pump won't show up in PCE or CPI numbers until at least a month from now, so don't get too bearish too soon. We'll get the ES1! and NQ1! gap fill first.
I see no rate hike in May then we get rebound inflation because of the market pump so another hike in July. That's my guess for now. the Fed can't let the market go parabolic again because these idiots keep pumping commodities with the stock market.
I'm pretty sure the bond traders are wrong as far as their rate cut projection, I think even the Fed Dot Plot is underestimating peak interest rate, but you gotta go with the market direction for now. Bullish on the market for next week.

Tofu FuturesBanks might be toast but the Fed isn't done until tofu comes crashing down in a H&S pattern. If they don't raise rates next week, everything pops back up.
My guess at this point is .25% because the Fed is usually more hawkish than ECB, so I doubt the Simple Jack Powell keeps rates the same. I doubt he does .5% though, that would absolutely tank the market. Of course that is what he needs to do, but he won't do it because he's the Village Idiot. the ECB apparently is now willing to do it though.

This is itNo much to say. This is going down very fast. Price is breaking down the falling wedge, and it has a lot of resistance above. Yo can short the ETF SOYB if the futures are too expensive.

Nasdaq(NQ) and Soybean Oil/Meal had a nice inside day long setupnow price is above daily 18 moving average and its time to set stop below prior days low.
as you can see from backtest the strategy to go long above an inside day is very profitable...
Chiron in my 2nd house.There are cycles and trends to everything... a price chart is just a recording of this. There is nothing new in the market, there can't be, human nature does not change. Study past patterns, try to figure out where we are with-in that pattern. Plan, implement, monitor and adjust. It's simple, just not easy. Most things are completely obvious once you learn to see. The first step is for you to look. Refer to notes with-in the chart.

Soybean Futures ( ZS1! ), H4 Potential for Bearish DropTitle: Soybean Futures ( ZS1! ), H4 Potential for Bearish Drop
Type: Bearish Drop
Resistance: 1535.00
Pivot: 1514.00
Support: 1490.75
Preferred case: Looking at the H4 chart, my overall bias for ZS1! is bearish due to the current price being under the Ichimoku cloud , indicating a bearish market. If this bearish momentum continues, expect price to possibly drop from the pivot at 1514.00, where the 23.6% Fibonacci line is before continue heading towards the support at 1490.75, slightly below where the -27.2% Fibonacci expansion line is.
Alternative scenario: Price may head back up to retest the resistance at 1535.00, where the 61.8% Fibonacci line is.
Fundamentals: There are no major news.

Soybean Futures ( ZS1! ), H4 Potential for Bearish DropTitle: Soybean Futures ( ZS1! ), H4 Potential for Bearish Drop
Type: Bearish Drop
Resistance: 1535.00
Pivot: 1514.00
Support: 1490.75
Preferred case: Looking at the H4 chart, my overall bias for ZS1! is bearish due to the current price being under the Ichimoku cloud, indicating a bearish market. If this bearish momentum continues, expect price to possibly drop from the pivot at 1514.00, where the 23.6% Fibonacci line is before continue heading towards the support at 1490.75, slightly below where the -27.2% Fibonacci expansion line is.
Alternative scenario: Price may head back up to retest the resistance at 1535.00, where the 61.8% Fibonacci line is.
Fundamentals: There are no major news.

The Bollinger Bands are Squeezing the Juice out of GrainsSoybean short swing trade:
The Bollinger Bands width has narrowed to 2.56% of price which is a level not seen in over a year. A new 6-month or greater low in bandwidth indicates that a volatility squeeze breakout is likely upon us. Similar volatility squeeze situations exist in wheat and corn but they both broke to the downside significantly last week. Wheat was -6.42% on the week, corn -4.21%, and soybeans lagged at -0.20%.
Soybean price reached the lower parabolic SAR which is a signal to short the volatility squeeze. The stop loss is positioned at the upper SAR for this trade. A stop above the 20-day SMA would be more conservative.
The overarching price pattern is a rising wedge with what appears to be a fake breakdown in late January. If we hold below the 20-day SMA it will roll over in 3 days.
Wheat shows a similar setup already occurred a couple weeks ago but it was a head fake to the upside. There is risk in wheat being at the recent low pivot for the 3rd time. It could moon from here like gold did after making a triple bottom. Note the gigantic head and shoulders.
Wheat:
Gold:
Note the lack of a Bollinger Band squeeze at the pre-moon triple bottom:
Corn also shows a similar setup, but there was no head fake, it just broke down out of the band squeeze.
Corn:
Soybean Crush spread:
It appears positioned for a big move in either direction. Seems likely to bounce back up in concert with a soybean drop. It’s in volatility squeeze territory as well.
Oil:
The mother of all commodities has an inverse head and shoulders continuation pattern suggesting more downside:
tldr; short soybeans

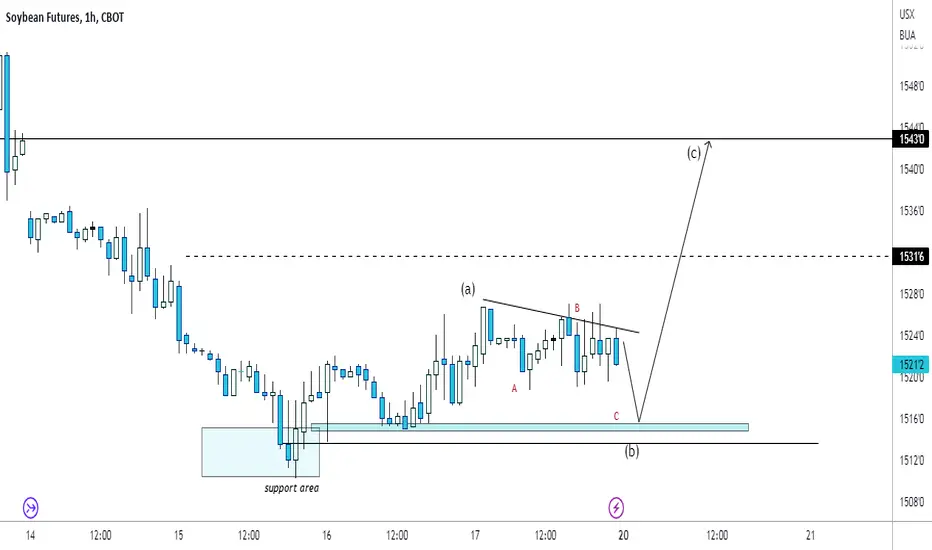
Soybean ZS1! Bullish forecastSoybean looks bearish for what looks like an ABC bearish move down to the support area for a bullish pullback up to 1531 with a bias of 1543