Soybean Futures ( ZS1! ), H4 Potential for Bullish Momentum Title: Soybean Futures ( ZS1! ), H4 Potential for Bullish Momentum
Type: Bullish Momentum
Resistance: 1484.50
Pivot: 1409.75
Support: 1431.50
Preferred case: The current bias for ZM1! on the H4 chart is bullish. To add to this bias, the price is currently trading above the Ichimoku cloud, indicating a bullish market. Overnight price had some bearish momentum, with the price currently trading at 1455.00. If the bullish momentum continues, expect price to possibly head towards the resistance at 441.4, where the previous high and 100% Fibonacci line are located.
Alternative scenario: Price may retrace downwards and head towards the 418.8 support level, where the 50% and 23.6% Fibonacci lines are located.
Fundamentals: There are no major news.
XK1! trade ideas

Soybean Futures ( ZS1! ), H4 Potential for Bullish MomentumTitle: Soybean Futures ( ZS1! ), H4 Potential for Bullish Momentum
Type: Bullish Momentum
Resistance: 1484.50
Pivot: 1409.75
Support: 1431.50
Preferred case: The current bias for ZS1! on the H4 chart is bullish . To add to this bias, the price is currently trading above the Ichimoku cloud , indicating a bullish market. If the bullish momentum continues, price may head towards the resistance at 1484.50, where the previous high and 78.6% Fibonacci line is located.
Alternative scenario: Price may retrace downwards and head towards the 1431.50 support level , where the 50% Fibonacci line is located.
Fundamentals: There are no major news.

Soybean Futures ( ZS1! ), H4 Potential for Bullish Momentum Title: Soybean Futures ( ZS1! ), H4 Potential for Bullish Momentum
Type: Bullish Momentum
Resistance: 1484.50
Pivot: 1409.75
Support: 1431.50
Preferred case: The current bias for ZS1! on the H4 chart is bullish. To add to this bias, the price is currently trading above the Ichimoku cloud, indicating a bullish market. If the bullish momentum continues, price may head towards the resistance at 1484.50, where the previous high and 78.6% Fibonacci line is located.
Alternative scenario: Price may retrace downwards and head towards the 1431.50 support level, where the 50% Fibonacci line is located.
Fundamentals: There are no major news.

Soybean Futures ( ZS1! ), H4 Potential for Bullish MomentumTitle: Soybean Futures ( ZS1! ), H4 Potential for Bullish Momentum
Type: Bullish Momentum
Resistance: 1484.50
Pivot: 1350.00
Support: 1407.75
Preferred case: On the H4 chart, the overall bias for ZS1! is bullish . To add confluence to this, price is above the Ichimoku cloud which indicates a bullish market. Overnight price had bullish momentum upwards with price currently trading at 1449.75 at time of writing. If this bullish momentum continues, expect price to head towards the resistance line at 1484.50, where the 23.6%, 78.6% Fibonacci lines and 61.8% Fibonacci projection line are located.
Alternative scenario: Price may retrace downwards towards the the support line at 1407.75, where 2 of the 38.2% Fibonacci lines are located.
Fundamentals: There are no major news.

Bottoms converge and reach a retracement area, so it is expectedBottoms converge and reach a retracement area, so it is expected that the price will drop as shown

SOYBEAN // a zone to break before shortThe market made a sharp impulse wave down in June, then it built up a countertrend. A break of this countertrend is valid already, it just thought it would go for another corrective round before... we'll see :)
All-in-all, important levels are marked on the chart, the short trigger zone is to be watched closely, and to be modified in case the countertrend remained valid, as it is now, and built another waves up.
Trade safe! ⚪️⚫️
--------------------------------------------------------------------------------
ANYWAY, a lot of Qs about the direction of the price. But it doesn't matter.
WE JUST REACT!
Remember that trading is a business.
SIZE your TRADES according to your risk aversion!
----------------------------------------------------------

Soybean Futures ( ZS1! ), H4 Potential for Bullish MomentumTitle: Soybean Futures ( ZS1! ), H4 Potential for Bullish Momentum
Type: Bullish Momentum
Resistance: 1484.50
Pivot: 1350.00
Support: 1375.75
Preferred case: The current bias for ZS1! on the H4 chart is bullish . To add to this bias, the price is currently trading above the Ichimoku cloud , indicating a bullish market. Price had some bullish momentum upwards toward the end of last week, and it is currently trading at 1409.50. If the bullish momentum continues, price may move towards the resistance at 1484.50, which contains the 23.6% and 78.6% Fibonacci lines. There is also a 61.8% Fibonacci projection line there too.
Alternative scenario: Price may retrace downwards and head towards the 1375.75 support level , which is just below the 50% and 23.6% Fibonacci lines.
Fundamentals: There are no major news.

Soybean Futures ( ZS1! ), H4 Potential for Bullish Momentum Title: Soybean Futures ( ZS1! ), H4 Potential for Bullish Momentum
Type: Bullish Momentum
Resistance: 1484.50
Pivot: 1350.00
Support: 1375.75
Preferred case: The current bias for ZS1! on the H4 chart is bullish. To add to this bias, the price is currently trading above the Ichimoku cloud, indicating a bullish market. Price had some bullish momentum upwards toward the end of last week, and it is currently trading at 1409.50. If the bullish momentum continues, price may move towards the resistance at 1484.50, which contains the 23.6% and 78.6% Fibonacci lines. There is also a 61.8% Fibonacci projection line there too.
Alternative scenario: Price may retrace downwards and head towards the 1375.75 support level, which is just below the 50% and 23.6% Fibonacci lines.
Fundamentals: There are no major news.

Daily ZS analysisDaily ZS analysis
A long position with the target and stop loss as shown in the chart
The trend is up, we may see more upside
All the best, I hope for your participation in the analysis, and for any inquiries, please send in the comments.
He gave a signal from the strongest areas of entry, special recommendations, with a success rate of 95%, for any inquiry or request for analysis, contact me

SOYBEANS // nice RR aheadHi✋🏽
Within the short trend, we have seen a nice countertrend built by the buyers and the sellers. It seems that this countertrend is turning in the direction of the main short trend.
What do you think???
Trade safe! ⚪️⚫️
--------------------------------------------------------------------------------
ANYWAY, a lot of Qs about the direction of the price. But it doesn't matter.
I JUST REACT!
Thanks for reading my analysis!🤘🏽
Remember that trading is a business.
SIZE your TRADES according to your risk aversion!
----------------------------------------------------------

SOYBEANS // short trend may continue after retestHi Everyone!✋🏽
As you probably know, I analyze price action and price went into countertrend on H4, testing the previous D/H4 south breakout with a nice wick. From here after 1-2-3 and through the short trigger zone, chances are high that targets on the chart will be met.
If countertrend never brakes all the way through the long trigger zone, I switch to the long side.
What do you think???
Trade safe! ⚪️⚫️
-----------------------------------------------------------------------------------------------------------
If you liked my analysis, please remember to support the idea with a BOOST , or COMMENT!
ANYWAY, a lot of Qs about the direction of the price. But it doesn't matter.
WE JUST REACT!
Thanks for reading my analysis!🤘🏽
Remember that trading is a risky business.
SIZE your TRADES according to your risk aversion!
----------------------------------------------------------

Daily ZS analysisDaily ZS analysis
Sell trade with target and stop loss as shown in the chart
The trend is down and we may see more drop in the coming period in the medium term
All the best, I hope for your participation in the analysis, and for any inquiries, please send in the comments.
He gave a signal from the strongest areas of entry, special recommendations, with a success rate of 95%, for any inquiry or request for analysis, contact me

SOYBEAN short scenarioHi Everyone!✋🏽
Soybean is technically in a downtrend. The first target that is the last daily low, where the correction of the short impulse wave has started. Can be reached until the validity zone stands the pressure from the buyers.
ANYWAY, a lot of Qs about the direction of the price. But it doesn't matter. WE JUST REACT!
Trade safe! ⚪️⚫️
----------------------------------------------------------------------------
Thanks for reading my analysis!🤘🏽
Remember that trading is a risky business.
SIZE your TRADES according to your risk aversion!
Please remember to support the idea with a BOOST or COMMENT
with your highly appreciated opinion!
----------------------------------------------------------------------------

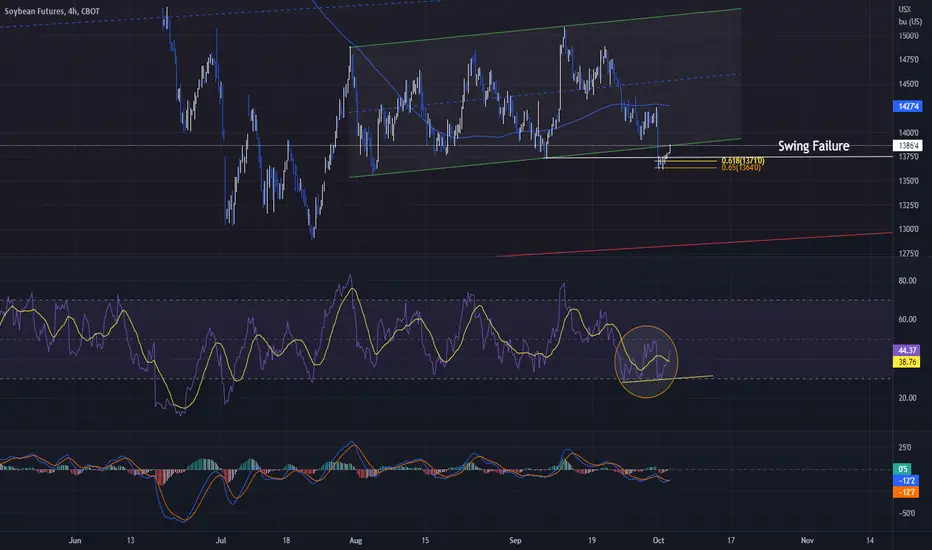
Took a long at the GP on soybeansSoybeans is looking decent with a nice bounce off of the GP and a technical swing failure of the local lows. The price must close above the parallel channel for me to hold this long.
Commodity soybean idea (29/09/2022)soybean
We expect a decline in the soybean commodity in the coming period because trading is below the critical point of 1509. Currently, the continuation of the decline in wave ((iii)), which may reach prices 1373 or 1302 before rising again.

Soybean Futures (ZS1!), H4 Potential for Bullish RiseType : Bullish rise
Resistance : 1581'4
Pivot: 1483'4
Support : 1377'2
Preferred Case: On the H4, with price moving along the ascending channel, we have a bullish bias that price will rise from the pivot at 1483'4, which is in line with the 38.2% fibonacci retracement to the 1st resistance at 1581'4 where the 61.8% fibonacci retracement is.
Alternative scenario: Alternatively, price could break pivot structure and drop to the 1st support at 1377'2 where the overlap support and 61.8% fibonacci retracement are.
Fundamentals: No Major News

Commodity soybean idea (20/09/2022)soybean
We expect a drop in the soybean commodity in the coming period since trading is less than the crucial point 1509. Currently, we expect to complete the correction in wave ((ii)), which may reach prices of 1471 or 1480 before declining again.

Soybeans ZS - Lagging the Pack, but Ready to GoThis is a call I wanted to make yesterday, but didn't have time. With the time I had, there was a choice between this and a Nasdaq NS call and made the Nasdaq call:
Nasdaq NQ - 8 Days & 1,700 Points
But in fairness, I did pick up November options during yesterday's session, so at least I can say that much for myself, since this has some vibes of hindsight based on today's action.
Regardless, Soybeans gives strong cause to believe bullish action is imminent, based on the monthly candles:
What this tells us that our June high formed a double top with the '12 all-time high. But most critically, it formed a lower high double top, which means that MMs are likely to seek this level to crush bear skulls, and it's just a question of when.
The post-resistance top was really a long gap fill and we've also had three months of consolidation. As everyone who's traded with real money knows, picking the direction and the price is not the hardest, but instead, the timing is the very hardest, and most critical, thing.
And in terms of timing, the weekly gives us good cause to believe we're ready to go. We see that late July featured a gap up, which has been filled in and heavily consolidated over the course of five weeks:
And thusly, there is significantly reduced reason to believe that Soybeans are set to seek new lows instead of new highs.
And indeed, on the daily, what has manifested is a string of higher lows, culminating in this morning's gundown of the 1,400 level
A gundown that looks exceptionally turtle soup on the 1H, albeit retrospectively since it already ripped. But note that the rip occurred at 9:00 just before NYSE opens, significant because there are ETFs like SOYB that get caught gap up.
More importantly, maybe consider not trying to short the pop. Instead, going long on a pullback could be quite good.
And so, in magnifying the timeframe down to the 4H, I discovered that targeting boxes that appeared correct on the wider time frame were a little too shallow on the lower time frames. Thusly, I have generated a "revised" targeting box.
However, like I said, time is the harder consideration. I feel ZS will get there, but who knows when? In the meantime, a rundown of the 1,500 level, which corresponds with those August-July relative equal highs around ~1,485 is very realistic.
Everyone knows the global food supply is in trouble because of all the drought . Whether it's corn, wheat, soy, or whatever. And while you can certainly expect a new all time high to be made, it's really a question of when.
Months like December, January, and February when everything is both trapped in winter, a new calendar year, and people are struggling to pay incredibly high natural gas/electricity bills across the world resulting from problems governments have created since the Russian Federation's invasion of Ukraine this year, may be the more likely time target for 2,000 point Soybeans.

Commodity soybean idea (14/09/2022)soybean
It is now trading in a corrective wave ((B)) targeting 1521 and may extend to 1536 prices provided that the critical limit at 1784 is not breached. The drop is confirmed by breaking the 1373 point

Commodity Soybean idea (09/09/2022)Soybean
we expect the decline in the coming period and the end of the correction in wave ((ii)). and the beginning of the decline. But the main resistance remains at 1432.26. Breaking this level indicates that there is a more corrective bounce, and the bearish scenario is over.

SOYBEAN FUTURESSharp and strong stamping and we are likely to see it at the very strong demand area from where we get a strong signal that God willing


Soybeans Retreat Fundamental Spotlight
Flash Sale Alert
Private exporters reported sales of 167,000 metric tons of soybeans for delivery to China during the 2022/2023 marketing year.
(More) Lower Yield Estimates
Commodity Consultant, Dr. Michael Cordonnier released his yield estimate for the U.S. corn crop. He dropped his estimate 3 bushels per acre, to 170 bpa. As mentioned, several times over the last week+, we feel the market has digested the lower yields and believe the market is likely trading closer to a 170-172 yield, below the most recent USDA estimate of 175.4.
Taiwan Strait
U.S. military vessels and aircraft have returned to the Taiwan Strait as tensions escalate. It's being reported that Taiwan fired shots at a done belonging to mainland China. We don't believe that this conflict will go away anytime soon. If the tensions rise to the point of U.S. intervention, it would likely be extremely bearish for grain futures.
Outside Markets
Outside markets were sharply lower yesterday with indices down to their lowest level since the end of July. Crude oil futures were sharply lower yesterday, erasing all the gains and then some from the previous session. That weakness has spilled into today's session, with October futures currently trading down another 3% and below the psychologically significant $90 handle.
Soybeans
November soybean futures closed off the lows yesterday which would be constructive under most circumstances, however, it was not enough of a rally to get the market out above our pivot pocket, 1430-1440. Markets are back on the lower side this morning and are approaching the 50 and 200 day moving average again. A break and close below those could open the door for a drop into the mid 1370's.
Bias: Bearish/Neutral
Previous Session Bias: Bearish Neutral
Resistance: 1459 1/4-1467***, 1481-1489***, 1500-1507 ¾****
Pivot: 1430-1440
Support: 1400-1407****, 1376-1379**
Futures trading involves substantial risk of loss and may not be suitable for all investors. Trading advice is based on information taken from trade and statistical services and other sources Blue Line Futures, LLC believes are reliable. We do not guarantee that such information is accurate or complete and it should not be relied upon as such. Trading advice reflects our good faith judgment at a specific time and is subject to change without notice. There is no guarantee that the advice we give will result in profitable trades. All trading decisions will be made by the account holder. Past performance is not necessarily indicative of future results.
