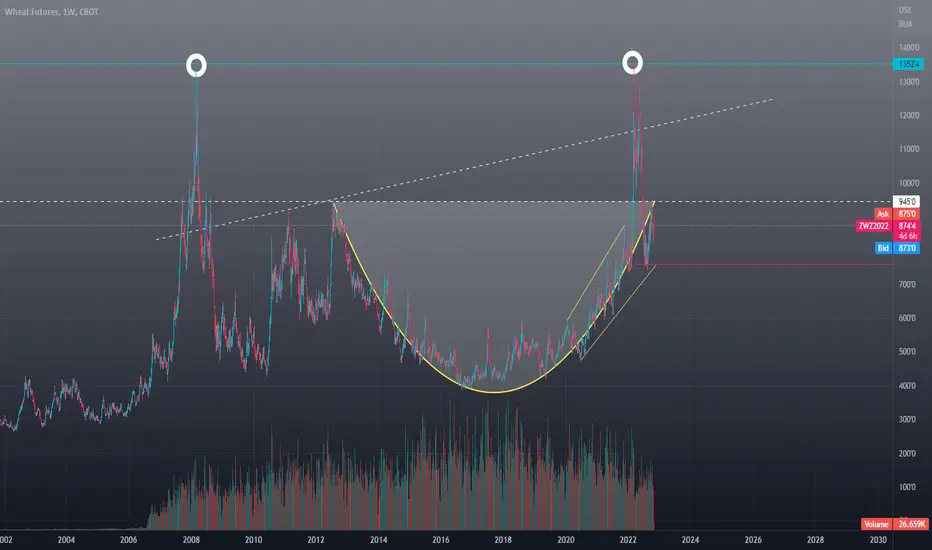
Wheat: Rough ride since March...Now what???Wheat has had a rough ride since the historic highs reached in March, and now is at levels that will test a "swing support" zone that has held several times in the past year.
In summarizing this past week's wheat action, Total Farm Marketing noted (www.totalfarmmarketing.com)
Wheat Prices Lower for the Week
December CBOT wheat futures shed 10-1/2 cents this week to close at 803-1/4
December KCBOT wheat futures shed 9-1/4 cents this week to close at 934-1/4
December MGEX wheat futures added 5-3/4 cents this week to close at 951-1/2
Informa raised its estimate for the 2023 World wheat crop my 4.5 million tons on higher production in China and India
Wheat export sales were only 5.7 million bushels last week which is the second smallest weekly total for that date since 1996
Managed money is currently holding its largest net-short position in 3 years
US winter wheat conditions improved somewhat after last week’s rains, but the Plains are still in an extreme drought and will need higher than normal winter precipitation to replenish soil moisture before crops come out of dormancy in the spring
Given the mostly negative news, the price action is understandable. But from here, what's the play?
Carley Garner from DeCarley Trading tweeted the following idea (and shared with her clients): madmimi.com
The link will take you to Carley's specific trade idea which...spoiler alert....plays on Wheat holding support and bouncing from here at some point.
I think her trade idea is well constructed and founded on sound reasoning. I actually initiated a small position in the call spread (without selling the otm put).
As always, my positioning and my article is NOT meant to be advice in any way! But it's good food for thought and discussion. Eager to hear reactions/thoughts.
XW1! trade ideas

Wheat Futures Ready to Pop Again. Same Signal to Start 2020 BoomCOT Data is signaling that Wheat Futures ( CBOT:ZW1! ) are ready to pop after a few months of declines and chop
As it currently stands, this is the shortest the Large Speculators have been on Wheat since 2020 where it bottomed at 589'4 to rally all the way as high as 1422'0. By no means do I expect a similar rally to ensure, but this does illustrate how oversold the large speculators are and what the consequences of that can be.
I'm looking for a technical long reversal entry on the daily chart to enter the trade and then use sound risk management thereafter
Notes on My Trading Methodology and What I'm Even Talking About
COT Definitions:
- COT: Commitments of Traders Reports - A weekly report published by the government (CFTC) that shows long and short positions of the below 3 groups (As well as much more data I don't look at). We look at the NET positions of these 3 groups and compare them to historical levels to signal trade opportunities
1- Commercials: Hedgers - We want to trade with them when they're at extreme levels (Think Tyson, Cargill, General Mills, etc)
2- Large Speculators: Hedge funds and large institutions - We want to fade them when they are at max positions (Think suits in NYC and commodity funds)
3- Small Speculators: People/institutions trading small lot sizes not big enough to report to CFTC - We want to fade their max positions as well since they represent the public (Think dude in his PJs trading and small trading firms)
Indicators on Chart:
- The first indicator shows the net positions of the 3 groups above plotted over time
- The second indicator is an index of the relative buying/selling of commercials over a certain lookback period. Anything above 95 is looking for buy, look to sell when it hits 0
- Note: Just because the Commercial's net position is negative doesn't mean it can't be relatively net long and signal a buy (same in the opposite scenario)
Trade Setup - Both Must Happen:
- When commercials are at max levels we are alerted to buy or sell (Depending on the criteria above)
- On a daily chart, use technical indicators, candlestick patterns, news, etc to enter the trade (not shown here)
- Added bonus when the trend is your friend (I use a Multiple Moving Averages indicator to visualize)

Financial Wave. WheatWheat.
The price of WHEAT dropped to $760. We marked this level as a point of cancellation of our priority scenario, in case the price continues to fall, most likely wheat will continue to decline to $600. We’ll inform you about the changes in our wave counting in the near future, at the moment we stick to our view: this is the growth of WHEAT to new highs, but we do not exclude that it will have to be corrected.

Wheat Potential For Bearish ContinuationLooking at the H4 chart, my overall bias for ZW1! is bearish due to the current price being below the Ichimoku cloud, indicating a bearish market. Looking for a pullback sell entry at 804.00, where the 38.2% Fibonacci line is. Stop loss will be at 820.25, where the 61.8% Fibonacci line is. Take profit will be at 767.50, where the 88% Fibonacci line is.
Please be advised that the information presented on TradingView is provided to Vantage (‘Vantage Global Limited’, ‘we’) by a third-party provider (‘Everest Fortune Group’). Please be reminded that you are solely responsible for the trading decisions on your account. There is a very high degree of risk involved in trading. Any information and/or content is intended entirely for research, educational and informational purposes only and does not constitute investment or consultation advice or investment strategy. The information is not tailored to the investment needs of any specific person and therefore does not involve a consideration of any of the investment objectives, financial situation or needs of any viewer that may receive it. Kindly also note that past performance is not a reliable indicator of future results. Actual results may differ materially from those anticipated in forward-looking or past performance statements. We assume no liability as to the accuracy or completeness of any of the information and/or content provided herein and the Company cannot be held responsible for any omission, mistake nor for any loss or damage including without limitation to any loss of profit which may arise from reliance on any information supplied by Everest Fortune Group.

Wheat Long IdeaWheat performs poorly compared to other grain products. I expect news that will reverse the trend at these levels. This news may originate from Ukraine or Australia.

Strong probability to make profitsWe have a strong probability to buy or trading long the ZW market.

Financial Wave. WheatIn 2022, we saw a peak in WHEAT prices of $ 1363. Our priority scenario is to continue to grow, while in the most active phase, wheat prices can soar to new highs. Perhaps 2023 will be difficult in terms of the harvest. A price drop below $760.0 will change our view.

FOR commodities traders and suppliersFOR commodities traders we have a good entry point for buying wheat


clean wheat prices went perfectly to the zone which i had previously marked down, after displacing the upper zone.
now waiting for an entry, i uploaded what i think could be a future push up.

ZW1!11. 3. 22 I called for a long trade on WHEAT Last week. It did go higher, and I would have been optimistic then it would be going a lot higher because it Gapped Higher...But then it gapped lower and is almost At the support. I would get out of a long trade like this.

Wheat Mini Futures ( XW1! ), H4 Potential for Bullish MomentumTitle: Wheat Mini Futures ( XW1! ), H4 Potential for Bullish Momentum
Type: Bullish Momentum
Resistance: 949'3
Pivot: 904'1
Support: 877'3
Preferred case: With the price moving above ichimoku cloud , we have a buillish bias that the price may rise from the pivot at 904'1, which is in line with the overlap resistance to the 61.8% fibonacci retracement to the 1st resistance at 949'3, where the swing high is.
Alternative scenario: Price may retrace downwards and head towards the 877'3
support level , where the 38.2% Fibonacci lines located.
Fundamentals: There are no major news.

Wheat Mini Futures ( XW1! ), H4 Potential for Bullish MomentumTitle: Wheat Mini Futures ( XW1! ), H4 Potential for Bullish Momentum
Type: Bullish Momentum
Resistance: 949'3
Pivot: 904'1
Support: 877'3
Preferred case: With the price moving above ichimoku cloud, we have a buillish bias that the price may rise from the pivot at 904'1, which is in line with the overlap resistance to the 61.8% fibonacci retracement to the 1st resistance at 949'3, where the swing high is.
Alternative scenario: Price may retrace downwards and head towards the 877'3
support level, where the 38.2% Fibonacci lines located.
Fundamentals: There are no major news.

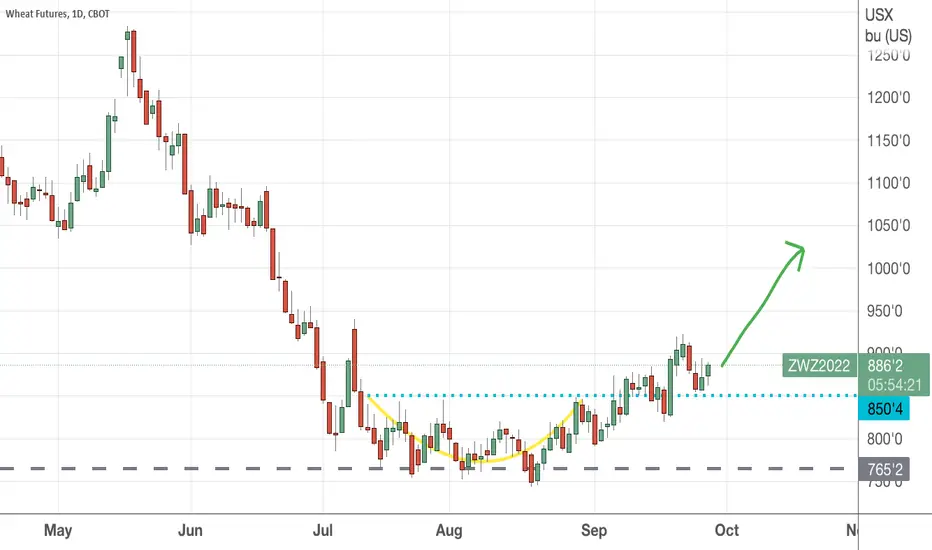
Bullish on Wheat See daily chart for more information
9th Sept candle broke out of the resistance once but failed . Then , 20th Sept, it shoot right up fiercely and pull back nicely at the resistance turn support level at 850.4. I believe the rally has just begun. Accumulate on its way up.........
WHEAT W1The situation on the wheat market may become critical for the consumer, due to Russia's withdrawal from the grain deal. That will probably entail a speculative increase in the price of grain. At the start of full-scale hostilities in Ukraine, we saw the price of quotations for wheat almost double in a very short period. After that, the situation stabilized a bit. But realizing that due to the impossibility of logistics of wheat from Ukraine, the situation could create hunger in the world. Because Ukraine is a very large supplier of grain, on which many countries depend. The states, with the participation of Erdogan, were able to reach a consensus and conclude a grain deal. But because of the shelling of the Russian fleet last week, the Russian Federation announced that it was withdrawing from this agreement. Now there are almost 300 ships at sea loaded with Ukrainian wheat and blocked by Russian troops. Not being able to supply grain to the consumer will create a shortage in the market and the price will automatically start to rise. Immediately after the announcement of Russia, the price increased by 8%!
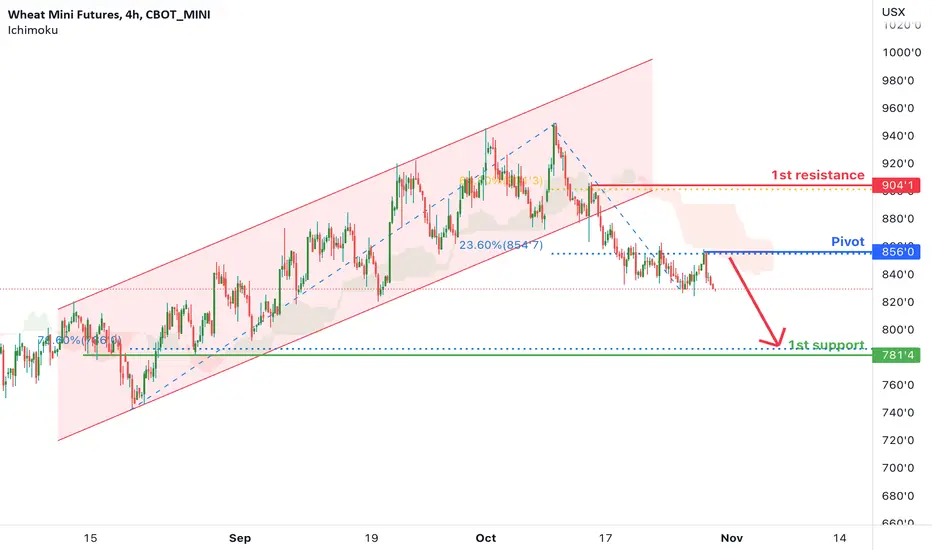
Wheat Mini Futures ( XW!), H4 Potential for Bearish MomentumType: Bearish Momentum
Resistance: 904'1
Pivot: 856’0
Support: 781'4
Preferred Case: On H4, as the price moving below ichimoku cloud and descending channel , we have a bearish bias that the price may drop from the pivot at 856‘0. which is in line with the overlap resistance and 23.6% fibonacci retracement to the 1st support at 781'4 where the 78.6% fibonacci retracement is.
Alternative scenario: Alternatively, the price may rise to the 1st resistance at 904'1, which is in line with the 61.8% fibonacci retracement .
Fundamentals: There are no major news.
Wheat Mini Futures ( XW!), H4 Potential for Bearish MomentumType: Bearish Momentum
Resistance: 904'1
Pivot: 853'1
Support: 781'4
Preferred Case: On H4, as the price moving below ichimoku cloud and descending channel , we have a bearish bias that the price may drop from the pivot at 853'1. which is in line with the overlap resistance and 23.6% fibonacci retracement to the 1st support at 781'4 where the 78.6% fibonacci retracement is.
Alternative scenario: Alternatively, the price may rise to the 1st resistance at 904'1, which is in line with the 61.8% fibonacci retracement .
Fundamentals: There are no major news.
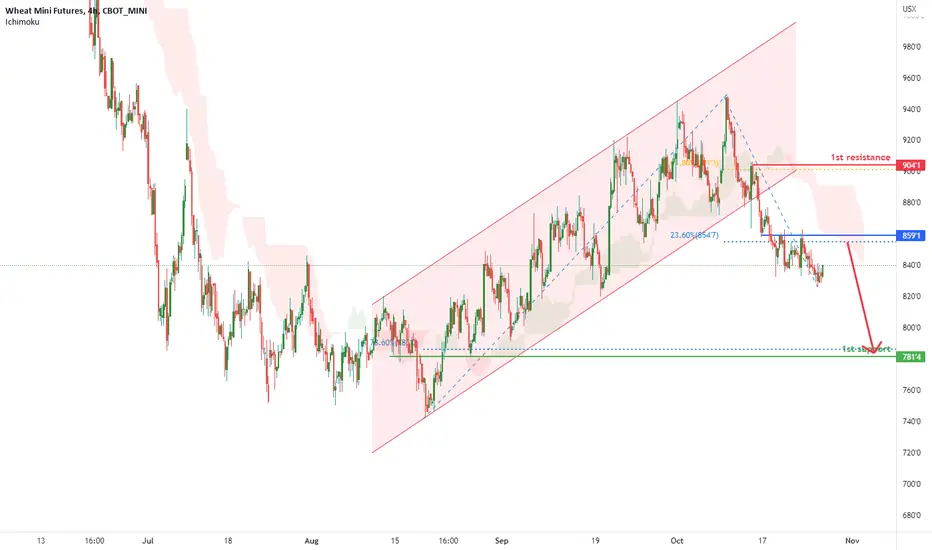

LBS1!10. 26. 22 I think the lumber has come to a reversal area. Unfortunately, I pushed the wrong button, which may be good for you, and I accidentally close the video before I got done talking. This means there will be another video.

Wheat Mini Futures ( XW!), H4 Potential for Bearish MomentumType: Bearish Momentum
Resistance: 904'1
Pivot: 853'1
Support: 781'4
Preferred Case: On H4, as the price moving below ichimoku cloud and descending channel , we have a bearish bias that the price may drop from the pivot at 853'1. which is in line with the overlap resistance and 23.6% fibonacci retracement to the 1st support at 781'4 where the 78.6% fibonacci retracement is.
Alternative scenario: Alternatively, the price may rise to the 1st resistance at 904'1, which is in line with the 61.8% fibonacci retracement .
Fundamentals: There are no major news.
Wheat Mini Futures ( XW1! ), H4 Potential for Bearish MomentumType: Bearish Momentum
Resistance: 904'1
Pivot: 858'2
Support: 781'4
Preferred Case: On H4, as the price moving below ichimoku cloud and descending channel , we have a bearish bias that the price may drop from the pivot at 858'2. which is in line with the overlap resistance and 23.6% fibonacci retracement to the 1st support at 781'4 where the 78.6% fibonacci retracement is.
Alternative scenario: Alternatively, the price may rise to the 1st resistance at 904'1, which is in line with the 61.8% fibonacci retracement .
Fundamentals: There are no major news.

WHEAT // market is in daily impulseHi✋🏽
Trend is short, and price tested the last daily south breakout, then turned. Targets are marked by the fibo.
What do you think???
Trade safe! ⚪️⚫️
--------------------------------------------------------------------------------
ANYWAY, a lot of Qs about the direction of the price. But it doesn't matter.
I JUST REACT!
Thanks for reading my analysis!🤘🏽
Remember that trading is a business.
SIZE your TRADES according to your risk aversion!
----------------------------------------------------------
