#DowJones #US30 Action Areas For The Week AheadIn this update we review the recent price action in the emini Dow Jones and identify action areas for the week ahead and price objectives to target
•Past performance not indicative of future results
YM1! trade ideas

Dow Futures (YM) Ending Short Term Impulse SoonShort Term Elliott Wave view in Dow Futures (YM) suggests cycle from 7.10.2023 low is about to end as 5 waves impulse. From 7.10.2023 low, wave i ended at 34211 and dips in wave ii ended at 34060. The Index rallies again in wave iii towards 34493 and pullback in wave iv ended at 34410. Final leg wave v ended at 34792 which completed wave (i). Index then pullback in wave (ii) which ended at 34493. Index then resumes higher again in wave (iii).
Up from wave (ii), wave i ended at 34788 and pullback in wave ii ended at 34581. Index then resumes higher in wave iii to 35417 and pullback in wave iv ended at 35192. Final leg wave v ended at 35549 which completed wave (iii). Pullback in wave (iv) ended at 35348 with internal subdivision as a double three. Down from wave (iii), wave w ended at 35364, wave x ended at 35514, and wave y ended at 35348 which completed wave (iv). The Index resumes higher in wave (v) with internal subdivision as a 5 waves. Near term, as far as pivot at 34493 low stays intact, the Index can extend higher a few more highs before ending wave (v) of ((iii)). This should complete cycle from 7.10.2023 low and Index should then see larger degree pullback to correct that cycle.

E-Mini Dow Jones (LONG)E-mini Dow Jones looking good to long right now because the trend currently bullish. The risk reward 2:1 also is a good reward and this is a good trade.

#DowJones #US30 Action Areas For The week AheadIn this update we review the recent price action in the emini DowJones futures contract and identify the next high probability trading opportunity and price objectives to target
•Past performance not indicative of future results

Technical analysis: #DJI #Long positionAccording to the chart pattern, it looks like it will reach potential target at 38210.

#DowJOnes #US30 Action Areas For The Trading Week AheadIn this update we review the recent price action in the emini DowJones futures contract and identify some high probability action areas for the trading week ahead
•Past performance not indicative of future results

US30Je suis haussier sur le US 30. Un OB qui a très bien réagi. Donc, je le vois chercher la liquidité qui est à la hausse

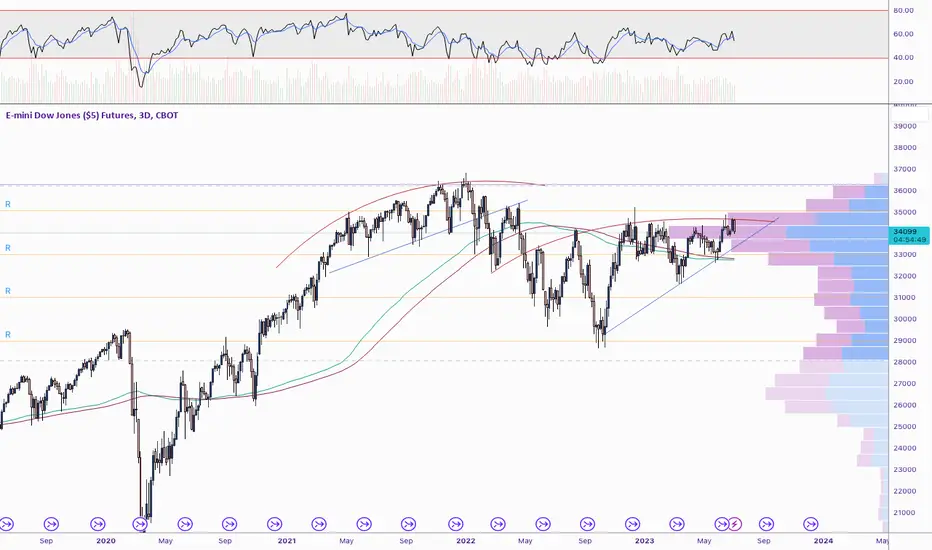
Dow Jones Futures; YM1! – 2H 2023, 3d chartPosting this to track the progress in the Dow Jones futures.
Currently forming a rounded top, expecting it to behave like a rising wedge. If you expect this to go bearish, don't be surprised if we get an overthrow before it breaks down. If it does breakdown, this forms a perfect double top.
If this breaks out and sustains the breakout, look to the following time periods for similar price action:
Q2-Q3 2018, or,
First half 2019
#DowJones #US30 Action Areas For The Trading Week AheadIn this update we review the recent price action in the emini DowJones futures contract and identify high probability action areas for the trading week ahead and price objectives to target
*Past performance not indicative of future results

Bearish Fractal: Dow Jones vs BitcoinThroughout the world, we see patterns arising. To some, they may seem like nonsense, but to others, there are certain formations that at times can be warnings of what's to come, as seen in this comparison. Bitcoin and the Dow are starting to match up in wave formation patterns, with Bitcoin being the leading indicator for future moves in the Dow. While this all may seem like pseudoscience, in actuality, what we are seeing is the movement of large players, shuffling billions around via dark markets and hedge funds. If this pattern continues, we should be seeing a major drop in the indices in July. TVC:DJI CBOT_MINI:YM1! BITSTAMP:BTCUSD

YM Long- Trades taken using confirmation entires have a higher probability for sucess.
- Using an initial 1:1 target is recommended for reducing risk.
- Short-term income trade ideas are good for the day unless otherwise stated.
*** For educational purposes only ***

Dow 4hour =buy pinbar on daily chartAlert=Fino 161% on weekly chart show upper target is 38500 , so be careful from sell
for now if last low not break ,it will go up , so buystopon last high is good idea (sl=low)
if you have old sell, 100% put hedge buystop in last high,,,brak it mean uptrend will story
goodluck

Dow Jones: Breather 😮💨Dow Jones is taking a breather near the resistance at 34 363 points, showing (again) a distinct response to this mark. Soon, though, the index should resume the ascent to develop the top of wave (i) in blue, which should then initiate a prominent downward movement. However, there is a 30% chance that Dow Jones could drop below the support at 32 246 points, plunging into the orange zone between 31 675 and 29 939 points to already expand wave alt.(ii) in blue. From this low, the index would then start a fresh upward movement.

Long MYMLong MYM. Rejection of London lows. Liquidity levels above to which it can draw to. Strong 15min bullish candle close above previous high.

DOW Jones PM session ATM Machine Trade idea 06/20/2023Trade idea and execution with market narration, stop placement and stop loss adjustment.


DJIA Is Bullish, Bouncing Away From The 61.8% Fib Stocks are bullish for the last few weeks, and some of indexes are finally breaking higher on speculation that FED is going to pause the hiking cycle. US CPI print also came out lower than expected, 4% down from 4.7% so there is even greate chance that FED will be on hold soon. When that’s the case stocks can move higher much easily, but still keep in mind that for higher stocks dovish times are the ideal, but hold is not dovish, and we forget this too many times. Anyway, looking at the DJIA, the trend is in a recovery mode and looks like more gains can be underway after first correction down to 61.8% Fibs back in March followed by five waves rise and then another perfect minor A-B-C drop again into 61.8% Fib. This is definitely the Fibs that needs a lot of attention and so far we can see a nice turn higher with price threatening 34276 level. Ideally a daily and weekly closes above that figure opens room for 35631.

Short MYM based on ICT conceptsShorting MYM based on ICT London session Silver bullet. Grab of liquidity, break of structure to the downside. MYM is the weakest, many targets below.

#DowJones #US30 Action Areas For The Trading Week AheadIN this update we review the recent price action in the emini DowJones futures contract and identify some high probability action areas and price objectives to target

YM1! US30USD DOW 2023 June 12 WeekYM1! US30USD DOW 2023 June 12 Week
No change to previous analysis, observing reaction to 34605-34275 area. Last Friday's up bar
showed significant weakness.
Possible scenario:
Short if 34605-34275 is rejected again
Reason:
Higher low toward previous resistance, on reducing volume.
The professionals may engineer a false break to suck in traders unaware of the weakness.
We shall wait to short on rejection of recent high.
Price Reaction Levels:
Short on Test and Reject | Long on Test and Accept
35750 34605-34275
32692 31657
Price Volume Analysis:
Weekly: Ave vol up bar = NTC
Daily: Ultra low vol up bar close off high = significant weakness
Like and follow if you find this useful.
Have a profitable trading week.
*For education purpose only.

Dow bull not yet ragingSomebody whispered "new bull market!" into our ear overnight. Bull or no, we think DJIA futures have a bit further to pull back from recent overbought levels before the stampede begins in earnest.
Traders who agree can either short the September Dow futures, as here, or pick up some AMEX:DOG or $SDOW.

Dow Futures (YM) Rallying Higher as ImpulseShort Term Elliott Wave in Dow Futures (YM) suggests rally from 3.15.2023 low is in progress as a 5 waves impulse Elliott Wave structure. Up from 3.15.2023 low, wave 1 ended at 34363 and pullback in wave 2 ended at 32619. The Index has turned higher in wave 3 with internal subdivision as another 5 waves in lesser degree. Up from wave 2, wave (i) ended at 3330 and dips in wave (ii) ended at 32737. Up from wave (ii), wave i ended at 33212 and pullback in wave ii ended at 33060. Wave iii ended at 33863, wave iv ended at 33797, and wave v ended at 33894 which completed wave (iii).
Pullback in wave (iv) ended at 33448 as a zigzag structure. Down from wave (iii), wave a ended at 33665, wave b ended at 33780 and wave c lower ended at 33448. This completed wave (iv). Wave (v) of ((i)) is currently in progress. Up from wave (iv), wave i ended at 33745 and pullback in wave ii ended at 33635. Expect the Index to extend higher a few more highs to end wave v of (v) of ((i)). Then it should pullback in wave ((ii)) to correct cycle from 5.25.2023 low in 3, 7, or 11 swing before the rally resumes. Near term, as far as pivot at 32616 low stays intact, expect dips to find support in 3, 7, 11 swing for further upside.

YM1! US30USD DOW 2023 June 05 WeekYM1! US30USD DOW 2023 June 05 Week
Welcome myself back from holiday!
Some selling into higher prices, so will watch reaction to 24605-34275
area.
Possible scenario:
1) Short if 34605-34275 is rejected again
2) Higher low toward previous resistance, for long on retracement.
Retracement down bars need to be on lower volume for this to happen.
Price Reaction Levels:
Short on Test and Reject | Long on Test and Accept
35750 34605-34275
32695 31657
Price Volume Analysis:
Weekly: Lower vol wide spread up bar = possible weakness
Daily: Higher vol wide spread up bar = possible weakness
Like and follow if you find this useful.
Have a profitable trading week.
*For education purpose only.
