#DowJones #US30 Action Areas For The Trading Week AheadIn this update we review the recent price action in the DowJones and identify some high probability action areas for the trading week ahead
YM1! trade ideas

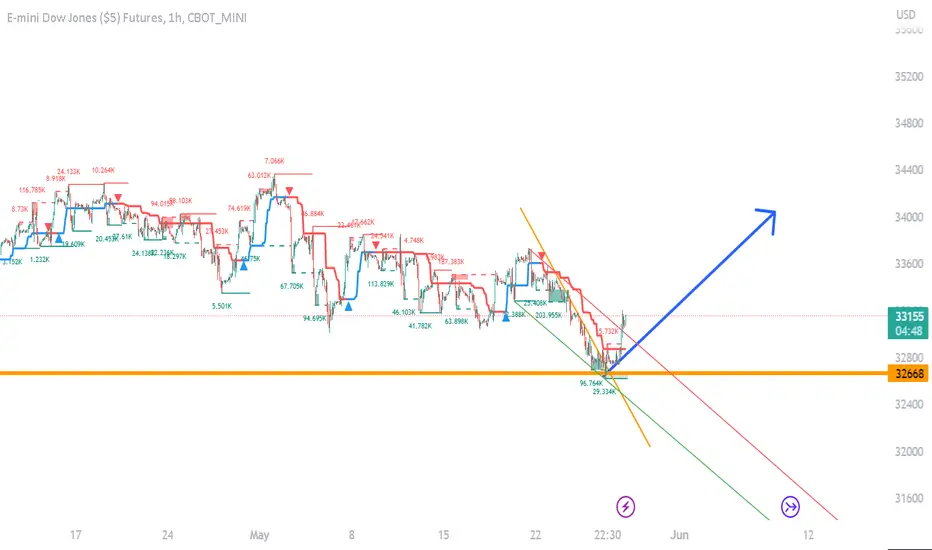
changed its trendThe Dow Jones has changed its trend and will move from the daily floor to the daily ceiling
#DowJones #US30 To Test The Equality ObjectiveIn this update we review the recent price action in the DowJones and identify the next high probability trading opportunity and price objectives to target

Dow 4hour say= when pinbar comes,pick buy and hold when you see buy pinbar on 1hour or 4hour or daily chart ,pick buy with SL=pinbar low
wait time=2week
predict=dow,nasdaq,sp500 will see all time high again (35000) but with 2-3 mini crash
if you have old buys,dont fear, if red area break,hedge your buys
wish you win

Dow Jones H4 As 33k Supports Target A Test Of 34kIn this update wee review the recent price action in the emini #DowJones futures contract and identify the next high probability trading opportunity and price objectives to target

NABO - DJIAThere is a nabo here. Note how it tries to break above but really lingers a long time here.

US30 Initial Weekly Analysis Even though we had some strong fundamentals that pushed U30 to upside it is still technically bearish. If price exceed invalidation area, then I would look to reanalyze this.

DJIA Expected To Recover From 32500-32800 areaThats a nice pattern on DJIA; five up and now three down underway, so ideally more gains will come, but after wave C down that is still missing. We may see a bounce later this week from around 32500-32800 area.

Dow Jones/US30 Market Maker Sell Model I see DXY trading to a premium array. YM gives me market maker sell model vibes. Looking for a discount array to be the draw on liquidity.

YM1! US30USD DOW 2023 15 May WeekCBOT_MINI:YM1!
Last week's test and reject 33670 short yielded 270pts.
Market approaching intermediate axis 32994.
Possible scenario:
1) 32994 is supported and market returns into 33850-32994 range
2) 32994 becomes resisted and market head toward 31657/30513
Price Reaction Levels:
Short on Test and Reject | Long on Test and Accept
33632
34275-34605 33850
32994-33195
31657
Price Volume Analysis:
Daily & Weekly: Possible No Supply down bar close off low = strength
Like and follow if you find this useful.
Have a profitable trading week.
*For education purpose only.

dow short entry day tradesell the pitchfork re test, look for a move to the median line at best. CBOT_MINI:YM1!

Dow Jones H1 Look For 33420's To Support For A Test Of 34000In this update we review the recent price action in the emini #DowJones futures contract and identify the next high probability trading opportunity and price objectives

YM1! US30USD DOW 2023 MAY 08 WEEKCBOT_MINI:YM1!
Test and reject of 34275 for first week of May:
Entry: 34105 | Risk 100pts (reduced size) | Exit 33674 | Profit 430pts
Now that YM has exited rotation, and tested boundary, we may see the
likelihood of a rejection trade from 33670. Set your alarm there.
Possible scenarios:
1) Test and reject of 33670 = short
Volume Analysis:
Daily: High volume breakdown from rotation, followed by lower
vol up bar close off high = confirmation of supply overcoming demand
H4: Lower vol up bar close off high = weakness
Price reaction levels
Short on Test and Reject | Long on Test and Accept
35228 34605 34275
33670 32681 31657
Remember to like and follow if you find this useful.
Have a profitable week ahead.

Dow shortTesting mobile app published idea. Short with a tight stop looking for continuation to the downside.

5-2-23 [dow jones]gm,,,
haven't been posting anything public lately - too busy with the private content.
----
created a few minute window today to write this up, and a few others.
----
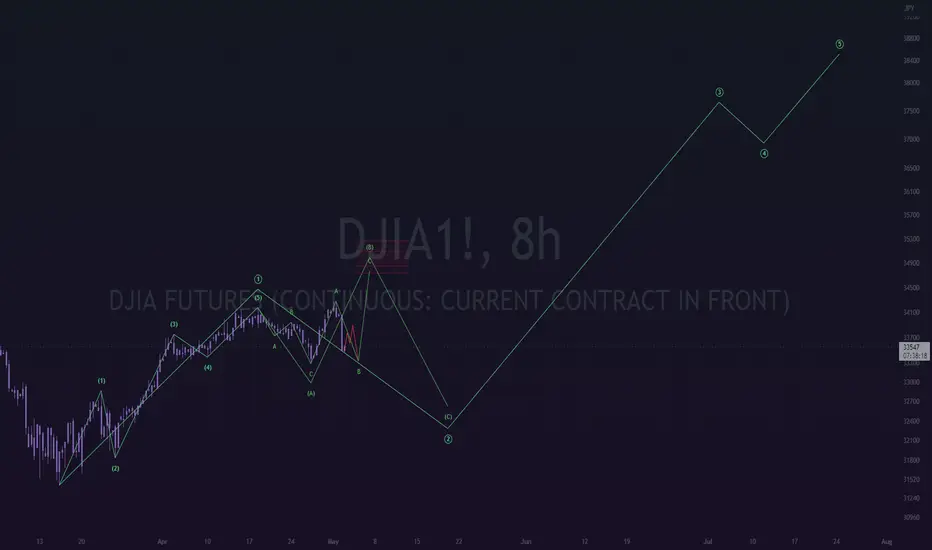
i am envisioning a massive move to the upside on this dow jones index.
estimating for it to take out the all time highs.
> sounds bananas right?
> maybe to you, anon.
----
og post:
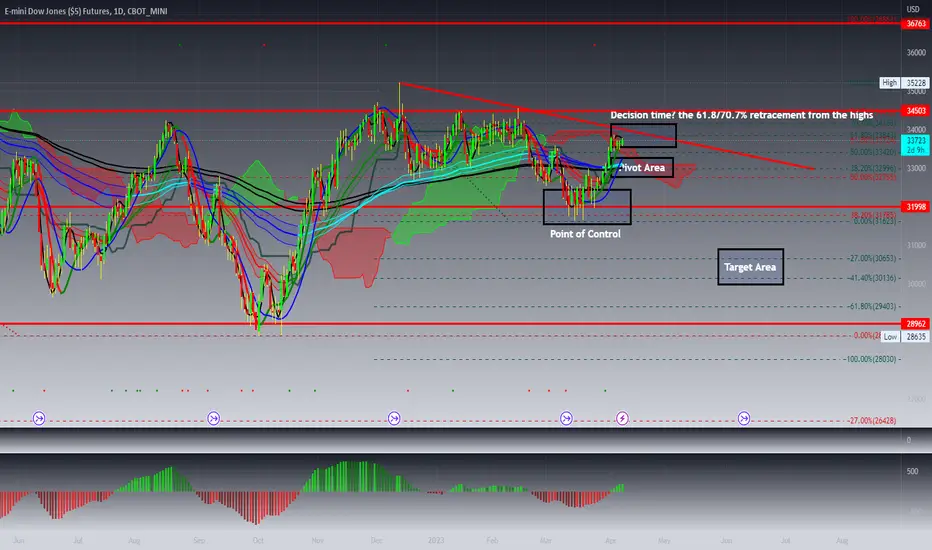
DowJones 1000points Higher From Support, What Next?In this update we review the recent price action in the emini #DowJones futures contract and identify the next high probability trading opportunity and price objectives to target

DowJones H4 Actions Areas For The Week AheadIn this update we review the recent price action in the emini #DowJones futures contract and identify the next high probability trading opportunities and price objectives to target

YM1! US30USD DOW 2023 APR 24 WEEKYM1! US30USD DOW 2023 APR 24 WEEK
Discretionary trade at the 34275 rejection yielded 350pts.
With price failing to reach previous supply level 34605,
could market be indicating that demand at higher levels
have been exhausted?
If so, we may be looking at further distribution (i.e. selling)
Possible scenarios:
1) With weakness observed, wait to short at rejection at 34605 // 34275
2) Possibility of rotation between 33670 - 34275 = trade at boundary
of range
Volume Analysis:
Daily: Possibility of buying climax.
Price reaction levels
Short on Test and Reject | Long on Test and Accept
35228 34605 34275
33670 32681 31657
Remember to like and follow if you find this useful.
Have a profitable week ahead. CBOT_MINI:YM1!

Dow Jones: Spring Fever 🥱Has Dow Jones caught spring fever? At the moment, the index seems to lack the necessary drive to continue expanding wave (i) in blue. However, we expect Dow Jones to pull itself together soon and to summon up enough momentum to make it above the resistance at 35 521 points. The index should not surmount the higher mark at 36 446, though, but finish the current movement and turn downwards again. There is also still a 35% chance that Dow Jones could slip below the support at 28 635 points, heading for a new low in the form of wave iv in magenta.

YM1! US30USD DOW 2023 APR 17 WEEKCBOT_MINI:YM1!
YM1! US30USD DOW 2023 APR 17 WEEK
Previous long scenario2 at 32595 // 33590 worked well.
Potential weakness observed.
Market now is approx. 500pts away from 34605.
Possible scenarios:
1) Trade to be guided by channel
2) With weakness observed, wait to short at channel's
supply line or rejection at 35228 // or 34605 previous
rejection area
Volume Analysis:
Weekly: higher volume up bar close off high
= minor weakness
Daily: Higher vol mark up to close lower, and a close below
middle of bar = potential weakness
Price reaction levels
Short on Test and Reject | Long on Test and Accept
35228 34605 33590
32595 31657
Remember to like and follow if you find this useful.
Have a profitable week ahead.

The DJI thoughts for next potential move As we enter earnings season and all equity markets enjoying rallies from the lows
these are my thoughts on the DJI
Please always identify a set up at suggested areas for entries and always manage your risk
long position on YMMy strtegy is based on price action with the reading of certain indicators that I like whilerespecting all the values that define the stock maket

DowJones H1 As 33500 Supports Target A Pivotal 34000 Test NextIn this update we review the recent price action in the emini #DowJones futures contract and identify the next high probability trading opportunity and price objectives to target
