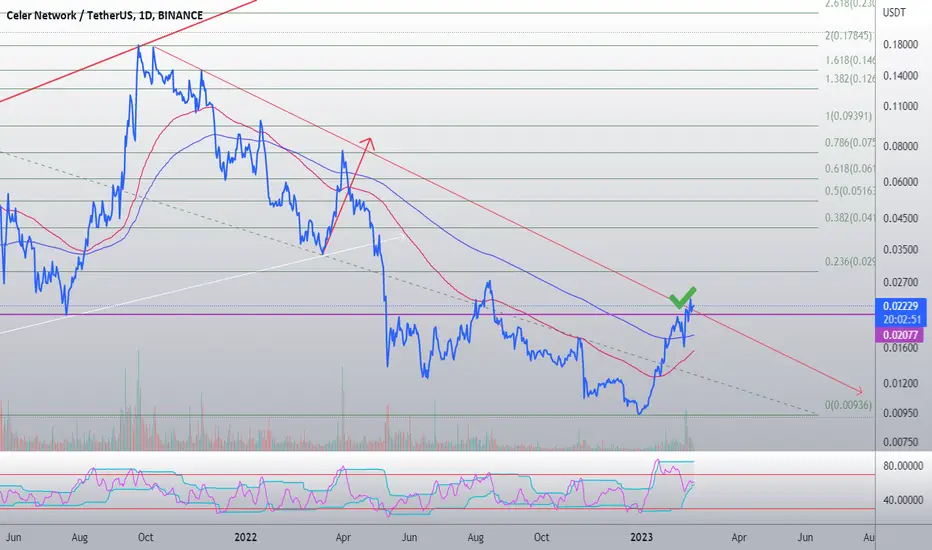
CELR - breakout confirmation!I am currently on the lookout for promising cryptocurrency coins. After monitoring the movement of CELR's price, it seems that a favorable opportunity to purchase has emerged. Notably, the price has surpassed all significant resistance levels and has recently indicated a complete breakout signal by breaking the downtrend line.
In the short term, the expected targets for this coin are 0.029, 0.041, and 0.051. Thank you for your attention and support!
CELRUSDT trade ideas
SasanSeifi 💁♂️CELR/USDT 1D/UPDATE ✅2nd target😍 52% 🔥🔥HI TRADERS, as mentioned in the previous analysis of the daily time frame. The price faced buying pressure from the support range of 0.015/0.017 and the price has grown by more than 50% according to our analysis, the second goal has been reached.🔥✌ And the next important targets is 0.026/0.029.
❎ (DYOR)...⚠️⚜️
WHAT DO YOU THINK ABOUT THIS ANALYSIS? I will be glad to know your idea 🙂✌️
IF you like my analysis please LIKE and comment✌️

Celrusdt Testing Krey Resistance Testing Major Trendline In daily Timeframe
Incase Of breakout Expecting 300 to 320% Bulish Move


💁♂️CELR/USDT 👉 D/W💁♂️ HI Everyone,
As you can see, By examining #CELR in the weekly time and daily time, The price has faced a positive trend for about a month according to the block order formed from the 0.010 range. On the weekly time frame, the price is in the range of 0.019. The possibility of price growth up to the range of 0.026 can be considered. Currently, The price may be correction up to the range of 0.017 / 0.014 and by gathering volume To continue the positive trend. it is important to stabilize the price above the 0.026/ 0.030 range and break the downtrend line. In case of correction ,it should be seen how the price will react to the long-term support of 0.014/0.010. in the long term; If the price breaks below the 0.010 LOW and stabilizes, a new LOW and further correction can be considered.💹
In the daily time frame, as you can see, the price has been rejected after the growth of about 120% from the supply area and the dynamic resistance range. Currently, there is a possibility of price correction up to the range of 0.017, if the support of 0.017/0.015 is maintained, we can expect growth up to 0.020 again! The next targets are 0.021/0.024/0.026. We have to see how the price will react. Otherwise, if the price continues with the corrective trend, a correction target of 0.014 can be considered.💹
The important resistance range of the daily time frame is 0.020❗️
The Important support range of daily time frame 0.017/0.015/0.014❗️
❎ (DYOR)...⚠️⚜️
WHAT DO YOU THINK ABOUT THIS ANALYSIS? I will be glad to know your idea 🙂✌️
IF you like my analysis please LIKE and comment✌️

Celer Network (CELR) forming bullish BAT | Good buy opportunityHi dear friends hope you are well, and welcome to the new update on Celer Network (CELR) token with US Dollar pair.
Previously I shared a long-term trade setup for CELR, which is still in play as below:
Now on a 2-hr time frame, CELR is about to complete a bullish BAT move for another price reversal soon.
Note: Above idea is for educational purpose only. It is advised to diversify and strictly follow the stop loss, and don't get stuck with trade


Celer Network descending wedgeCeler Network descending wedge has formed, the breakout should be a powerful one..

CELR/USDT - wen $0.02+?CELR/USDT - wen $0.02+?
I am expecting CELR to retest the resistance at 0.195. If the bulls can push us above $0.02, I think we can run up to $0.032 - by the end of February my conservative estimate, even if we are rejected at $0.02, I believe we will land in the highlighted area of the chart above which is still above where we are at now. I think Celer is an underrated project in the space that has a function and secure protocol that is definitely helpful in cross chain interactions. Overall, I am long term bullish on Celer network and the future of the project.

CELRUSDT needs a new breakoutThe price is testing the supply zone after a bounce from the 0.009$ area.
How to approach it?
IF and only IF the price is going to have a breakout from the static 4h support and retest as new support, According to Plancton's strategy , we can set a nice order
–––––
Keep in mind.
🟣 Purple structure -> Monthly structure.
🔴 Red structure -> Weekly structure.
🔵 Blue structure -> Daily structure.
🟡 Yellow structure -> 4h structure.
⚫️ black structure -> <= 1h structure.
–––––
Follow the Shrimp 🦐

Celer network!Pushing up against the top Bollinger band and RSI is overbought over 70, proceed with caution however, I am holding on to this one because I believe it will pan out soon.
Good luck !

CELR/USDTCELR/USDT looking bullish, it is a great project that I have had my eye on for a while. L2's will be a leading narrative going forward in the space. Matic is holding up the best amongst all cryptos, I think that just as L1 coins flourished, L2's with utility, superior tech, and strong communities will succeed. Celer network will help interoperability among blockchains through cross chain bridges.
01/12/2023
Position Entered at 0.0116
Current Price: 0.01205
Target #1: 0.022
Target #2: 0.027
Target #3: 0.030
Good Luck everyone!

CELR USDTCeler Network opportunity
big things coming 2023
..........................................
BUY BUY BUY

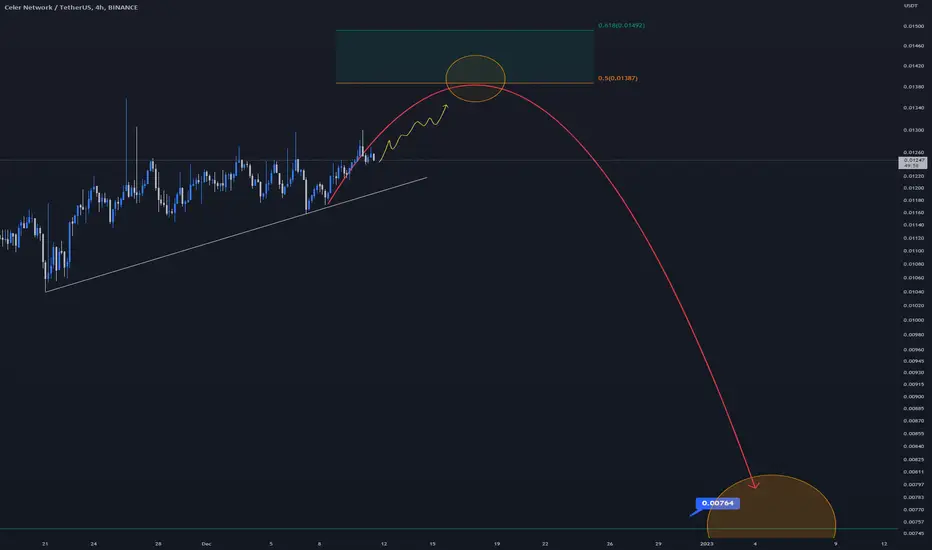
CELR Short Position, Watch Fib Levels!As you can see we are in a long-term Descending Trend, which will lead the final target below 0.01 $ !!
Reaching those targets will be an excellent opportunity for investment till the end of 2025 Bull Run which will make you at least 20X Profit on this Low Market Cap Gem !!
So, at the first step, we will monitor the trend line on the 4H Time frame and Fibonacci Levels about 0.135 ~ 0.145 $!
After that, we can have a short position and become with the trend until we reach the 0.01$ price!
Remember this will take about 60 days! So be patient
Keep Calm and Trade with us.
CELR / USDT short ideaCurrenly CELR has tested a previous 4H swing high
* Waiting for CELR to push further down and wait for a 50%+ retracement into the FVG where I will open a short position

CELRUSDTHello Crypto Lovers,
Mars Signals team wishes you high profits.
This is a 4-hour-time frame analysis for CELRUSDT
There are R2 and R1 in this chart that used to be support areas and in both of them the support of price at different points is clear. And S1 and S2 at the bottom are the support areas with their well support of price. Hence, we have the price fluctuating over S1 area and there are two options available here for us. Either the price will provide us some rising signs and an increase would be expected for it upward. Or it is possible that the price loses the support and we receive some falling signs by reaching S1 and then a fall is waiting for the price there. Please be attentive to any piece of information or detail required for a logical trade.
Warning: This is just a suggestion and we do not guarantee profits. We advise you to analyze the chart before opening any positions.
Wish you luck

CELR technical analysisPrice is still moving down from the 2h supply zone as expected. I expect price to move down towards the 5h demand zone where we would be looking to long from.

#CELRUSDT 4H Chart
Price is still moving down from the 2h supply zone as expected. MACD is not clear, RSI and EMAs are neutral. I expect price to move down towards the 5h demand zone where we would be looking to long from.

Celr Daily Chart(Buy zones)hi everyone
as you can see celr is in a downtrend channel and following our path as we told you in previous analyses (check related ideas)
every thing is clear on the chart and doesn't need to explain more...
mentioned levels are best to demand zones and you can buy in there
I am putting some orders around demand zones, expect to bounce from here
please share your opinion in the comments
I consider all analyses performed in relation to that trade position.
Our analysis is not a buy or sell referral.
If you found our analysis useful and interesting, feel free to share it so that more individuals might benefit.
And please don't forget to like and comment; we will read them all.

#CELRUSDT 2H Chart
Price had previously left an area of equal lows where it bounced from. MACD is not clear, RSI and EMAs are neutral. I expect price to move down to fill the imbalance around $0.0106 and tap into the 2h demand at $0.0104 before moving up again.

CELR Final Falling LegWe had the analysis of the CELR symbol from months ago, which is in a significant downtrend with a 5-wave movement and is reaching the final goal.
This last wave will be in the form of a 3 to a 5-wave movement that is currently in the corrective phase. With the end of this phase in the specified Fibonacci range, we can enter a new selling position and will be with it until the final field of this movement.
Follow me For further updates!

CELRUSDTHello Crypto Lovers,
Mars Signals team wishes you high profits.
This is a one-day-time frame analysis for CELRUSDT
Here we have R1 on the top which is a resistance area and the unsuccessful triumphs of price to rise is clear in it. And S1 and S2 are the support areas that have the well support of price representing there. Hence, the price is fluctuating over S1 and our belief would include a rising trend toward R1 after receiving some rising signs at S1. By the time this happens, an increase will happen to the price to reach higher amounts. Bear in mind tat if the price falls below S1, more decline will wait for it. So consider confirmation candles all the time for a logical behavior in your trades.
Warning: This is just a suggestion and we do not guarantee profits. We advise you to analyze the chart before opening any positions.
Wish you luck

CELRUSDT | BREAKOUTCELRUSDT has been trading under the falling resistance.
Recently it has broken above the falling resistance.
We are expecting bulls will took the price high as keeping the support intact.
The bulls are in control.
Manage your levels accordingly
