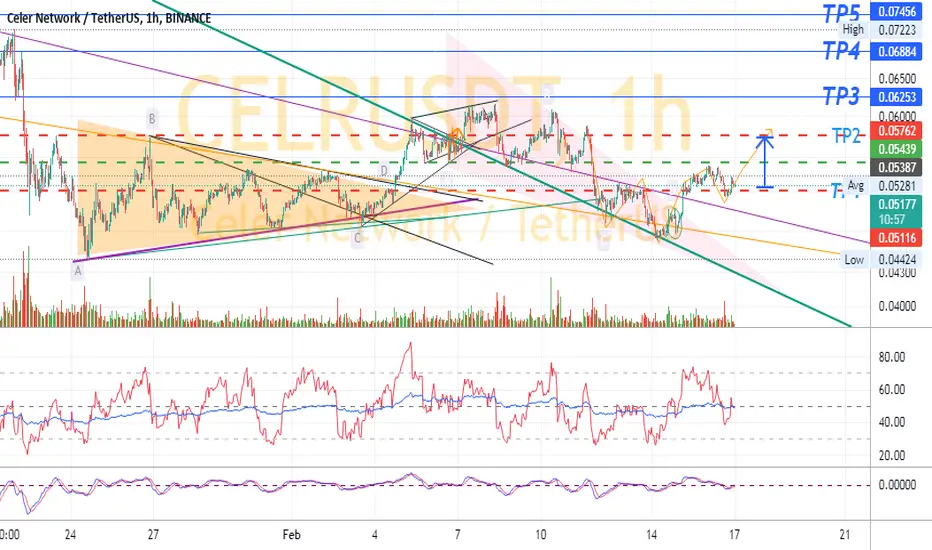
CELR/USDT If the green trendline breaks the price upwards. And Polbeck hit it. Strong uptrend is confirmed.
And if it does not, as before, after reaching one or two set goals, it returns to the 0.040 to 0.050 channel.
CELRUSDT trade ideas

without any trouble . Comfortable and safe. CELR/USDTwithout any problem . Comfortable and safe.
Of course, news and possibilities must be considered.
War news. Corona virus, Federal Reserve news and interest rate announcements and Federal Reserve decisions to curb inflation.
Disclaimer.
This is a personal analysis and not a basis for buying and selling.
Don't forget risk management, step-by-step buying and capital management.
Be successful and profitable.
CELR-Long tęrmHi This is only my opinion. I think the CELR has reached a new level…
Resistance: 0,0759$(when we break it next resistance will be 0,1000$)
Suport: 0,06674$, 0,06630$
Maximally tested 0,061$

CELR blasting off- Solid chart
- Solid team
- Down 80% and ready for a comeback
- TVL continuing to grow
- Very active on social media
Checks all the boxes for a fast growing project.

Learning Wyckoff Distribution as RedistributionThe purpose of this idea is to give beginner analysists a introduction to some key principles and methodology used in understanding the movement of price within markets. One of those key principles is Market Phases, and we also use the Wyckoff Method to help us understand these Market Phases further.
------------------------------------------------------------------
What is Wyckoff Method & Intro to Distribution
------------------------------------------------------------------
"One objective of the Wyckoff method is to improve market timing when establishing a position in anticipation of a coming move where a favorable reward/risk ratio exists.
In accumulation, the shares purchased outnumber those sold while, in distribution, the opposite is true. The extent of accumulation or distribution determines the cause that unfolds in the subsequent move out of the TR ."
Wyckoff Theory & Schematics give us clues to which probable direction the price may head out of the horizontal moving price structure.
Reaccumulation is the continuation of Accumulation whilst Redistribution is the continuation of Distribution.
------------------------------------------------------------------
Distribution
------------------------------------------------------------------
I have attached a cutout from "Stocks & Commodities V.32:8 (14-18): The Composite Man's Bull Market Campaign by Pruden, Fraser, Bogomazov for educational purposes.
In this picture, described is the characteristics of Wyckoff Distribution
In a Distribution Trading Range two of the key characteristics are the UTAD (Upwards Thrust & Distribution) above the Trading Range, and the SoW's Signs Of Weakness's with strong volume at the bottom end of the range, trapped buyers above the trading range.
Distribution is one of the 4 Market Phases which we will learn about at the end of the the writeup.
------------------------------------------------------------------
Redistribution
------------------------------------------------------------------
After Distribution, Comes Redistribution.
Where after a extended down move, a repeated sideways movement occurs which leads to another downwards thrust.
By using the characteristics and schematics to identify Distribution we can also identify Redistribution using the same methodology. This also works with Accumulation & Reaccumulation, by looking for the characteristics of Accumulation inside Reaccumulation. (Read further to understand this concept)
So as you can see on the CELR Chart the characteristics almost match the picture Distribution identically, we can see at the Upper Range every time a breakout occurs it is quickly shut down by sellers indicating a strong presence of Supply. Eventually the UTAD occurs where buyers are trapped which is then followed by the price cascading down. The only difference is that this is a potential Redistribution instead of Distribution.
Redistribution is something many analysts struggle with and can be difficult to identify.
------------------------------------------------------------------
Using Market Phases to gain further understanding of the Market Direction:
------------------------------------------------------------------
The four Market Phases are.
Accumulation
Reaccumulation
Distribution
Redistrubution
Market Phases explained further: (Dont Miss This Idea If You Are A Beginner!)
(Additonal Infographic)
ibb.co
Now looking at the LONG TERM chart for CELR, we can see the current trading range of the Above idea (Marked in orange on the current chart below) is potentially Redistribution.
------------------------------------------------------------------
Further Reading & Similar Ideas
------------------------------------------------------------------
Learning Wyckoff Redistribution:
Learning Distribution:
For more information check out Stockcharts.com, Wyckoff Introduction & Tutorial for beginners.
school.stockcharts.com
Distribution Schematic:
school.stockcharts.com
------------------------------------------------------------------
Final Thoughts
------------------------------------------------------------------
By using the Wyckoff Methodology to look deeper into our Trading Ranges we can potentially have more clues in successfully identifying the 4 Market Phases described above.
So far our clues are showing us this current trading range on CELR may be showing weakness and probability of lower prices. Unless CELR manages to get back above the 0.075c area with strong Buying volume lower prices are probable here.
If found the idea insightful you can show your appreciation by sharing it or giving it a like, feel free to leave your thoughts and criticisms in the comments and thank you for reading!

CELER
Do you know what a fractal hypothesis is?
The large green structure (1) consists of 5 yellow waves
5 yellow waves are formed of 5 white microwaves
So we can say: wave ((3)) is also forming with the appearance of wave ((1))
But with the difference that the main wave 3 is longer and longer than the main wave 1


CELR/USDT BREAK OUT! READY TO TEST A NEW ATH!!Hello everyone, if you like the idea, do not forget to support with a like and follow.
Welcome to this CELR/USDT TRADE setup. CELR looks good here.
CELR is breaking out from the bull flag like structure in 2days time frame. It also breaks the 50ma resistance.
Previously, when it breaks this kind of similar bull flag we have seen a 500% move so now I'm expecting the same.
Buy as low as possible and hold it for few months.
Entry range:- $0.048-$0.058
Target:- 500%
SL:- $0.042
If you like this idea then do support it with like and follow.
Also, share your views in the comment section.
Thank You!


$CELR- Also Gettig Ready$Celr need to pop that resistance at 0.61 to climb back the upper trend line
Lets see if it can get this done soon!!

CELRUSDT: Elliot Harmonic Trading 4HHi friends .I see the path of CELRUSDT is this way . I hope you use to this analysis and see the last my analysis about other currencies. be profit.

Celer Network Can Jump by 160%Celer Network (CELRUSDT) has gone above EMA50 and is now growing strong while above this indicator.
We can see strong green candles the past few days and volume is yet to come in... At this point, low volume signals that the strong bullish action is yet to happen.
We can see fast growth short-term happen next.
We have the bullish MACD and strong RSI as confirmation.
Check the chart for the targets.
Namaste.

CELR/USDT 2022 March Madness?Overall, CELR has demonstrated higher highs, higher lows since Mar 2020.
Following a new low, once RSI pops up above 41, this has been an indication of a bullish trend.
CELR may climb up and sprawl in ranges indicated by two green boxes, before popping up to test ATH. Based on fib retracement, CELR could strike a new ATH upwards of $0.30. Perhaps this occurs in or around Mar 2022.
However, all must hail BTC.

CELRUSDT H4Hi Guys, According to the scenario of increasing bitcoin, there are two scenarios for increasing in this currency. The best entry in case of pullback is 0.038. If you do not reach this point, you should wait for break at 0.048 level and then enter.
(DYOR)
👤SecondChanceCrypto
📅26.March.22
⚠️(DYOR)

⚡️ #CELR/USDT - Potential 135% ⚡️⚡️ #CELR/USDT - Potential 135% ⚡️
🌕"Ask not what $LUNA can do for you, but what you can do for $UST "
🌉 Testnet is live on Celer cBridge
🦄 Mainnet coming soon!
Entry: 4220 - 4779
TP1: 5409
TP2: 6091
TP3: 7473
TP4: 8897
YOLO: 9975
SL: 3813 or HOLD

Celr Bullish BreakoutU can see my targets in the green 💚 line. Do follow me for more ideas like this.


Celer Network CELR Price Targets and Stop LossCELR/USDT
Entry Range: $0.037 - 0.046
Price Target 1: $0.057
Price Target 2: $0.072
Price Target 3: $0.094
Stop Loss: $0.030


resistance supportedusing waves and lines of supported lines and resistance and pullback .I entered the long position


Celer Network (CELR/USDT) Analysis 📈📉Hello Crypto community Welcome to this introduction for another high potential crypto project.🚀💰
🔹Rank # 169,/ kind : ETH TOKEN / Market Cap:$266,699,412===> SO SO ✅
Total Supply: 10B CLER /// Circulating Supply: 6.52B CELR (~ 65 %) ====> great ✅
Holders Statistics: Top 10 Holders==> 83.44% % //Top 20 Holders 91.06% ===> risky ❌📛
🔰What Is Celer(CELR)?
Celer Network is a layer-2 scaling platform that brings fast, secure and low-cost blockchain applications on Ethereum, Polkadot and other blockchains to mass adoption. Celer launched the world’s first Generalized State Channel Network and continues to push the frontier of layer2 scaling with advanced Rollup technology. Core applications and middlewares like cBridge, layer2.finance and more ecosystem applications built on Celer have attracted more large audiences in DeFi, blockchain interoperability and gaming space.
coinmarketcap-www.celer.network
------------------------------------------------------------------------
📈📉 TECHNICAL
As you can see on the WEEKLY timeframe for CLER/USDT , It is trading about $0.04 right now.
Since 20 SEP 2021 ,after recording a new ATH (0.198 $) ,
it has been declining and had deeper retracement by
crossing under of 14EMA with 20EMA and 50EMA . and
recently it went down the pivot zone and has attempted
to breakout lower uptrend line and now it is struggling
with it, so now it can easily touch the support zone if
breakout the trend line , but in the short time it can retest
and have a pullback under pivot zone before further fall
although if it go above the resistance zone it can start a rally
,but take it in mind, if it lose this green support area ,
in this case it can have further fall again even to lower
Fibonacci support levels.
🛑resistance level: $0.105-$0.126
🆚pivot zone: $0.05-0.06$
❇️support levels: $0.02-$0.0288/ $0.01396 /$.0076/$ 0.0033
--------------------------------------------------------------------------------------------------------------------
👉This analysis is my personal opinion ,not a financial advice ,so do your own research.
💜 if you're a fan of my analyses PLZ follow me ,give a big thumbs 👍 and drop comment 🗯💭
