CELRUSDTIt will be looking nice on Q² in 2025, for spot traders we need at least 120 day's to wait for the pair to regain momentum.
CELRUSDT trade ideas

Celr 30% movefirst of all know that i am still learning using Elliott theory.
according to my knowledge, Celr has landed in the GOLDEN zone, also note that there happend to be a support line in this zone which will increase the posibilty of Celr to make a pump.
Also notice that there is a Bearish FVG at the top> this increases the chance of a pump towards this FVG.
Entry: now.
target 1: 0.023 partial sell.
target 2: 0.025 sell all.
if there are any mistake using the theory please comment below
:this counts for anything i use or said:
questions? feel free to ask!

Celer Network (CELR)CELR Analysis
🔹 Overview:
CELR is a Layer 2 solution designed to enhance blockchain transaction speed and reduce fees. The token has been trading in a long-term range between 0.009 and 0.033. After reaching the top of this range, the price has started a corrective move to the downside.
🔹 Key Levels:
1️⃣ Support Levels:
🔸 Fibonacci 0.382: 0.020 - 0.019
🔸 Fibonacci 0.5: 0.018 - 0.017
🔸 Fibonacci 0.618: 0.016 - 0.015
🔸 Range Bottom: 0.0105 - 0.009
2️⃣ Resistance Levels:
🔸 Range Top and Weekly Resistance: 0.03038 - 0.03590
🔸 Target 1: 0.068 - 0.081 (Fibonacci 1.618 level)
🔸 Target 2: 0.14 - 0.19 (Fibonacci 2.618 level)
🔹 Volume and Entry Signals:
🔸 Volume Trend: Increased volume at the weekly resistance level is a strong indicator for a breakout move toward higher targets.
🔸 RSI (Relative Strength Index):
A breakout above the RSI overbought zone could confirm a strong upward trend.
Holding key RSI support levels can act as an early signal for price recovery.
🔹 Scenarios:
✅ Bullish Scenario:
If the price breaks above the red resistance zone at 0.033 - 0.035 and holds with strong volume, it is likely to move toward Fibonacci targets at 0.068 - 0.081 and 0.14 - 0.19.
⚠️ Bearish Scenario:
If the price fails to hold Fibonacci support levels, we may see further downward movement toward the range bottom at 0.0105 - 0.009. A breakdown below this level could trigger deeper price declines.
🔹 Conclusion:
📊 Entry Zones:
Gradual Entries: At support levels 0.020, 0.018, 0.015
Safe Entry: Upon a confirmed breakout above the red resistance with high volume.
📉 Stop-Loss: A break below the 0.015 - 0.013 range signals a potential invalidation of bullish setups.
🔑 Recommendation:
Given CELR’s low market cap, this project carries a high investment risk. Proper risk management and position sizing are crucial.
🔍 Confirmation Signals:
✅ Volume increase during breakout above resistance
✅ Positive reaction to Fibonacci support levels
✅ RSI holding support or breaking into overbought zones
Final Note: Always manage risk and approach trades with a clear plan. The crypto market’s volatility can be both an opportunity and a challenge. Stay disciplined and aim for consistent, reasonable gains. 🚀

#CELR/USDT Ready to go higher#CELR
The price is moving in a descending channel on the 1-hour frame and sticking to it well
We have a bounce from the lower limit of the descending channel, this support is at 0.02363
We have a downtrend on the RSI indicator that is about to be broken, which supports the rise
We have a trend to stabilize above the moving average 100
Entry price 0.02422
First target 0.02541
Second target 0.2690
Third target 0.02867


celr bullish after breakout on weeklyThis is a perfect consolidation pattern with the resistance breakout. The rise can be completed by 200% to 300%

CELR GO TO $0.035 SOONHello,
If CELR reach $0.035 with a strong candle next target will available as soon as possible.
Will soon see high targets.be Lagged behind from market.
Second target is $0.073
Thank you


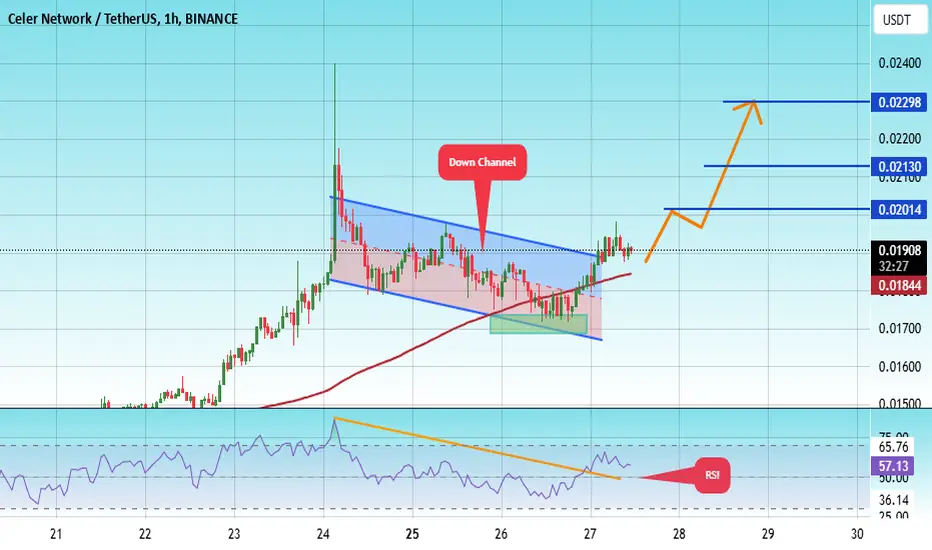
#CELR/USDT Ready to go up#CELR
The price is moving in a descending channel on the 1-hour frame and sticking to it well
We have a bounce from the lower limit of the descending channel, this support is at 0.01690
We have a downtrend on the RSI indicator that is about to break, which supports the rise
We have a trend to stabilize above the moving average 100
Entry price 0.01903
First target 0.02014
Second target 0.02130
Third target 0.02230
Celer Going Higher: The Multimillionaire, Trading PsychologyCeler Network has a solid chart. We can see higher highs with a flat bottom, always a positive sign.
The support range that precedes each bullish wave is always the same and it has been activated. We are seeing a break above local resistance and rising volume. This is short-term action but we are looking at long-term potential.
Short-term it is starting to move but it can take a while before strong growth develops. We can see some up followed by another move down and mixed action for a while. See how it happened in 2023. After the low in August, which is similar to the recent low, it takes almost 6 months of rising prices before the final jump.
Say the August 2024 low is the bottom. We can see rising prices, mild in strength and the same dynamic, 4-6 months of growth in preparation for the last move which is the bull-run. The bull-run can last 1-2 months at max.
The difference between the past and what will happen in the future is all about size. These waves in the past are very small compared to what we will experience in 2025.
So the consolidation is the same; the middle portion of the action is the same; most of everything will feel and look like the same; but, once the final portion of the bull-market approaches, the fifth wave, we will have massive growth and this is what we call the bull-run and new All-Time Highs all across. There will definitely be euphoria across the market and the numbers can go beyond the chart.
There are higher targets not shown here for this pair. Potential is huge in 2025 so get ready because this is the opportunity we've been preparing for.
There will be hundreds of chances to get it right and also many instances where we can make mistakes and get it wrong.
We need to practice now, prepare now.
We need to know exactly what we want, a clear mind, in order to be able to achieve our desired results.
It is all in the mind.
We already have the experience, the numbers and the charts.
We know what is going to happen so potential limits will not be market related but personal stuff.
How is your health?
Have you been taking care of your health?
You need health to enjoy wealth.
How is your relationship?
Are you lying to yourself or to your partner?
If you are lying, this will reflect in how much money you can make and keep.
If you are being lied to, this can very easily block any success.
Taking care of our relationships is also very important, everything personal needs to be taken care of, because once we have the map, the charts and the numbers what follows is the personal stuff, this can get in the way.
If you set some goals, short, mid and long-term, it makes it easier to achieve them later on because you already have a clear idea of what you want. If you leave everything up to chance, well, as soon as there is some excitement this excitement can lead to mistakes and some mistakes can be very costly specially when the market is high up.
We can make some mistakes after years of preparation and work that can make the difference between a 250K profit and 2M or 3M total cycle profit. It all becomes mental at a certain point.
When we are down, we think everything is physical and that a certain amount can fix all of our problems.
As soon as money starts to flow in, we realize that it was not about physical problems but it is all in our psyche. It is pretty interesting to say the least.
It goes from trying to earn and make money to realizing that we are living, growing and evolving.
It goes from, "I need x amount to reach my goals" to, "Now I know my true wishes and desires and can see the hidden fears and frustrations that were causing me to fail and fall."
I'll be your guide.
Thanks a lot for the support.
Namaste.

CLER Ready for the big JUMP(CELR)
Ready to pump! A break at 0.02593 will give you a long position.
Remember, you are responsible for all positions you take! This is an analysis; please follow up on the necessary confirmations yourself.
Don't forget to follow us!
Short-term target levels:
Target 1: 0.03578
Target 2: 0.07090
Keep in mind that these targets are short-term; if you intend to hold for the long term, you can hold for a longer period.

Catch a Golden Opportunity: CELR Network's Historic Rally🔥 CELR Network Analysis 🔥
Since March 2020, CELR had an impressive 20,000% growth, reaching $0.20 before entering a consolidation phase. In August 2024, it hit a historic bottom at $0.008. Now, it’s showing strong momentum again, potentially in the early stages of Wave 3 or Wave C.
🔑 Key Resistances to Watch:
1️⃣ A dynamic trendline resistance formed by the $0.20 and $0.04 peaks. Breaking this could signal a higher-risk entry.
2️⃣ A static resistance at $0.04. If broken, it confirms a trend reversal and offers a safer entry point.
🎯 Targets:
Target 1: $0.21 (~400% profit)
Target 2: $1.40 (~3,200% profit)
📌 Summary: Breaking these resistances could lead to a massive upward move. Keep an eye on CELR—it could be a golden opportunity to ride a big wave! 🚀

$CELRUSDT - Free Zone PenetrationBINANCE:CELRUSDT - Ready for penetration. No serious resistance levels above. Pump should be incoming soon. All the best.

CELR USDTBullish Divergence on the weekly. Above 0.02 movement gets gradually easier until we get to 0.04


CELR - Target $0,07 - Triple bottom break outCELR looks great on the weekly timeframe. Price has bottomed out and can increase the comming weeks to $0,07.

CELRUSDTCELR ~ 1W
#CELR So far this support block has been able to keep prices from dropping lower. If you have Conviction on this coin, It's not bad to start buying from here. at least for 20%++ profit

CELRUSDT FOR BUY.Price was previously bearish, price broke out of the trendline and resistance zone which signals a change of trend. Price broke out and retested the resistance zone.

#CELR/USDT#CELR
The price is moving in a descending channel on the 1-hour frame and is sticking to it well
We have a bounce from the lower limit of the descending channel and we are now touching this support at a price of 0.01231
We have a downtrend on the RSI indicator that is about to be broken, which supports the rise
We have a trend to stabilize above the moving average 100
Entry price 0.01263
First target 0.01377
Second target 0.01474
Third target 0.01587

CELR BULLISHCELR has currently broken the resistance it could not break for 3 months. When it tests this level, the targets will be as in the chart.

CELRUSDT Elliott Wave PredictionThought I would post this because I think the chart is interesting. I am expecting continued upside for some time based on the possible wave count and the most interesting thing about the chart is the massively overshooting B wave off wave 1. This phenomenon is all over the alt market. It shook a lot of people out and it will also mess up a lot of traders' targets if they do not interpret it correctly. I hope this is helpful!

#CELR/USDT#CELR
The price is moving in a descending channel on the 12-hour frame and is sticking to it to a large extent and it was broken upwards
We have a bounce from the lower limit of the channel at a price of 0.01000
We have an upward trend on the RSI indicator, which supports the rise
We have a trend to stabilize above the moving average 100
Entry price 0.0110
First target 0.01219
Second target 0.01380
Third target 0.01520
