CELR Chart BreakoutThe price formed a triangle pattern, historical Level breakout and completed the pullback to the historical level. The possibility of price growth to the specified levels.
CELRUSDT trade ideas

celr 2.0 mainnet launch Celr launches 2.0 mainnet in mid-to-late November
I predict there will be a big increase

Celer Network (CELR) / USD - Hidden Bullish DivergenceFollowing a near 70% correction since mid-August and oversold condition (orange column), the above 2-day chart is now indicating a reversal in price action is very probable.
On the same chart above there is Hidden bullish divergence between price action and the oscillators that follows a regular bullish divergence. In addition volume is seen to be increasing alongside the divergence.
Looking left on the on the 4-day chart below previous price action resistance is broken as the above hidden bullish divergence forms - very bullish.
1st target 16 cents / 200%

$CELR- Ready Or Not?Celr has been in this elongated corrective journey after hitting a new ATH on the 26th of Sept.
And i think it is ready to begin another trip up.
Still at a good rebuy zone for a swing trade
Currently break out from a bullish DB pattern formed on the LTFs and i am expecting this to touch like 0.158-0.160 before support retest and then continuation up.

$CELR following $ONEHI everyone,
great buy opportunity on celr, maybe it won't see this price later(last opportunity for holders)
I buy here...big profit incoming

celr usdtCELR is preparing for a move forward
Currently there is more potential for upward movement, in which case a specific target can be achieved.
If the movement is downwards, the correction can continue up to 0.1, which is a buying opportunity

my idea for CELRUSDT SPOT TRADINGCELRUSDT broked the triangle pattern to bullish
price can go further uptrend

celr coinif it breaks out the break point we will see that targets to 0.19 with 34 % do ur choice .
support at 0.12 and 0.12
enter 0.14 and 0.15


Not a good time to arriveIf we look at the daily timeframe, we find that the five Elliott ascending waves are over and now we have to enter the ABC correction phase, or the zigzag pattern.
I consider an important line of support and resistance for this currency, which determines its trend. If the rectangle is broken, the downtrend and confirmation is DOUBLE - TOP and the drop to MA 200 daily is in the range of 0.06. If 0.2 is broken, confirm the new uptrend with new targets, which must have strong market conditions and news to be broken.
In terms of Ichimoku, the Chico Span line (green line) has entered the chart, which shows the trend in place, and the future cloud has thickened. The negative crossings of Tennenson and Kijonsen also confirm the downward trend of this currency. I think we should wait and not enter now.

CELR is breaking the downtrend to BTC and to USDTCELR/USDT is breaking the second downtrend after the failing of the first breaking. Now it has been prepared well and will go up to its ATH.
Meanwhile, CELR/BTC is breaking the first downtrend.

CELR/USDT 1HOUR UPDATE Welcome to this quick celr/usdt analysis.
I have tried my best to bring the best possible outcome me in this chart.
Reason of trade :- celr/usdt analysis is Breakout and after retest 50 moving average and buy
green zone
Entry:- CMP (buy green zone)
Target:- 10% to15%
Stoploss:- $0.12775
Remember:-This is not a piece of financial advice. All investment made by me is under my own risk and I am held responsible for my own profit and losses. So, do your own research before investing in this trade.
Happy trading.
Sorry for my english it is not my native languages.
Do hit the like button if you like it and share your charts in the comments section.
Thank you...

CelrUsdtwe saw a clear divergence in the RSI and weekly timeframe. I think celer needs a correction on this point. the support point for entrance determined in the chart


celr hihi
celr$ is in a channel if it doesnt break down that
we can goes up to top of the channel 0.18
please dont trade with all of your usdt just 50% ....then if it pour without goes up you shoud buy in min price ...ok?
i hope so
god willing

Long celr (see the discription for proper tp's and stop loss)CELR UPDATE :: If we see the graph we can see there was a symmetrical triangle forming in the past where we see a break out till 0.19 and now is the same scenario again forming a symmetrical triangle ready for the breakout now you can take the entry again around 0.134-0.136 with stop loss of 0.124 it should not go below then 0.1325 but it can make one wig till 0.124-0.128 and again up so for the safest side you can move you stop loss till 0.124 - 0.128 TP'S are marked in the chart 0.144 - 0.15 - 0.157 - 0.165 - 0.174, if you trade safely it can give you good gains in the upcoming week inshallah.
BUY range :: 0.134-0.136
TP1 :: 0.144
TP2 :: 0.15
TP3 :: 0.157
TP4 :: 0.165
TP5 :: 0.174
SL :: 0.124

bullish pennant pattern on 2h timeframebullish pennant pattern on 2h timeframe for #celrusdt ... best time for entry... long for days.

CELR Ready to Moon - [New Matic]I ama waiting huge move from CELR. It has huge potential. Very good project like Matic. I hope I am not wrong. It is not investment advice.
*In the future, the celr may be worth $1 or more.

ks ks ksmandjha sjcjans jancjnaj anancia ajckaci anskcnak scm ks ks ksmandjha sjcjans jancjnaj anancia ajckaci anskcnak scm ks ks ksmandjha sjcjans jancjnaj anancia ajckaci anskcnak scm

After short correction , it can be expected to go up !!!According to the Eliot wave analysis and weekly trend line and also existing divergence between chart and RSI , it can be expected that price after short correction will go up.
Please be aware that my analysis may be wrong , so make decision based on your analysis .

CELR Breakout! 🔥💥⚡It's time to buy Celer again. $CELR has broken a downtrend and is ready to move towards his higher goals. The 20 cents target is suitable for the short term. The loss limit is not at 13.4.
Currently, due to the increase in the bitcoin range and its movements, all altcoins will be affected by it. The analysis is just a series of probabilities.
I hope you find this analysis useful🌹
Follow for more...
#DYOR

celrusdt(celrusdt) after a strong rally looks like a double top pattern and due to divergence (RSI) and reduced trading volume can be expected to correct

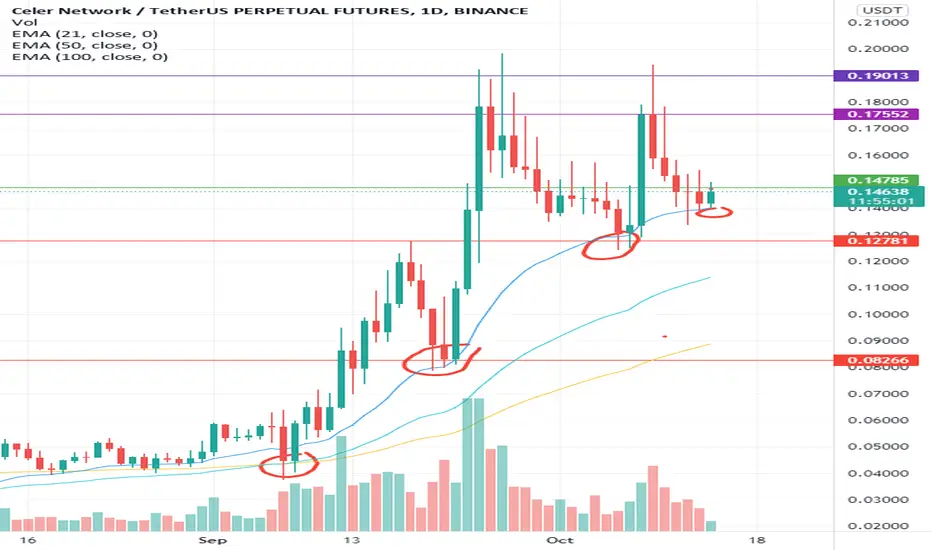
CELR bounced from EMA 21 -> possible target 0.19Last 3 times CELR touched the EMA 21 it bounced hard. I am expecting it will do the same a 4th time.
TP1: 0.175
TP2: 0.19
Adding to the position at 0.12785 and 0.08275