CELRUSDT trade ideas


CELRUSDT D4: 1000% gains THE BEST LEVEL TO BUY/HOLD(SL/TP)(NEW)Why get subbed to me on Tradingview?
-TOP author on TradingView
-15+ years experience in markets
-Professional chart break downs
-Supply/Demand Zones
-TD9 counts / combo review
-Key S/R levels
-No junk on my charts
-No MACD / RSI /MA/FIBONACCI
-Frequent updates
-Covering FX/crypto/US stocks
-24/7 uptime so constant updates
-no moonboy/crazy targets
-TA that makes sense and
-setups that payout
CELRUSDT D4: 1000% gains THE BEST LEVEL TO BUY/HOLD(SL/TP)(NEW)
IMPORTANT NOTE: speculative setup. do your own
due dill. use STOP LOSS. don't overleverage.
🔸 Summary and potential trade setup
::: CELRUSDT 4days/candle chart review
::: accumulation in progress now
::: bullish 5 waves sequence
::: chart is LOG SCALE
::: get ready to BUY LOW later
::: BUY LOW near 0.025
::: entry - April/May 2021
::: CORRECTION MODE soon
::: once wave3 is complete
::: will last 2-4 weeks
::: up to 1000% gains possible later
::: short-term pullback/correction
::: wave4 correction/pullback
::: correction/pullback is 75%
::: however chart looks strong
::: SPECULATIVE SETUP
::: do your own due dill
::: and use proper risk management
::: TP bulls is +1000% gains
::: details: see chart
::: recommended strategy: BUY/HOLD after pullback
::: TP BULLS +1000% gains
::: SWING TRADE: BUY/HOLD IT
::: bull run not over yet
::: good luck traders!
::: BUY/HOLD and get paid. period.
🔸 Supply/Demand Zones
::: N/A
::: N/A
🔸 Other noteworthy technicals/fundies
::: TD9 /Combo update: N/A
::: Sentiment mid-term: BULLS
::: Sentiment short-term: PULLBACK/WAVE4
RISK DISCLAIMER:
Trading Crypto, Futures , Forex, CFDs and Stocks involves a risk of loss.
Please consider carefully if such trading is appropriate for you.
Past performance is not indicative of future results.
Always limit your leverage and use tight stop loss.

Crypto Market & CELER Technical Analysis & Predictions 3/14/21*DISCLAIMER: I am not a financial advisor and this is not financial advice or a recommendation to buy or sell as these are purely my opinions and speculations. I may also own or trade any of the symbols and cryptocurrencies mentioned in this video so do not make your trading or investing decisions based on this video. I do not guarantee any results nor am I responsible for your actions. You should always do your own due diligence before trading or investing in this market as it is extremely risky. Affiliate links are also included in this same video description section here and if you decide to support me by using any of them, I may receive a referral bonus or commission.
*Follow me for the latest cryptocurrency analyses on my watchlist
*Thank you to those who donated, I very much appreciate it.
*Let me know in the comment section if you agree or disagree, would love to hear your ideas too.


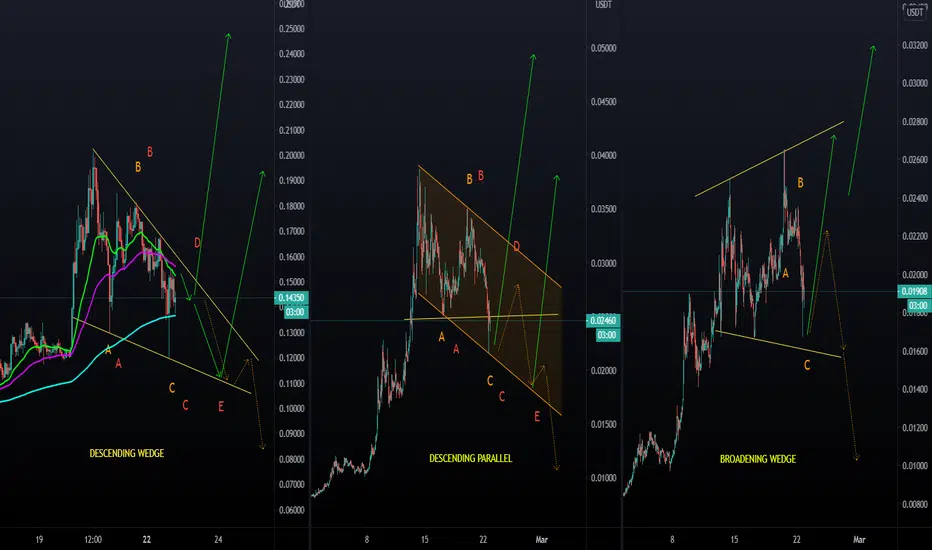
While BTC went down.. Alts crashed.. OR .. corrected?I present 3 layer 2 solution alts with 3 similar ABC corrections, but with 3 different structures.
In case this correction is finished we can clearly see an ABC correction, which could interlude a new bullrun.
On the other hand BTC has dropped from a significant high, and failed to reach the 60K, though we remained above the 1T BTC market cap as this is an milestone in history and could indicate a support level.
Bitcoin just had 1 leg down (on a smaller scale there was a leg down as well, but not as great in comparison as this one).
Alts had 2 legs down, and so if bitcoin would have a new visit to lower levels, we might have an ABCDE correction.
Worst case, we could have a major BTC correction in which we don't know yet how ALTS would behave, but they would probably outperform to the downside as well...
So be careful with trades and risk mgmt. On the other hand I don't quite believe on the long run we are done.
These alts are a free sample of what still undervalued top-coins look like.
So I am mostly long, but I don't have enough data to completely back my theory.
Celer to 0.013 USDT (50% drop)Sold CELR here, target on the chart, as per analysis. Please use proper RRMM.


CELRUSDT - Long - Potential 9.79%CELRUSDT - Long - Potential 9.79%
Entry- 2800
TP1- 2897
TP2- 3040
SL- 2551
- Trigger - Pullback
- BTC - Stabilising
- RR - 1.4
- Trailing Buy - 1%
- Trailing Profit - 1%
- Trailing Stop-Loss - no

CELRUSDT Four hour divergencethree confirmations of four-hour bullish divergence on the cycle RSI indicator. Fibonacci price and buy targets on the chart. Good luck!


[CELRUSDT] Bullish formationHi everyone! :)
CELR Network is looking good on 4H/1D TF.
Bullish MACD and RSI divergences.
Bullish ascending triangle formation.
If it breaks 2600 (biggest resistance ever on CELR), we can expect it to go for another price discovery.
Wait for more volume for confirmation.
What do you guys think about CELR's chart? Feel free to drop a comment!
This is not an investment advice, just sharing my thoughts.
Good luck!

Daily close is in, Bearish div on CELRUSDT confirmed Looks to be a great entry point once it ranges back to the bottom of the trend
$CELR
40c incoming :)

CELR looking mighty tastyJust came out of its BARR trend could look to restest to confirm and run off to the absolute moon!
Long Term
Hodl fellas
Parabolic curve second wave incoming.
