CELR ANALYSISExamining the CELR waves, we found that the CELR symbol is inside a diametric pattern that is now rising to complete the F wave.
For risk management, please don't forget stop loss and capital management
Comment if you have any questions
Thank You
CELRUSDT trade ideas

What to expect from $CELR in coming weeks. is it worth buying ?Hello fam,
Wish you have a green candle on your chart, every H4, D1 and W1 !
Another coin that came to my attention recently is $CELR. a >150m $ market cap for this coin is nothing.
First of all $CELR like many other coins been in a accumulation phase for more than a year but recently showing some familiar price action and gave us hope to see its green days back.
Wyckoff accumulation looks good and price respected supports and bounced to form the reversal.
as of now price broken 0.019 level and aims for local highs at 0.02 and 0.026 but these can be short term targets.
0.06$ - 0.1$ and 0.13$ are my targets for mid term.
This pattern needs to get more confirmation by seeing signs of strength around 0.026$ ~0.028$ and must get back up around 0.021$. So be patient and wait for this chart to age well and if you are a $CELR holder like me, then good for you.
PS: there is another perspective for $CELR broken falling wedge which is interesting too and i will share with you on the next chart.
These are my wild ideas and can be wrong so please DYOR.
Stay Safe
Stay Rich

CELR/USDT$CELR
68 day accumulation period followed by a nice break out and now we are forming a falling wedge pattern, I have set alert on orange dashed line, ready to trade the breakout which will be a minimum 22% pump!
lets get it

CELR Bearish HarmonicPretty solid bearish harmonic forming on CELR the past day, eyes one the 1.618 for the negatives reaction to confirm a short entry.

CELRUSDTIf we look at the weekly time, the price can grow, but the overall trend is still bearish and this is only a pullback

$CELRtesting 200 ema on the daily
hope it comes down to white line scaled in for now invalid below blue line
expecting this to be a wick by end of day
IF not meh..

$CELRlong time no see
above 200 ema on the daily after our flush yesterday
time to get your groove on ...
imho
invalidation below 21ema

CELR COIN - BULLISH BULLThe Crypto Bull run is now going to begin, and as per technical analysis, the CELR COIN will become a rocket soon.
There are some target on cards that will hit soon.
Buy Call: $0.0157
Target 1: $ 0.0200
Target 2: $ 0.02459
Target 3: $ 0.03300
Stop Loss: $ 0.01124

Five more downwaves?Five downward waves, wave A, were created, then three corrective waves, wave B. We are waiting for another five downward waves, wave C, and thus the historical decline of the currency ends.

CELR/USDT what next? 👀 CELR Today analysis
💎 Paradisers, keep your eyes peeled! We've observed some intriguing price actions. Notably, there's been a rejection from the bearish OB, hinting at the asset's next potential trajectory.
💎 In our recent observations, the asset broke free from a descending trendline, embarking on an upward journey. Now, we're looking at two potential outcomes:
💎 The asset could experience a minor pullback, seeking support and bullish momentum from the demand level at .1305, aiming to retest the bearish OB.
💎 If it struggles to maintain its stance above the .1303 demand level, there's a heightened likelihood of it finding bullish momentum from the .1255 demand level. However, a breach below this point could pave the way for bearish tendencies.

CELR SEEMS TO GO GAME OVER A CRASH LIKE LUNA AND FTT DIDThanks for reading this update, please remember that this is not trading advice.
We expect that CELR is the next coin that will see a next free fall and game-over trend. Since the big exchanges have played the round.
We see on low time increase but this means noting for the real trend, we did expect before more crash trends on other coins.
The fake volume increase is the reason for the start of the crash. It is all about smart money and transaction data in combination with top whale holding.
The market cap and holders decrease, and the last data shows a connection with the FTT and Luna trend.
CELR is at this moment on a very risky trend as data shows and can be the next fall coins with the game over as Luna and FTT did. If this happens we expect that we will see soon a big free fall and crash trend on Celr like Luna and FTT did.
We did use the same tools to expect the crash we did before on Luna and FTT crash.
The big rule in trading, when a coin loses more than 80% of its value will stay a very risky coin even if it has a small time frame increase.
We have added what we expect, and time will learn what will happen with CELR.
This update is our view and means not to use it as trading advice.
The best traders in the world are traders who can read early data and expect a high chance of what the market can do . Nobody will be able 100% to be right, but with more chance, you can see the side.
* This crash expecting is by ASIA trend and on USDT pairs since its 94% of holding.

CELR SHOWS FALL TREND (CRASH VIEW)Thanks for reading this update, remember that this is not trading advice.
Depending on our last study CELR can meet a new breakdown in the coming time.
This study depends on the volume range and the new data shown.
A decrease of volume holders can show in the coming time frames a new fall for this coin.
There is an important rule in volume following when volume increases and market cap deincreases..

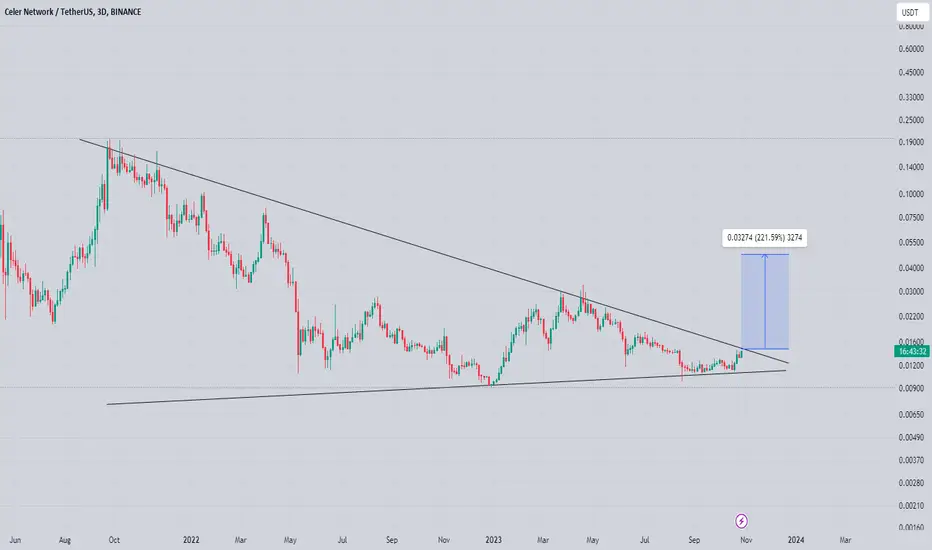
finally celr on verge of massive recovery over all in downtrend from couple of years now seems like its bottomed out recently and finally preparing for massive recovery
formed text book symmetrical triangle and expecting upside breakout incase of successful breakout expecting 200 to 220% bullish rally in midterm
$CELR Breakout Done $CELR Performed Bullish Symmetrical in 4HR tf
What is a Symmetrical Triangle
A symmetrical triangle is a chart pattern characterized by two converging trend lines connecting a series of sequential peaks and troughs. These trend lines should be converging at a roughly equal slope. Trend lines that are converging at unequal slopes are referred to as a rising wedge, falling wedge, ascending triangle, or descending triangle.
KEY TAKEAWAYS
Symmetrical triangles occur when a security's price is consolidating in a way that generates two converging trend lines with similar slopes.
The breakout or breakdown targets for a symmetrical triangle is equal to the distance between the initial high and low applied to the breakout or breakdown point.
Many traders use symmetrical triangles in conjunction with other forms of technical analysis that act as a confirmation.

ceresdtConsidering that it looks good in terms of news, but from the point of view of Wyckoff and Elliott theory, it seems dubious, however, it is better to save.

CELRUSDT.pBINANCE:CELRUSDT.P
Hello my friends
This is my analysis and thinking about this chart and I hope it gives you a trading idea
Follow me and give me a comment so that I can share more analysis for you


CELR/USDT Likely to Go for a Bullish Momentum | CELR Analysis💎Yello, Paradisers! shift your focus to CELRUSDT. It's currently charting its course within a descending channel and suggesting a potential bullish breakout.
💎For an extended period, CELR has been confined within this descending channel. The current dynamics suggest a potential move towards the Bearish OB and the overhead supply zone.
💎As it hovers in the demand zone, a breach past the .01304 threshold will amplify the chances of bullish momentum. While some novices might consider shorting at this point, it's wise to adopt a more holistic view.
💎Conversely, if the price dips beneath the .01250 demand point, there's an increased likelihood of revisiting a stronger support level. As always, it's essential to stay alert and plan your moves strategically.
💎Enhance your trading insights for CelerNetwork with ParadiseFamilyVIP. Dive deeper into our expert perspectives on CELR and other promising coins and optimize your crypto strategy

Go to 0.0027This currency has two important resistances at 0.0027 ceiling and 0.00089 floor. The average of these two resistances also has a reaction. In the lower time form, it is suffering from the descending channel and is completing the triangle pattern to exit the descending one. My prediction is a ceiling of 27

CELR By HesamUNT ( New Update )hey traders
as u can see, our last move hit the target
we touched the demand zone and price rejected with a shadow
also price playing at descending parallel channel
if the mid-line of this channel keeps the price, theres a high chance for a pump in lower TF to the upper Demand Zone
that was our previous support area and price broke it down, so we can take it as a potential Swap area and working as resistance area in next touches
it dosent mean were bullish here, this pump can b good after confirmation for scalp trades, and short at the supply zone will b the next mid-term move
there will b an update if we get there
share ur though and leave a comment

CELR/USDT Need to Break to Confirmation Bullish Movement !!!💎 CELR has undeniably piqued our interest, showcasing movement within a descending channel formation. Recently, CELR embarked on a notable upward journey after rebounding from a robust support zone.
💎 The chart reveals a promising bullish signal - the 'Three White Soldiers' pattern, characterized by three consecutive green candles. This formation typically serves as a reliable indicator of the Probability continued upward momentum. However, for CELR to fully embrace a bullish stance, it needs to accomplish one more critical task: breaking through the descending channel pattern. Probability Achieving this could pave the way for CELR to effortlessly ascend, targeting the resistance zone and possibly pushing beyond.
💎 Conversely, should CELR struggle to shatter the pattern or face rejection upon encountering the descending channel's resistance, it might retreat, seeking fresh momentum from nearby support or demand zones.
💎 The scenario grows grim if CELR, while retesting the support area, fails to muster enough strength to break through, and the support crumbles under selling pressure. Such a development could trigger a continued downward trajectory for CELR, compelling it to seek refuge at lower levels, potentially revisiting the formidable support zones or even the critical support threshold.

CELRUSDT Long/Short JUST an IDEA same story i will type...
all be pissed off..
Nothing to say...
Chart is simple n DYOR n NAFA
ThankYou....

CELRUSDT (4H) - Bullish wave We2Hi Traders
CELRUSDT (4H Timeframe)
A medium probability, entry signal to go LONG will be given with the upward break of 0.01270 after the market found support at 0.01195. Only the downward break of 0.01195 would cancel the bullish scenario.
Trade details
Entry: 0.01270
Stop loss: 0.01195
Take profit 1: 0.01365
Take profit 2: 0.01470
Score: 6
Strategy: Bullish wave We2
