XAUUSD: Buy idea On XAUUSD we would have a high probability of having an uptrend depending on the configuration of the chart.
CFDGOLD trade ideas

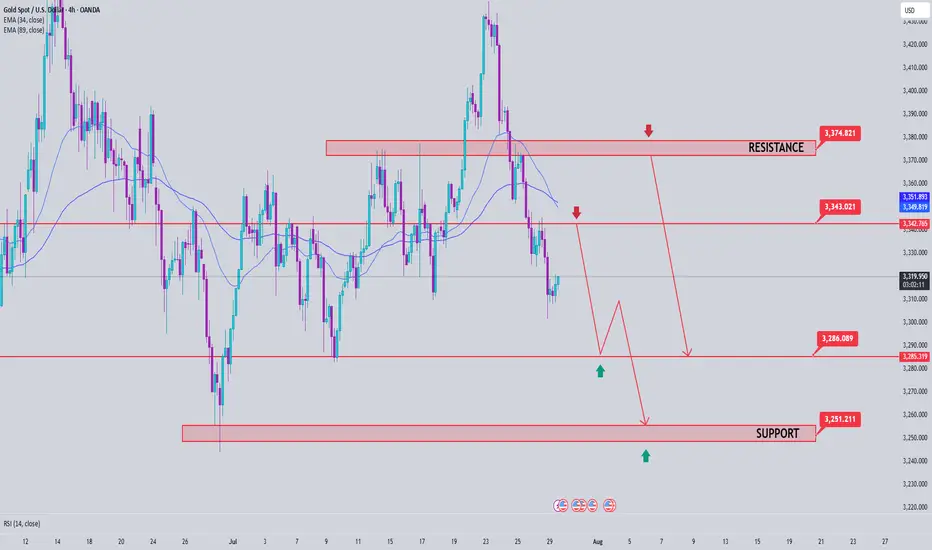
Gold Price Analysis July 29📉 XAUUSD ANALYSIS – IS THE CORRECTION OFFICIALLY STARTING?
Gold has officially broken out of the bullish wave structure and left the rising price channel – an important technical signal that the bearish correction trend has been activated. This development opens up the possibility of retests of the broken trendline, and if that happens in today's session, this could be a good opportunity to look for SELL entry points in the new trend.
📌 Short-term trading strategy:
Potential selling zone: 3343 – 3345
Downside target: 3283 first, followed by the strong liquidity zone around 3250
Confirmation of bearish force: Price continues to maintain below the 3375 area – which will act as an important resistance level. Only when the daily candle closes back above this zone will the uptrend be re-established.
✅ Reverse buying strategy if there is a strong support signal:
Buy trigger zone: Observe the price reaction around the 3285 area - there needs to be a clear bearish rejection signal (pin bar/bullish engulfing candle...)
Deeper buying zone: 3251 - where liquidity is concentrated and there is a possibility of bottom-fishing demand appearing.
XAUUSD/GOLD 45M OUTLOOK 📉 XAUUSD Breakdown Play
Caught the Change of Character (ChoCh) and confirmed the Break of Structure (BoS) at premium supply.
Price tapped into the zone, printed another ChoCh – now targeting the next liquidity sweep.
🧠 Smart Money never chases – it positions.
📍Sell: 3320 | SL: 3334 | TP: 3290
Risk:Reward = 💰

GOLD OUTLOOKMy view on Gold ..
More likely to retrace to the bearish PRZ from where i'll be looking for Sell setup on the lower time frames

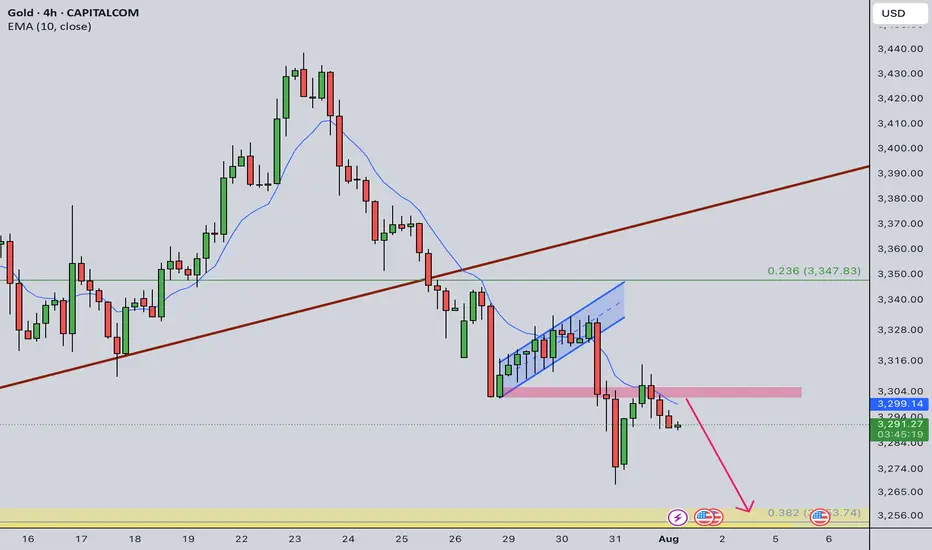
Gold Intraday Trading Plan 8/1/2025Although yesterday's retracement is a bit too deep, I am still bearish in gold in medium term as long as 3333 resistance is not broken. Therefore, I will still look for selling opportunities today.
Currently daily is in green bar while smaller timeframe shows bearish signs. If there is a double top formed near 3300, I will sell toward my weekly target at 3255.

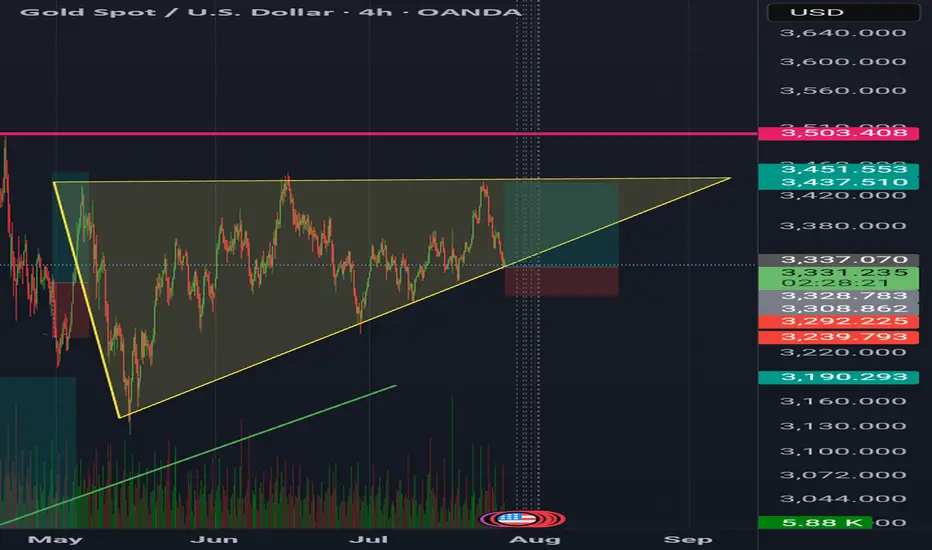
GoldXau usd daily analysis
Time frame 4 hours
Gold is moving up and down in the yellow triangle, you can see on the chart
I think Gold move up to 3450 $ and if we have no positive news, it will drop to the down side. This analysis has good benefit and Risk rewards ratio is 3
On the other hand if Gold break the 3320 $ my analysis is faild and must listen to the economic news
10 POWERFUL INVESTING & TRADING QUOTES OF ALL TIME
Here are powerful quotes of professional traders, investors and experts in financial markets.
Let their words inspire you and help you in your trading journey.
"To succeed in the market, you must learn to think like everyone else and do the opposite." - Sir John Templeton 📈💭💡
"The four most dangerous words in investing are: 'This time it's different.'" - Sir John Templeton ⏳📉🛑
"The more you learn, the more you earn." - Warren Buffett 📚💰📈
"The key to trading success is emotional discipline. If intelligence were the key, there would be a lot more people making money." - Victor Sperandeo. 💪💰🚫🧠
"Investing is not about making predictions, it's about having a plan and sticking to it." - Tony Robbins 📊🔄📌
"The best time to buy a stock is when the blood is running in the streets." - Baron Rothschild 💀🔪💰
"The best investment you can make is in yourself." - Warren Buffett 💼💡💰
"The stock market is not a casino; it's a crooked casino." - Charlie Munger 🎰🎲🏛️
"Losses are part of the game. You can't win every trade." - Martin Schwartz. 📉😔💔
"The fundamental law of investing is the uncertainty of the future." - Peter Bernstein. ⚖️❓🔮
The More I trade, the more I realize how precise and meaningful are these phrases. Take them seriously, and they will help you achieve the financial success.
❤️Please, support my work with like, thank you!❤️
I am part of Trade Nation's Influencer program and receive a monthly fee for using their TradingView charts in my analysis.
XAUAUSD ideaWe are waiting for our asset to reach our action zone, and based on the reaction, we’ll decide on our next moves.ALWAYS WAIT FOR A CONFIRMATION TO SEE IF THE PRICE VALIDATES THE ZONE.and you what is your vision of the EURUSD its interests me! i wait you in the commentary
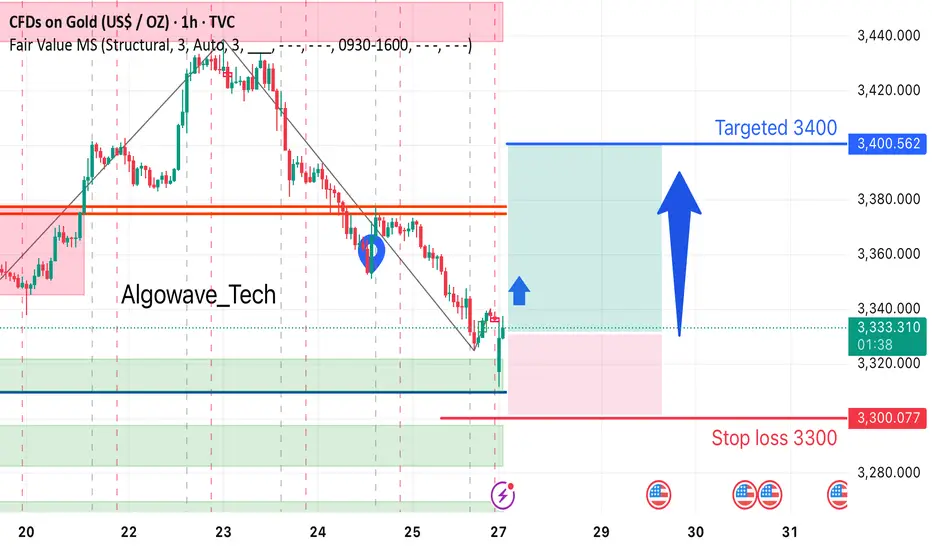
Gold Long Setup Alert!After a clean bounce from a strong demand zone, gold is showing potential for a bullish reversal.
🔹 Entry: Around 3331
🎯 Target: 3400
🛑 Stop Loss: 3300
Price has broken the bearish trendline, indicating possible momentum shift. Eyes on a push towards 3400 if bullish pressure sustains!
#GoldTrading #XAUUSD #AlgoWave_Tech #TechnicalAnalysis #BullishSetup #PriceAction #TradingSignals#Jasonwave_Fx1
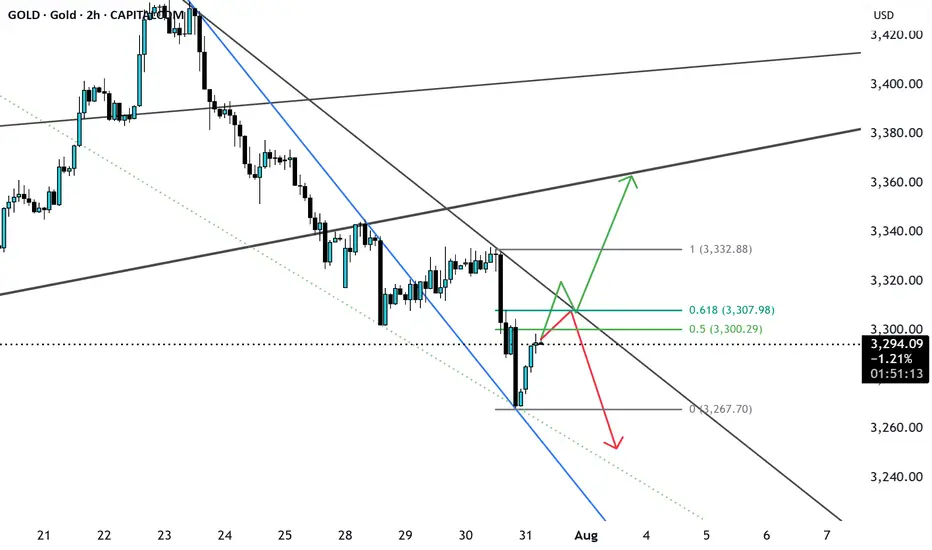
GOLD possible ScenarioCurrently gold has broken a major trendline and currently trading in bearish momentum, currently consolidating or pullback from support and may get rejected from 0.5 or 0.618 if bearish ahs to continue 3240-3250, if breaks the fib level along with trendline resistance can easily price can reach 3340 major resistance level. let us see.
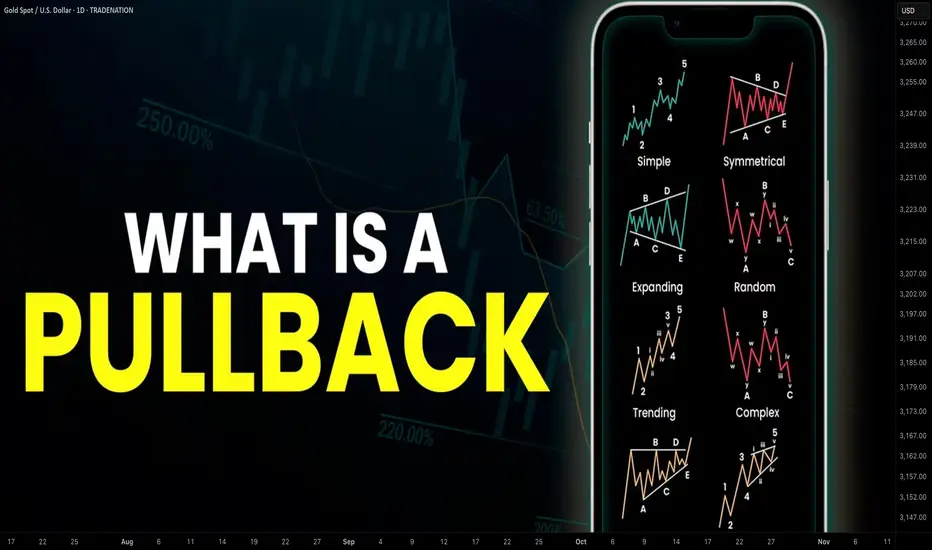
Learn What is PULLBACK and WHY It is Important For TRADING
In the today's post, we will discuss the essential element of price action trading - a pullback.
There are two types of a price action leg of a move: impulse leg and pullback.
Impulse leg is a strong bullish/bearish movement that determines the market sentiment and trend.
A pullback is the movement WITHIN the impulse.
The impulse leg has the level of its high and the level of its low.
If the impulse leg is bearish , a pullback initiates from its low and should complete strictly BELOW its high.
If the impulse leg is bullish , a pullback movement starts from its high and should end ABOVE its low.
Simply put, a pullback is a correctional movement within the impulse.
It occurs when the market becomes overbought/oversold after a strong movement in a bullish/bearish trend.
Here is the example of pullback on EURJPY pair.
The market is trading in a strong bullish trend. After a completion of each bullish impulse, the market retraces and completes the correctional movements strictly within the ranges of the impulses.
Here are 3 main reasons why pullbacks are important:
1. Trend confirmation
If the price keeps forming pullbacks after bullish impulses, it confirms that the market is in a bullish bearish trend.
While, a formation of pullbacks after bearish legs confirms that the market is trading in a downtrend.
Here is the example how bearish impulses and pullbacks confirm a healthy bearish trend on WTI Crude Oil.
2. Entry points
Pullbacks provide safe entry points for perfect trend-following opportunities.
Traders can look for pullbacks to key support/resistances, trend lines, moving averages or Fibonacci levels, etc. for shorting/buying the market.
Take a look how a simple rising trend line could be applied for trend-following trading on EURNZD.
3. Risk management
By waiting for a pullback, traders can get better reward to risk ratio for their trades as they can set tighter stop loss and bigger take profit.
Take a look at these 2 trades on Bitcoin. On the left, a trader took a trade immediately after a breakout, while on the right, one opened a trade on a pullback.
Patience gave a pullback trader much better reward to risk ratio with the same target and take profit level as a breakout trader.
Pullback is a temporary correction that often occurs after a significant movement. Remember that pullbacks do not guarantee the trend continuation and can easily turn into reversal moves. However, a combination of pullback and other technical tools and techniques can provide great trading opportunities.
❤️Please, support my work with like, thank you!❤️
I am part of Trade Nation's Influencer program and receive a monthly fee for using their TradingView charts in my analysis.
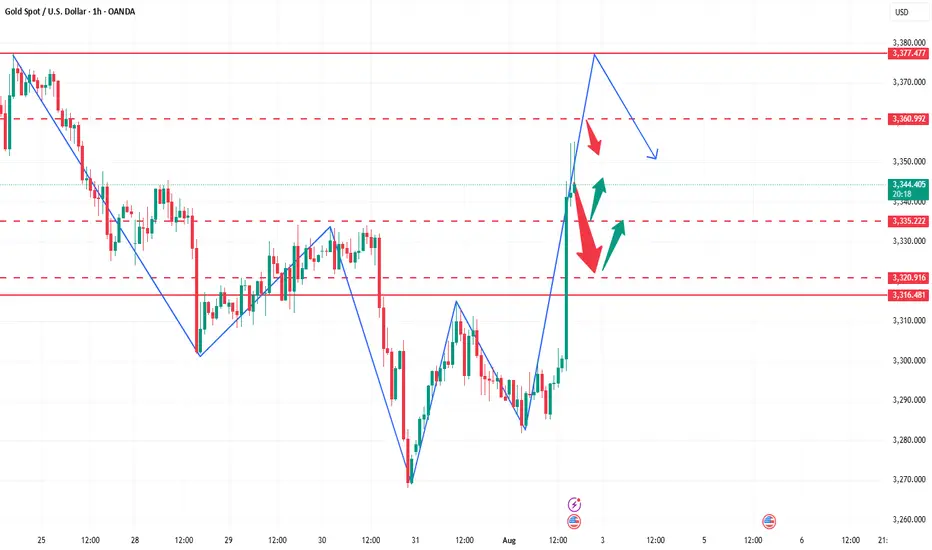
GOLD Melted , 2 Best Places To Sell Clear , Don`t Miss 200 Pips Here is My 30 Mins Gold Chart , and here is my opinion , we Again Below 3377.00 and we have a 30 Mins Candle closure below this strong res , so i`m waiting the price to go back and retest this res and new support and give me a good bearish price action to can enter a sell trade and we can targeting 200 pips , and we have a good res @ 3365.00 we can sell from it also if the price didn`t reach 3377.00 and targeting from 100:200 pips , and if we have a Daily Closure below This res this will increase the reasons for us , just wait the price to back a little to retest it and then we can sell it . if we have a daily closure aboveit this idea will not be valid anymore .

Gold Price Outlook: A Deeper Correction Ahead?Hello everyone! What are your thoughts on the current gold market?
Gold's decline is picking up speed, with the price now testing the 3,320 USD level. A stronger U.S. dollar, coupled with recent developments in the U.S.-EU trade agreement, has significantly reduced demand for gold as a safe-haven asset.
From a technical perspective, the break below the rising price channel is a key signal. It could mark the beginning of a deeper correction, as oscillators are starting to show negative momentum, indicating that the path of least resistance is now downward.
Looking ahead, all eyes will be on Wednesday’s FOMC decision. The market will be watching closely for any signs of a rate cut roadmap from the Federal Reserve, especially during Powell’s press conference. Additionally, several important U.S. macroeconomic data releases this week could provide new momentum for the USD and play a crucial role in shaping gold's next move.
What are your thoughts on where gold is heading? Let us know in the comments below!

Lingrid | GOLD Key Resistance Zone. Possible Short-Term TradeThe price perfectly fulfilled my last idea . OANDA:XAUUSD has reached the upper boundary of the resistance zone around 3,445 after a strong impulse leg from the support trendline and the breakout of consolidation. Price action shows signs of exhaustion just below the June high, forming a potential reversal pattern near the channel top. If gold fails to hold above this resistance, a short-term pullback toward the 3,385 level becomes likely. The setup favors a short-term corrective decline unless bulls reclaim control with a breakout above the red trendline.
📉 Key Levels
Sell trigger: Rejection below 3,445
Sell zone: 3,430–3,445
Target: 3,385
Invalidation: Close above 3,480
💡 Risks
Breakout continuation toward 3,480
Sustained momentum from recent impulse leg
DXY weakness boosting gold's appeal
If this idea resonates with you or you have your own opinion, traders, hit the comments. I’m excited to read your thoughts!

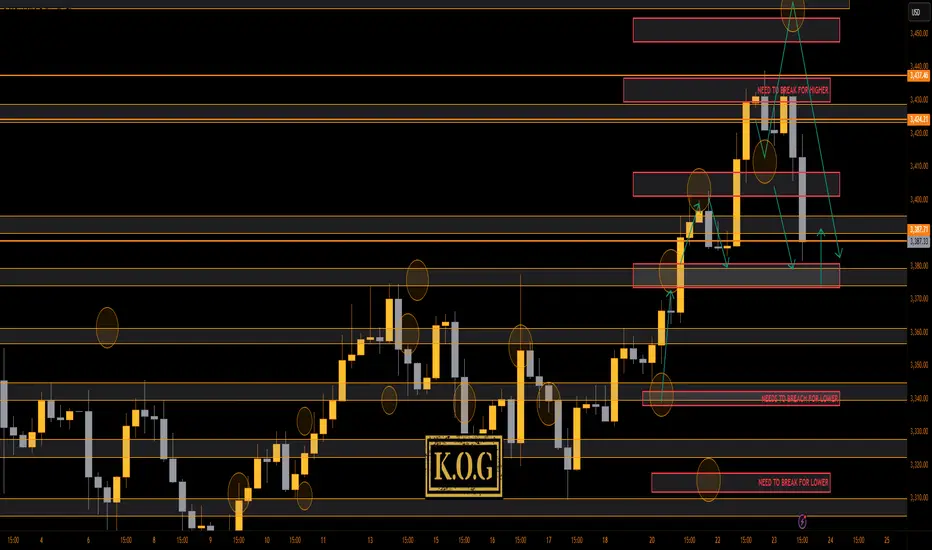
THE KOG REPORT - UpdateEnd of day update from us here at KOG:
That was worth waiting for! We were expecting higher to then short this into the level we wanted, but as you can see, we had no red box break and our bias level was 3335. That resistance gave us an opportunity early session to get in and then the break of the 3320 level confirmed the move completing a majority of our targets.
Now we have support here and resistance at the 3395 level and above that 3406. We have a lower level here of 3375 which we feel if targeted and rejected, could give the opportunity for a RIP into the higher levels.
KOG’s Bias of the day:
Bearish below 3450 with targets below 3420✅, 3410✅, 3406✅, 3397✅ and 3390✅
Bullish on break of 3450 with targets above 3455, 3458, 3464 and 3478
RED BOXES:
Break above 3435 for 3440, 3446, 3449 and 3461 in extension of the move
Break below 3420 for 3410✅, 3406✅, 3397✅ and 3379 in extension of the move
As always, trade safe.
KOG
GOLD - WAVE 5 BULLISH TO $3,734 (UPDATE)Quick & simple ‘Elliott Wave Theory’ analysis for our Gold ALTERNATIVE SCENARIO.
⭕️Complex 5 Sub-Wave Correction.
⭕️Buyers Remain Above $3,245.
⭕️Pending LQ at $3,500.

How to accurately grasp the gold trading opportunitiesGold was greatly affected by the positive non-farm payroll data, and it rose strongly, with the increase completely covering all the losses this week. The current gold trend has completely reversed the previous bull-short balance. After breaking through the 3300 level and rising to around 3355, it maintains strong upward momentum, and the possibility of further testing the 3360-3375 area cannot be ruled out. Due to the strong positive data, if everyone fails to chase the long position or set a breakout long position in time in the first wave of the market, the subsequent pullback opportunities may be relatively limited, so it is necessary to maintain an active strategy in operation. It is recommended to continue to be bullish when it retreats to the 3335-3320 area, and the upper target is the 3360-3375 pressure range.
Gold Price Analysis July 30Gold (XAUUSD) Consolidating in a Triangle Pattern – Preparing for a Big Breakout
Currently, gold is moving within a triangle consolidation pattern, reflecting the market’s indecision as investors await a series of important economic data from the US this week. This hesitation suggests that a breakout from the triangle pattern could trigger a strong FOMO effect, creating a significant price movement in either direction.
The current price action is similar to a “bull flag” or “pennant” pattern, where a breakout could lead to a clearer and more decisive trend. If the support zone in the pattern fails to hold, the possibility of a sell-off is high.
Trading scenario:
🔻 Activate SELL order:
When price breaks the triangle bottom around 3324
Downside target: 3285, further is the strong support zone at 3250
🔺 Activate BUY order:
When price breaks and holds above the resistance zone 3333
Or: when there is a bearish rejection signal and candle confirmation at the area 3385

Gold short-term bearish
From the Bollinger daily line, as shown in the figure below, the gold price should still test the lower track of $3,280 in the future. The short-term upward trend line has also been broken, and this yellow line has now become a pressure.
From the moving average system, the daily line is chaotic, and the gold price goes up and down without order and rules to cross the moving average, so the daily moving average system has no reference significance. From the weekly line, the gold price has the need to step back on the 20-week moving average of $3,277 to $3,280.
So, if I look at the bearish, I can only see $3,277 to $3,280. No deeper decline can be seen, and no more signals appear. Therefore, shorting is relatively short. Or it is short within the daily Bollinger track, not structural short or trend short. Everything has a law, just oscillation.
So, I think that even if there is a short in the future, it is the end of the short. It is the right way to stop when you see good results. Even though the current gold price has fallen due to the short-term positive tariff negotiations between Trump, Japan and the European Union, the tariff level is still much higher than before, which will undoubtedly bring more uncertainty to future economic growth. Many other factors are not conducive to a sharp drop in gold prices. The overall situation is that the basic trend of gold price increases is intact.
Therefore, the high point of $3345.30 has become the watershed between long and short positions. You can use this as the dividing line for long and short operations. There is nothing wrong with setting a loss above $3345.30 to short in batches. There is nothing wrong with placing a long position at 3346. The market trend is very uncertain, so it all depends on what order you want to make.

XAUUSD position takenI have taken a trade in XAUUSD at 3340 ( Target : 3700, SL : 3296).
Why I have taken this trade ?
It has made an ascending triangle pattern .
It is near its support line.
If you build a fixed range volume profile you will find that
it is at Point Of Control.

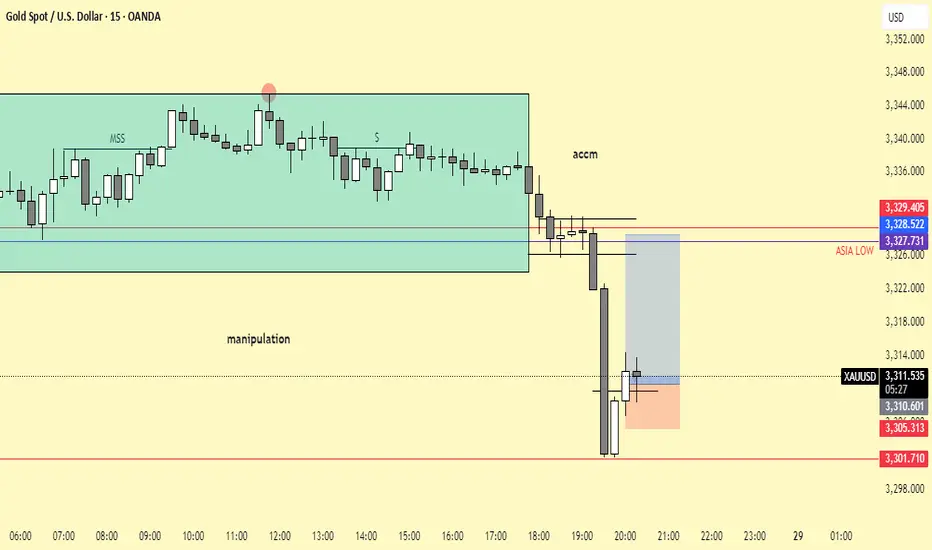
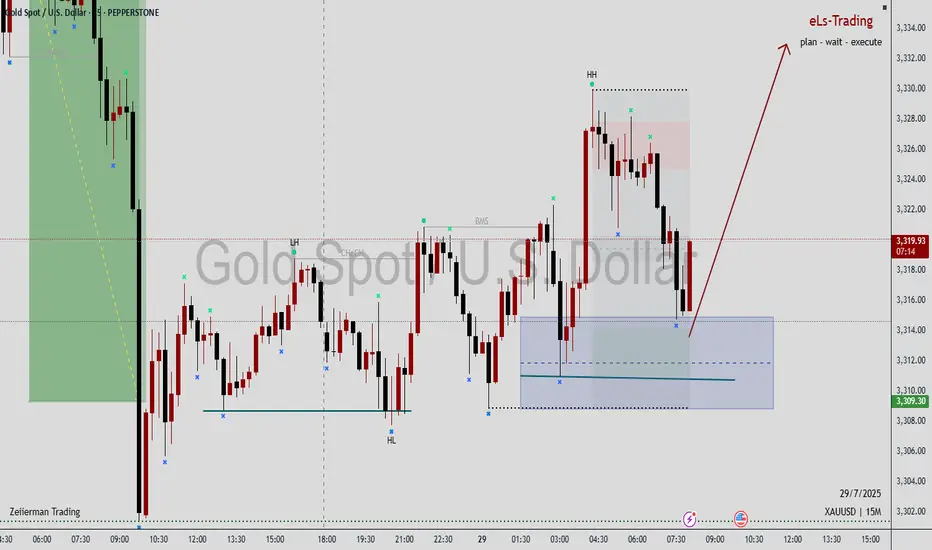
XAUUSD - 29/7/25 - continued bearish There was quite strong bearish momentum yesterday during the US session. Going into Asian session and London session today there is a consolidation bullish. There is a 4 hour zone marked out where i am looking for a retest and continuation bearish to a key zone below where a reversal pivot is expected and then continuing bullish with the larger trend.
