XAUUSD: Market Analysis and Strategy for July 28Gold technical analysis:
Daily chart resistance level 3375, support 3310
4-hour chart resistance level 3350, support 3320
1-hour chart resistance level 3345, support 3325.
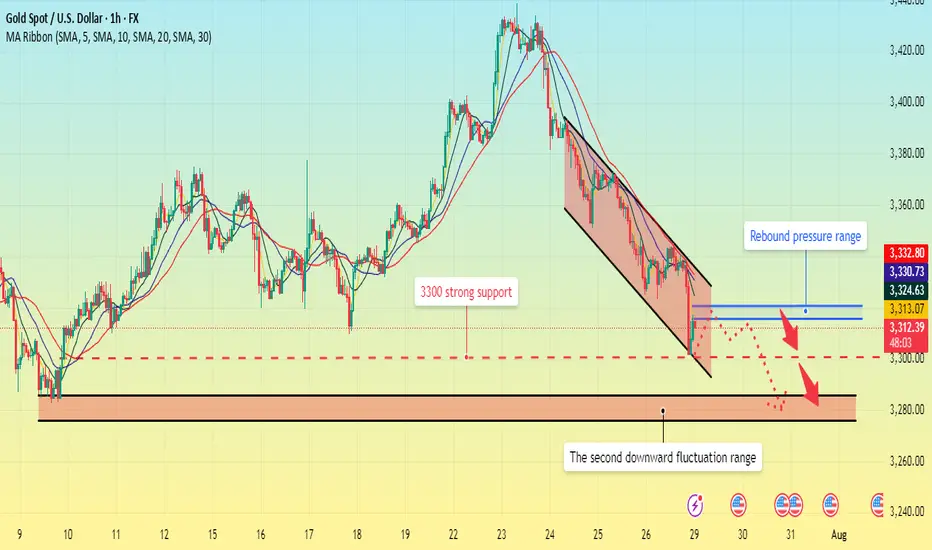
Gold, after hitting the 3438 area last week, saw a sharp adjustment, falling to around 3323, a drop of about $120, and there is no sign of stopping the decline in the short term. The next step may be to test the previous starting point of 3310. If it holds here, it is expected to bottom out and rise. If it falls below this position, the market will increase its selling behavior, and the short-selling target will be near the daily Bollinger lower rail 3285.
For the intraday market, the important position below is around 3310. Today's Asian market opened at around 3323, and then quickly rose. As of now, the highest reached 3345, and it still did not break through the high point of the US rebound on Friday near 3347. In the day, you can rely on today's low point near 3323 to be bullish, pay attention to the resistance of 3347/51. If the gold price is difficult to break through, you can consider selling. If the rebound breaks through the 3347~3351 area, the short-term will turn bullish.
BUY: 3325near
BUY: 3310near
SELL: 3345near
CFDGOLD trade ideas

XAUUSD (Gold/USD) – 1H Chart Analysis (July 28, 2025)🔍 Technical Summary:
Market Structure Shift (MSS) detected after liquidity (LQ) grab.
Price formed a bullish break of structure confirming a possible trend reversal.
Entry taken near support (after LQ), targeting a supply zone above.
📊 Key Chart Elements:
LQ (Liquidity Grab):
Price swept previous lows, triggering stop-losses before reversing.
MSS (Market Structure Shift):
Break of internal structure confirms potential upside movement.
Blue Zone (Target Area):
A clear supply zone, likely to act as resistance.
TP (Take Profit) placed just below this zone.
SL (Stop Loss):
Positioned below the recent low (LQ) – tight risk management.
📈 Outlook:
Expecting bullish continuation towards 3,380+ zone.
If price respects support and structure holds, long entries remain valid.
Watch for reaction at the supply zone – potential rejection or consolidation.
⚠️ Disclaimer:
This is not financial advice. Always do your own research before trading.

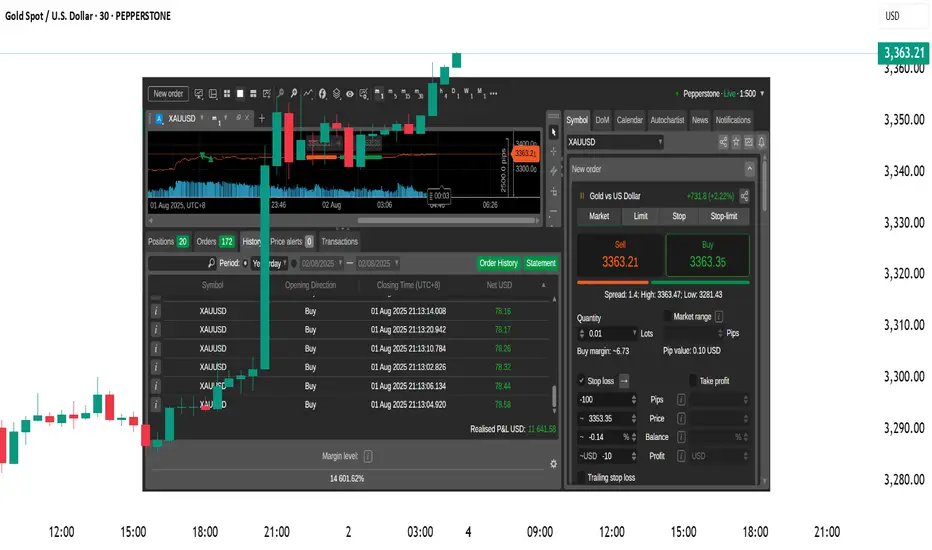
XAUUSD Live Trade with 11,641 USD ProfitsI managed to ride the momentum last night on XAUUSD and made over 11,641 usd profit on a live trading account. Gold usually create a range. It will create a top and a bottom then it will spend most of its time inside that range. That is pretty much how XAUUSD moves. If you can identify the top and the bottom then you can short it from the top and do a long trade on the bottom. The price will just travel from bottom to top and top to bottom. You can scalp your way to profits on this move if you can time it properly. Once in a while, a break from the top or the bottom happens. This is where you switch from trading the range to trading breakouts.
When you trade breakouts, you must trade it with the knowledge that less than 15 percent of breakouts are successful. Failed breakouts are very common. You need to have some form of stoploss below your breakout levels. You will know that the breakout fails once your stoploss is hit. If the breakout is successful then ride it. Do not put some TP (target price or take profit price) rather just trail your profits. Move your stops a few pips behind the price. Just enough distance to let the price breathe. If the price reverses then it will hit your stops. If the breakout is strong then you will ride it for a while until it reverses.
It will form another top and bottom again and move inside that range. Switch your approach again in trading long trades near the bottom and short trades near the top.
Just remember to always have some stoploss on every trade and never try to predict what the market will do or how the price will move. Let the market do its thing and just react to its movements.
Goodluck on your trades.
XAUUSD Analysis todayHello traders, this is a complete multiple timeframe analysis of this pair. We see could find significant trading opportunities as per analysis upon price action confirmation we may take this trade. Smash the like button if you find value in this analysis and drop a comment if you have any questions or let me know which pair to cover in my next analysis.

XAUMO XAUUSD (Gold Spot) ANALYSIS | AUG 01, 2025 | CAIRO TIME GMThis is a stealth bullish accumulation day. Market maker completed a fake drop and now prepping breakout. Play long bias from control zone with stop-hunt fade backup. Schabacker would call this a false breakdown spring + congestion base rally.
XAUUSD (Gold Spot) ANALYSIS | AUG 01, 2025 | CAIRO TIME GMT+3
🔍 Multi-Timeframe Technical Breakdown (Daily → 5m)
1️⃣ Price Action & Patterns
Daily: Bullish rejection tail forming (pin bar) off VAL (3,288). Strong buyer defense.
4H: Classic bullish engulfing off VAL support. High rejection wick to downside. Micro-structure shows market maker trap.
1H: V-shape recovery seen. Absorption bar confirmed via footprint delta spike.
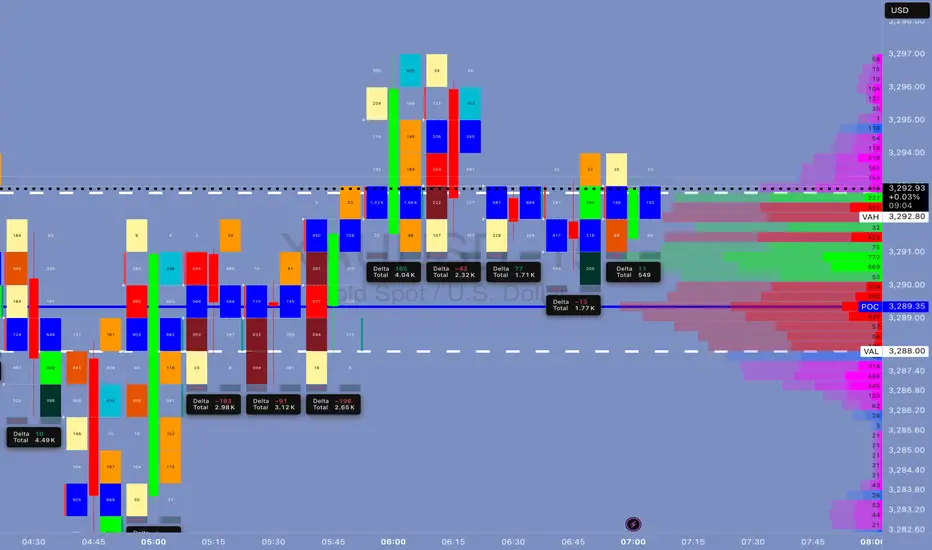
15m: Buyers stepping in at POC (3,289.35), stealthy buying—confirmed by divergence between delta & price.
5m: Accumulation in box range between 3,289–3,292. High absorption on bid side, low offer lifting—sign of stealth long build.
2️⃣ Volume & Delta Footprint
POC Cluster across all TFs: 3,289.00–3,291.50 is the control zone.
Volume Node Rejection at 3,288 = confirmed buyer base.
Delta: Absorption → sellers hitting bids but no follow-through = market maker trap → bullish implication.
Volume Spike at 3,288 = fakeout move likely manipulated to hunt stops.
3️⃣ Support/Resistance
VAL: 3,288 🔥 Strong Demand Zone
POC: 3,289.35–3,291.75 🧠 Smart Money Zone
VAH: 3,292.80 🎯 Break above confirms momentum
Res. Extension: 3,296.20, 3,300
Fibonacci Confluence: 3,288 = 61.8% golden retracement from recent rally
5️⃣Volatility
Compression near VAH = Volatility Expansion imminent.
Expect Breakout in next 1–2 hours (likely post 09:00 Cairo Time – Kill Zone)
6️⃣ Market Maker Philosophy
Last 3 days show liquidity vacuum trap below 3,288.
MM has triggered stop hunts to shake weak longs.
Building long inventory stealthily under POC.
Expecting rally trap to suck in breakout buyers → then retrace → final breakout continuation.
🧨 JEWEL TRADE ENTRY (Highest Probability)
📈 Order: Buy Stop
🎯 Entry: 3,293.10
🛑 Stop Loss: 3,287.70
💰 Take Profit: 3,302.40
📊 Confidence: 87%
🧠 Justification: Breakout of VAH/Golden Zone + High Volume Node = Trend Shift Confirmed
This is for EDUCATIONAL PURPOSE ONLY, and not financial advise.
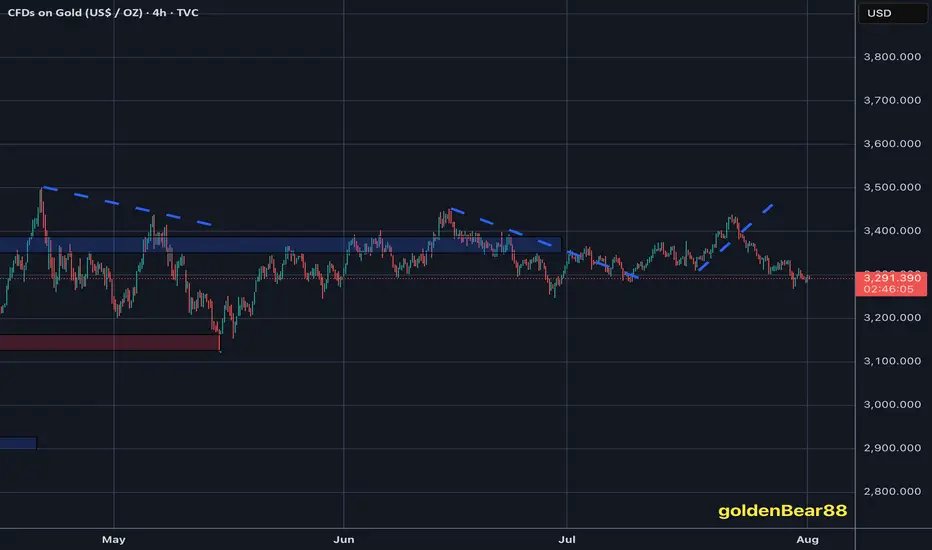
Where is GOLD going next?In the last four months, GOLD privided us a common pattern (for four times) that usually lead to an explosive moves. Where are we going next and what could be the target? In this case, time help us to understand better. The pattern is not complete yet and i expect the move to run in 24 hrs (maybe due to the high impact news will we have tomorrow, like the Initial Jobless Claim and CPE?). Now we just need to understand where the price will go to make profits, and to try to understand this we will check the RSI and the MACD. When this pattern occured, the RSI was rising and above 50 for three times with MACD on bullish cross (the three times that the price pumped) and was chopping and struggling close to 50 (but below it) with a bearish cross on MACD the single time it crushed. If we look at the actual situation, RSI is rising and MACD it's on bullish setup, but i will update you tomorrow (or when a breakout will occur). Now, for the possible target, we can easily aim to $100 move. So, price can touch $3420 for a long or $3240 for a short.
What do you think guys? Let me know in the comments!

Gold Intraday Trading Plan 7/31/2025Gold behaved as expected yesterday. It broke the channel and fell heavily, breaking both 3300 and 3280 supports. The bearish momentum is very strong right now.
I am looking for selling opportunity from 3300 and target 3255, which is my weekly target.

Gold May Dip Mildly Before US Data📊 Market Overview:
Spot gold is trading around $3,329/oz, up ~0.1%, supported by falling U.S. Treasury yields and a slightly weaker dollar, while investors await potential Fed dovish signals or rate cut in September . Meanwhile, easing U.S.–EU trade tensions weighed on safe-haven demand for gold.
📉 Technical Analysis:
• Key Resistance: ~$3,335–3,350 (recent highs and potential test zone)
• Nearest Support: ~$3,310 (previous stable support)
• EMA09 position: Price is above EMA9, indicating a mild bullish bias in the short term
• Momentum/Volume: RSI ~53 (neutral), MACD & StochRSI showing small buy signals. However, bullish momentum is fading, suggesting a possible mild pullback
📌 Conclusion:
Gold may dip modestly toward $3,310 if the dollar strengthens or if Fed rate-cut expectations recede. A break above $3,335–3,350 could pave the way for further gains, though current momentum remains insufficient to confirm a breakout.
💡 Suggested Trade Strategy:
SELL XAU/USD: $3,333–3,336
🎯 Take Profit: 40/80/200 pips
❌ Stop Loss: $3339
BUY XAU/USD: $3,310–3,308
🎯 Take Profit: 40/80/200 pips
❌ Stop Loss: $3305

The latest trend analysis and layout of the day,flexible adoptio#XAUUSD
⚠️News focus on the Sino-US trade talks, which may affect the gold trend.
Since the opening of the market today, gold has been fluctuating in a narrow range in the short term, without giving a clear trading direction🤔, and the short-term trend has not changed much.📊
🚦It remains constrained by resistance and a downward trend. In the short term, we need to pay attention to the 3300 mark below and the support of 3295-3285📈. On the upside, we should pay attention to the short-term suppression level of 3321-3333 and yesterday's high of 3345-3350.📉
In the short term, as long as it does not break through yesterday's high point, the volatile downward trend will not change. 🐂Once it breaks through, the short-term decline will stop, and the market will continue the bull rebound to test 3370~3380 or even 3400 before falling again.
Therefore, short-term trading focuses on the 3300 mark below and the long trading opportunities at 3295-3285. On the upside, defend the 3345-3350 highs and establish short positions.🎯
🚀 BUY 3310-3330
🚀 TP 3321-3333
🚀 BUY 3295-3285
🚀 TP 3310-3330
🚀 SELL 3320-3330
🚀 TP 3310-3300
🚀 SELL 3345-3350
🚀 TP 3330-3285

TRADING JOURNAL on Gold BYE SOMSTARFXThe price has reached a reasonable point of interest, and I observe buy-side liquidity and a fair value gap above.

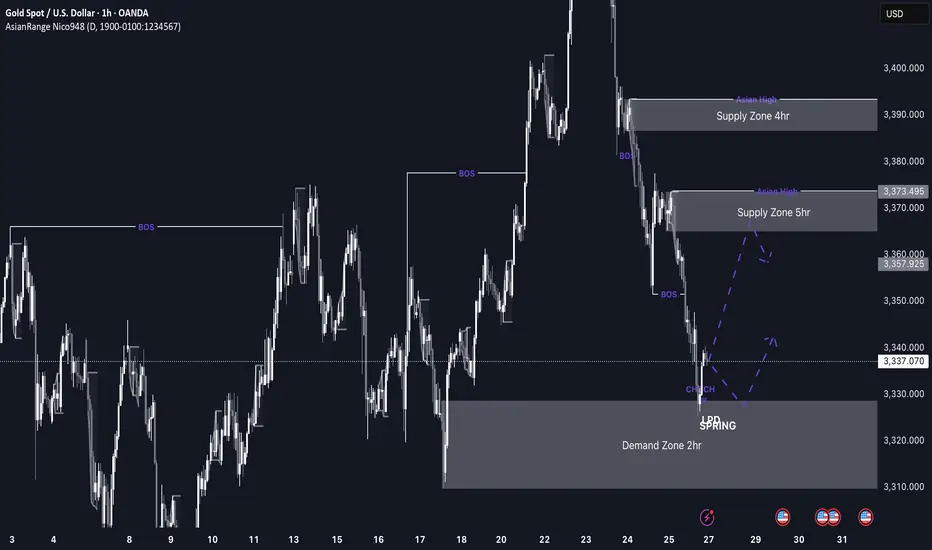
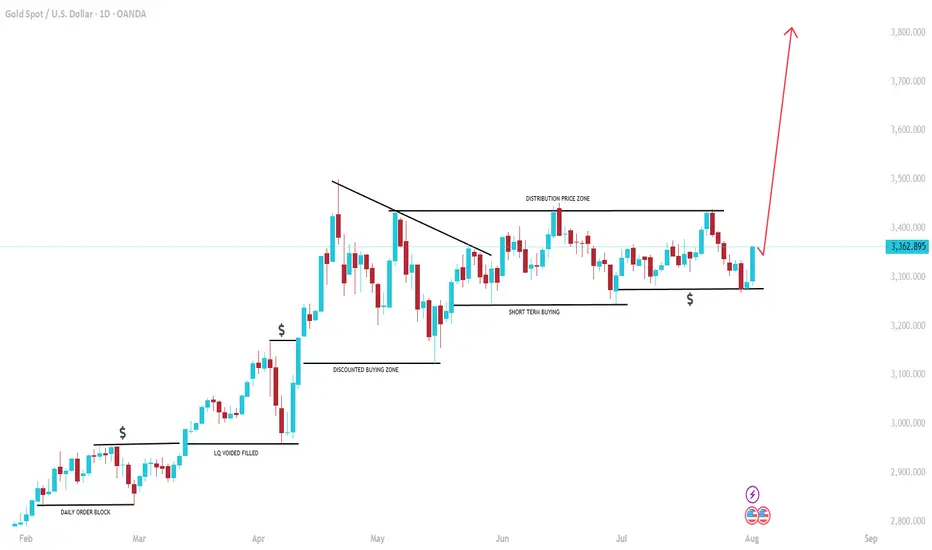
GOLD imminent possible buys up to 3,370 This week’s price action on GOLD is shaping up to be very interesting. After weeks of sustained bearish pressure, price has now entered a discounted 2hr demand zone sitting at a swing low, which makes it a high-probability area for a bullish reaction, especially as markets open.
If we do get the expected bullish reaction from this level, I’ll be watching the 3,370 region, where there’s a clean 5hr supply zone. If price reaches that level, I’ll be looking out for distribution and a potential short setup from there.
Confluences for GOLD Longs:
Price has been very bearish recently, so a retracement is expected
Currently sitting in a discounted 2hr demand zone
The overall long-term trend is still bullish
Early signs of accumulation and bullish reaction from this zone
P.S. If price fails to hold this current demand zone and breaks lower, then bearish momentum may continue. In that case, I’ll look for new long opportunities around 3,290 where a deeper demand zone exists.
GOLD Possible Scenario Gold break the Major support but the price didnot pullback so aggressively and buyers have reduced looks like it will likely go down to 3300-3280 range. the major sell point will be 3355-3360.

GOLD: $4000 on the way! Bulls has the controlGold is on the way hitting a record high since the global tension rising we can see gold creating another record high. Please note that it is a swing trades and may take weeks and months to hit the target or it may not even reach the target itself. This is prediction only so do your own due diligence.
I maintain my #3,277.80 and #3,252.80 TargetsI didn't engaged any re-Sell orders throughout yesterday's session and re-Sold Gold on #3,295.80 ahead of Asian session, with plan to keep orders over-night. However due NFP, Gold might be stationary / ranging until the news as I closed both of my orders on #3,291.80 / each #9.000 Eur Profit and my #3,300.80 pending Sell limit has been triggered over-night which is now running in Profits with Stop on breakeven. I do expect #3,277.80 and #3,252.80 Targets to be met within #1 - #3 sessions and if there aren't NFP numbers, I would keep all three orders / set of Selling orders maintaining my first #3,277.80 Target. Due the news, Gold might fluctuate within Neutral Rectangle until the news.
Technical analysis: My earlier Selling configuration / Technical expectations was confirmed on Hourly 4 chart under prolonged weakness and Price-action respecting the trend-line guarding the downtrend (very Bearish formation) as Hourly 1 chart is already an aggressive Descending Channel (width opened on Williams) that should reach it’s next local Low’s (currently Trading slightly below Double Bottom) and Oversold state near my take Profit of #3,252.80 benchmark. If the bands are widened Traders may witness #3,277.80 test, also if gets invalidated and #3,270.80 gives away, #3,252.80 mark extension test is inevitable. In any case I will update my Targets or levels of Profit taking if I decide to exit earlier than #3,252.80 benchmark to be in accordance with the Daily chart’s period / I already ride Selling wave since #,3,300's and my Profit will be already good to ignore.
My position: DX is soaring, Gold is under Bearish Technical developments and #3,252.80 benchmark is my final Target of current Selling leg. Only factor which can reverse this Intra-day but not postpone is NFP. I expect downside Jobs surprise which may reverse DX from local High's however hot upside surprise will make Gold test #3,252.80 Intra-day. NFP or not I do believe Gold is Bearish. Trade accordingly.
XAUUSD: BUYThere are some good trading opportunities in the market. That's when to buy. Gold prices haven't fallen further since falling back to 3390. There's no further negative news. Therefore, there won't be a significant short-term decline. Our focus will be on tomorrow's non-farm payroll data update. This is a crucial factor that can cause gold prices to rise or fall significantly in the short term.
I'll update you with real-time buy and sell opportunities. This is based on research from the Swing Trading Center. It's highly authoritative. Don't miss out! Remember to stay tuned.
XAUUSD: BUY 3292-3282 TP 3320. SL 3265

Gold is faking a bullish trapWe are gonna go down to the 3294 level before we see a bounce up. The 3294 level is gonna show up as a strong support to push trough the 3345 area.

Xauusd sell to buy ideaThere is going to be more sells all the way down to the support zone before a big buy to ALL TIME HIGH let's anticipate

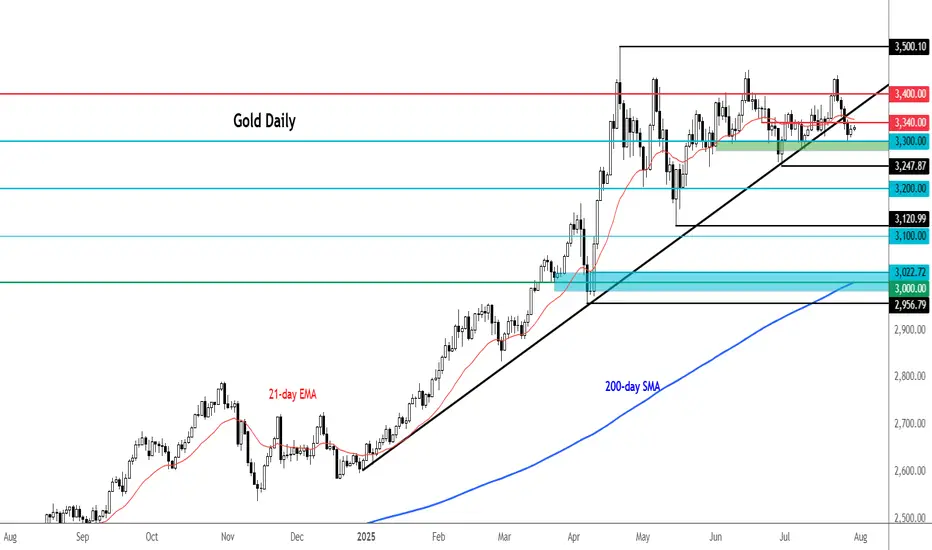
Gold remains below trend line ahead of FOMCAhead of today's US GDP and FOMC policy decision, gold was trading little-changed. The metal has breached its 2025 bullish trendline, which was positioned in the $3,330–$3,350 area. This breakdown shifts the technical outlook to mildly bearish, although further downside confirmation is needed through the loss of additional support levels to solidify bearish control.
From a bullish standpoint, the metal must reclaim and hold above the broken trendline to reignite upward momentum. However, the longer it remains below the $3,330–$3,350 zone, the greater the likelihood of a short-term correction—particularly if the immediate support at $3,300 fails. A break below this level would expose the June low at $3,247 as the next significant support.
By Fawad Razaqzada, market analyst with FOREX.com
On the upside, resistance is now stacked at $3,350, $3,385, and $3,430
7/30: Watch for Sell Opportunities in the 3352–3363 ZoneGood morning, everyone!
After a period of consolidation and decline, gold has found preliminary support near the 3300 level, and early signs of a bottom formation are emerging. The key technical level now lies around the 3332–3337 resistance zone. Based on current price structure, a breakout is likely, with major resistance seen at 3352–3358, while 3323–3316 serves as the primary support range.
However, caution is warranted as today’s ADP employment data may significantly influence short-term price action. Whether gold can hold above the 3337–3343 level depends on the data's impact.
From a broader perspective:
On the weekly chart, the 20-period moving average (MA20) has climbed to around 3276, yet the overall structure remains bearish for bulls
On the daily chart, gold is still trading below the MA60, facing notable resistance
This week's key events — ADP (Wednesday), jobless claims, and NFP (Thursday and Friday) — will likely shape gold’s medium-term trend
Trading Strategy for Today:
Focus on the 3313–3353 trading range, and be highly responsive to data-driven volatility.
Important note: If gold rises to 3343–3358 before the ADP release, then regardless of whether the data is bullish or bearish, the preferred approach is to sell into strength, as a post-data pullback is a likely scenario.

XAUUSD – TCB Strategy Setup✅ TCB Strategy Analysis
Trend Phase
HTF Bias: Recently shifted from bearish to potential bullish — clear breakout from descending channel.
Current Structure: Price has broken above channel and retested former structure resistance (~3325) as support.
Bias: Bullish continuation forming.
🚨 XAUUSD – TCB Strategy Setup (EP1 Active, EP2 Pending) 💥
Price just broke out of the descending channel and is now forming a solid base above the 3325 zone.
✅ EP1 (Pullback Buy) already triggered after price retested support.
📍 EP2 will activate on clean breakout + retest of 3330 zone.
🎯 Targets:
• TP1: 3348
• TP2: 3356–3360
If price loses 3325 structure, we reassess. For now, I’m bullish while structure holds.
This setup aligns 100% with the TCB Strategy:
Trend Phase: Bullish structure forming
Countertrend: Liquidity sweep + reclaim
Breakout Phase: Incoming on 3330 retest
🧠 Flow with structure, not emotion.
💬 Drop your comment if you're trading Gold too.
#TCBFlow #XAUUSD #GoldAnalysis #SmartMoney #BreakoutTrading #FlowWithTCB

Downward Pressure Resumes After Channel BreakdownXAUUSD OANDA:XAUUSD – Downward Pressure Resumes After Channel Breakdown: Key Levels and Strategy for Today
As of the July 29 session, gold (XAUUSD) remains under short-term bearish pressure, having broken below the descending price channel on the 1H timeframe. The market structure confirms a dominant bearish trend as price continues to trade below the EMAs cluster.
1. Price Action and Market Behavior
XAUUSD is forming a clear sequence of lower highs and lower lows, confirming a short-term downtrend.
Price is currently hovering around $3,316 after breaking below the lower boundary of the channel, signaling potential continuation of the sell-off.
2. Key Resistance and Support Levels
Immediate resistance: 3,337 – 3,346 USD (aligned with EMA20, EMA50 and prior channel resistance).
Major resistance: 3,378 – 3,385 USD (confluence of Fibo and former high).
Near-term support: 3,300 USD (psychological level).
Major support: 3,248 USD (projected target based on measured move from channel height).
3. Technical Indicators
EMA20 and EMA50 are both below EMA200, forming a classic “death cross” – a strong bearish signal.
Volume increased on the breakdown, reinforcing the strength of bearish momentum.
RSI remains below 50, indicating weak bullish retracements and room for further downside.
4. Trading Strategy
Primary Strategy: Sell on Rally
Ideal entry zone: 3,331 – 3,346 USD.
Stop Loss: Above 3,353 USD (above key resistance zone).
TP1: 3,300 USD.
TP2: 3,248 USD (extended target based on breakout structure).
Alternative Strategy: Countertrend Long
Only consider buy setups if strong reversal candles and bullish RSI divergence appear near 3,248 USD.
XAUUSD continues to face downside risk after the channel breakdown. Unless bulls reclaim the 3,337 – 3,346 zone, price is more likely to drift lower toward 3,300 and potentially 3,248. Traders should remain patient and wait for clean setups around these key zones.
Follow for more strategies and remember to save this post if you found it helpful.
Let me know if you'd like a short version for the TradingView caption or hashtags suggestion.

Sell,Buy,Sell!Hello all. as you see market structure Talks. it is so beautiful move is running right here. be happy(wink)

Gold fell below support. What will be the subsequent trend?The 1-hour moving average of gold continues to show a downward short position, indicating that the downward momentum is still sufficient; the wave pattern of gold's current decline remains intact, but the rebound strength is very weak, showing an obvious short trend of gold. Moreover, when gold rebounded in the short term, obvious resistance began to form above 3320, and the upward momentum was slightly insufficient.
From the daily chart, before 3300 fails to fall, it is likely to fluctuate around 3300-3350. On the contrary, if it falls below 3300, it is likely to reach the bottom of the 3385-3375 range.
This week is a super data week. The data of each day may affect the trend of gold on that day, but it will not form a unilateral strong trend. Therefore, the volatility before and after the data is released is likely to be large, so traders should focus on the following data:
1. US ADP employment report, US second quarter GDP preliminary value;
2. Federal Reserve interest rate decision;
3. US PCE annual rate, monthly rate;
4. The last trading day of this week will usher in non-agricultural data.