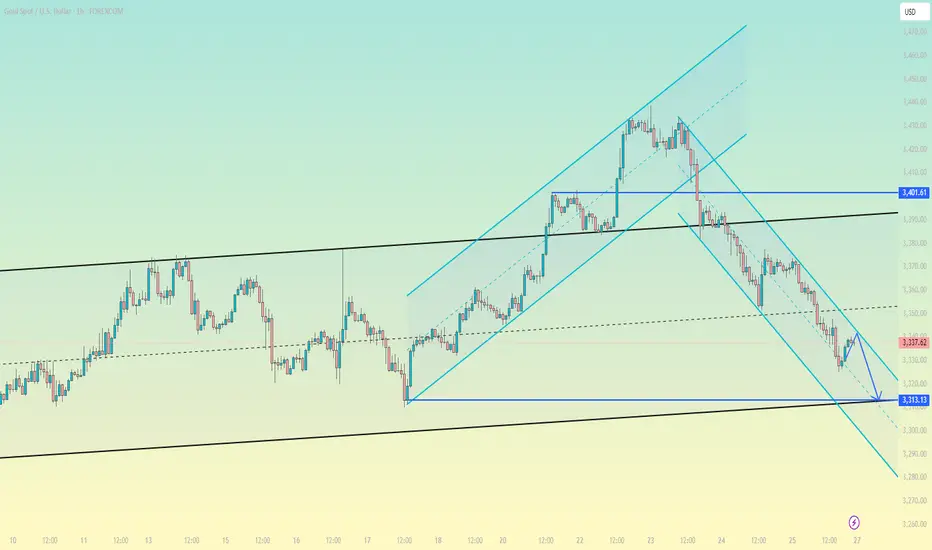
Gold analysis Gold (XAU/USD) Technical Analysis
Date: July 28, 2025
Market Context
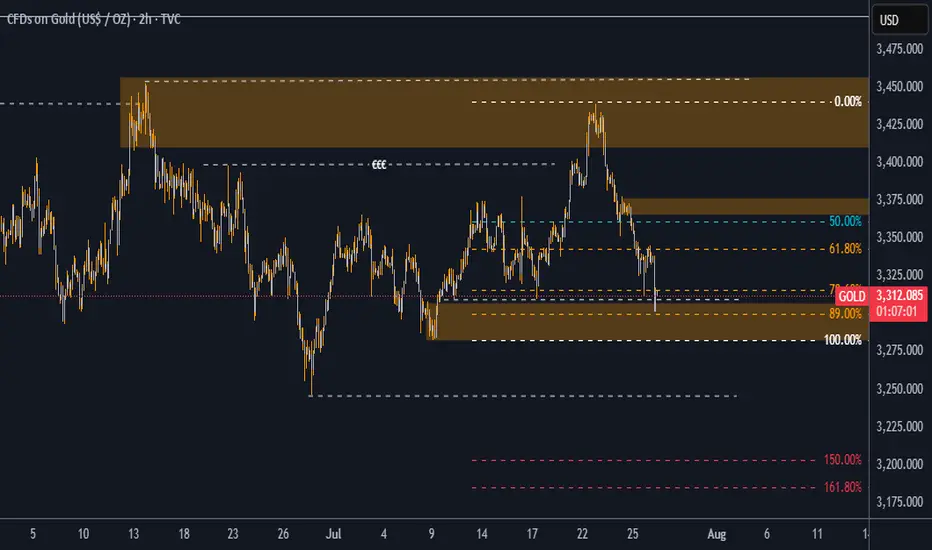
Gold (XAU/USD) is currently trading at $3,313.01, showing a modest gain of +0.32% on the day. From a Smart Money Concepts (SMC) perspective, price action is now positioned at a high-probability demand zone, presenting an attractive opportunity for long positions.
Key Technical Observations
Liquidity Grab at $3,308
Price has recently swept the liquidity resting below $3,308, indicating the possible completion of a stop-hunt move orchestrated by institutional players. This move created an ideal setup for a bullish reversal from a zone where weak longs have been shaken out.
Discounted Price Zone (89% Fibonacci)
The market has retraced deeply into a discounted region, reaching the 89% Fibonacci retracement level of the most recent bullish leg. This zone coincides with a previously identified demand block, enhancing the confluence for potential bullish continuation.
Market Structure & Order Blocks
The current structure shows a bullish intent with price revisiting a bullish order block that previously led to a strong rally. The reaction from this block is key—holding above $3,300 would confirm buyers stepping in with conviction.
Internal Liquidity Void (Imbalance)
A visible inefficiency (price imbalance) exists between $3,345 and $3,398, acting as a magnet for price in the short-to-mid term. This inefficiency aligns perfectly with SMC principles that favor price filling these voids.
Bullish Targets
If price holds and confirms bullish intent from the current zone, we expect a move toward the following key levels:
Target 1: $3,345
This is the midpoint of a previous consolidation range and also lies just above the 50% Fibonacci level.
It also aligns with a minor supply area and could serve as a first TP level.
Target 2: $3,398
This is the upper bound of a key supply zone that previously initiated a strong sell-off.
It coincides with the 0.00% Fib retracement, marking the origin of the most recent bearish leg.
CFDGOLD trade ideas
Gold short-term rise waiting for breakthrough
💡Message Strategy
During the Asian trading session, gold prices rebounded slightly from $3,320, filling the short gap at the start of the new week. As investors chose to stay on the sidelines before the Fed's two-day monetary policy meeting, the bullish force of the US dollar temporarily weakened, providing support for gold, an interest-free asset.
However, with the 15% tariff agreement between the United States and Europe and the positive progress of trade easing between the United States, Japan and the United States, market risk appetite has rebounded, weakening the appeal of gold as a safe-haven asset.
According to market surveys, "The current optimistic atmosphere of trade has weakened the safe-haven demand for gold, while the weakening of the US dollar has provided support for gold prices. The two forces offset each other, causing gold to fluctuate."
Investors are focusing on the FOMC meeting to be held on Tuesday. Although Trump continues to pressure the Fed to cut interest rates, the market generally expects that the interest rate will remain unchanged at this meeting because the US labor market remains strong.
In addition to the interest rate decision, this week will also usher in the US second quarter GDP estimate, PCE price index and non-farm payrolls report, all of which may have a significant impact on gold.
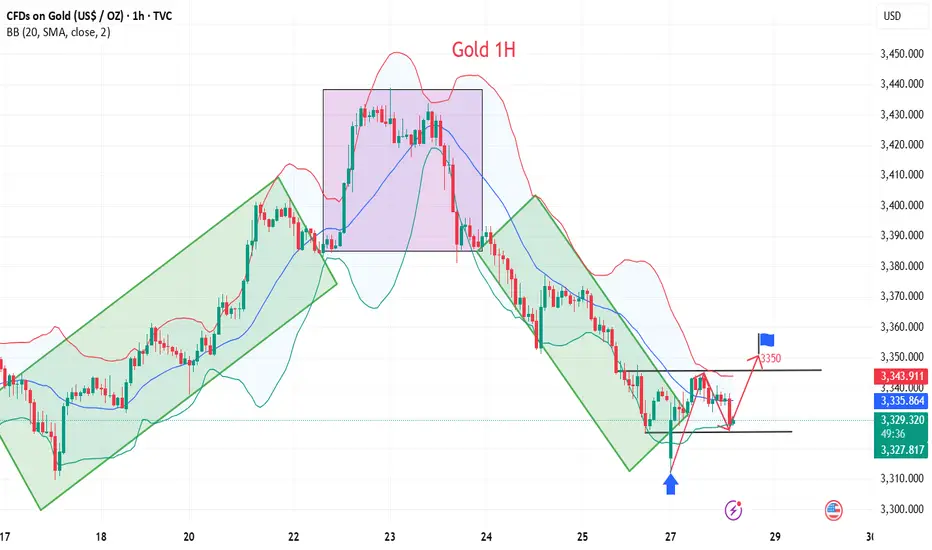
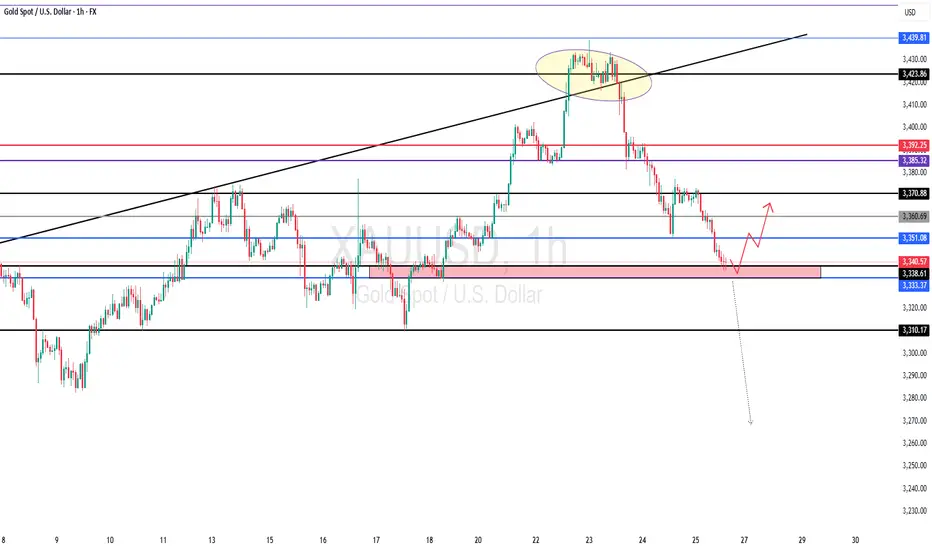
📊Technical aspects
From the technical trend, gold triggered a rapid correction after breaking below the lower edge of the short-term rising channel and the 50% Fibonacci retracement level last week. The current gold price stabilized in the $3,320 area and received some buying at the 61.8% Fibonacci support.
However, it is worth noting that the 200-period moving average on the 4-hour chart is at $3,350, which constitutes an important technical resistance for a short-term rebound. On the contrary, if gold breaks through the $3,350 level, gold will continue to develop a bullish pattern.
From the technical trend, gold triggered a rapid correction after falling below the lower edge of the short-term rising channel and the 50% Fibonacci retracement level last week. The current gold price stabilized in the $3,320 area and received some buying at the 61.8% Fibonacci support.
However, it is worth noting that the 200-period moving average on the 4-hour chart is at $3,350, which constitutes an important technical resistance for a short-term rebound.
On the contrary, if gold breaks through the $3,350 line, it will be expected to attack the $3,371-3,373 area in the short term, and further look to the key pressure levels of $3,400 and $3,440.
💰Strategy Package
Long Position:3320-3325,SL:3300,Target: 3350

LONG ON GOLD (XAU/USD)Gold is at a nice demand level with the dollar currently falling.
I will be buying gold looking to make over $102 move to the previous high.
Thats over 1000 pips on gold.

XAUUSD Gold closed bearish and I’ll continue looking for sells. I’d prefer gold to retrace and create a LH and continue selling towards 3310. Last time price was around 3310, it had a massive bullish run so that’ll be the only area I’d sell to unless price breaks that support.

GOLD Drops $60 – Bearish Bias Holds Below 3365GOLD | OVERVIEW
As expected, gold continued its bearish momentum, dropping from the 3430 level and delivering a move of approximately $60.
For today, the bearish bias remains valid as long as the price stays below 3365, with potential targets at 3337 and 3320.
However, if the price reverses and stabilizes above 3365, it could signal a shift to bullish momentum.
Key Levels:
Support: 3355 · 3337 · 3320
Resistance: 3374 · 3388

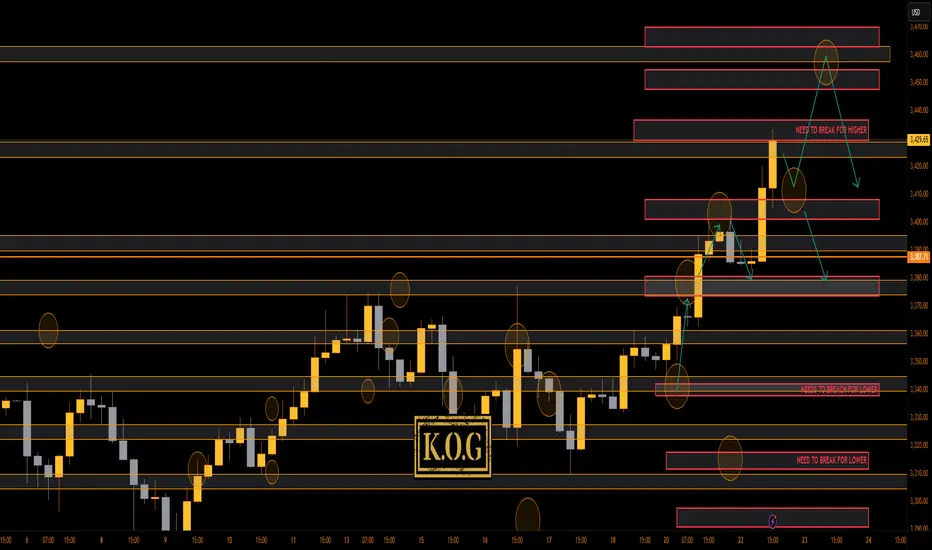
THE KOG REPORT - UpdateA rare day for us today even though we got the level for the short from above, we activated again, and due to everything lining up confirming the short into the lower order region where we wanted to bounce, we took it. Gold, had other plans, engulfing upside resulting in us having to SL the trade. It then went on to break above and complete our daily targets.
You win some, you lose some!
Now, we have support below at the 3410 region which will need to break to change short-term structure, while there is the order region above 3430-35 which could hold price and accumulate. All our bullish targets for the day are completed, we just wanted lower to then go higher.
If lower support can be targeted and held, we could see a move higher into the 3345-50 region before then a reaction in price. I'm still not happy with this move, something doesn't quite look right, so let's play it day by day.
RED BOXES:
Break above 3395 for 3404✅, 3410✅ and 3420✅ in extension of the move
Break below 3375 for 3368 and 3355 in extension of the move
As always, trade safe.
KOG
GOLD ROUTE MAP UPDATEHey Everyone,
Another great day on the charts today with our analysis playing out perfectly like we analysed.
As a follow up from yesterday, after completing 3356, we noted that EMA5 cross and lock opening 3404, which was hit perfectly today as analysed. With strong momentum, we also cleared the 3424 Bullish Target.
We will now look for an EMA5 lock above 3424 to open the next bullish level at 3439. Alternatively, a rejection here may see lower Goldtruns tested for support and bounce.
We will keep the above in mind when taking buys from dips. Our updated levels and weighted levels will allow us to track the movement down and then catch bounces up.
We will continue to buy dips using our support levels, taking 20 to 40 pips. As stated before, each of our level structures gives 20 to 40 pip bounces, which is enough for a nice entry and exit. If you backtest the levels we’ve shared every week for the past 24 months, you’ll see how effectively they were used to trade with or against short/mid-term swings and trends.
The swing ranges give bigger bounces than our weighted levels, that’s the difference between the two.
BULLISH TARGET
3356 - DONE
EMA5 CROSS AND LOCK ABOVE 3356 WILL OPEN THE FOLLOWING BULLISH TARGETS
3381 - DONE
EMA5 CROSS AND LOCK ABOVE 3381 WILL OPEN THE FOLLOWING BULLISH TARGET
3404 - DONE
EMA5 CROSS AND LOCK ABOVE 3404 WILL OPEN THE FOLLOWING BULLISH TARGET
3424 - DONE
EMA5 CROSS AND LOCK ABOVE 3424 WILL OPEN THE FOLLOWING BULLISH TARGET
3458
BEARISH TARGETS
3331
EMA5 CROSS AND LOCK BELOW 3331 WILL OPEN THE FOLLOWING BEARISH TARGET
3311
EMA5 CROSS AND LOCK BELOW 3311 WILL OPEN THE SWING RANGE
3289
3266
As always, we will keep you all updated with regular updates throughout the week and how we manage the active ideas and setups. Thank you all for your likes, comments and follows, we really appreciate it!
Mr Gold
GoldViewFX
Gold prices are under pressure, focusing on the Fed stormGold prices are under pressure, focusing on the Fed storm
Weekly gold price report: The rebound of the US dollar suppresses precious metals, and the market focuses on the Fed's policies and trade negotiations
Market review
On Friday (July 26), the international gold price was under pressure to fall, with spot gold falling 0.9% to $3,336.01/ounce, and COMEX gold futures closing down 1.1% to $3,335.6/ounce. The US dollar index rebounded from a low of more than two weeks, and the progress in US-EU trade negotiations weakened the demand for safe havens, which jointly suppressed the performance of precious metals.
Analysis of core influencing factors
The US dollar and trade situation
The US-EU trade agreement negotiations have entered a critical stage. The EU said that "the agreement is just around the corner", but member states still approved the potential counter-tariff plan. US President Trump said that he will negotiate with the EU on Sunday, with a probability of 50%. If the agreement is implemented, it may further suppress the safe-haven properties of gold.
The recent trade agreement between Japan and the United States also boosted market risk appetite, and funds flowed to risky assets.
Fed policy expectations
Despite the resilience of the US labor market (initial jobless claims fell to 217,000 last week, the sixth consecutive week of decline), the market generally expects the Fed to keep interest rates unchanged at its July meeting.
Trump has recently pressured the Fed to cut interest rates and even made a rare visit to the Fed headquarters, sparking discussions on policy independence. Some analysts believe that if inflationary pressures ease, the Fed may release dovish signals in the second half of the year.
Fund positions and central bank demand
As of the week of July 22, hedge funds' net long positions in gold increased to 170,868 contracts, the highest level since April, reflecting the market's long-term concerns about trade tensions.
Central bank gold purchase demand still provides structural support for gold prices.
Geopolitical dynamics
Israeli-Palestinian conflict: Hamas said that the ceasefire negotiations have made progress, but the US statement caused a surprise, and the progress of subsequent negotiations may affect market sentiment.
Russia-Ukraine situation: Turkey coordinates all parties to hold a leaders' summit in Turkey. Russia and Ukraine have agreed in principle to meet, and potential peace plans may reduce the safe-haven premium.
Outlook for the future
Key short-term events:
US/EU/China trade negotiations: If progress is optimistic, gold prices may fall to the support level of $3,300/ounce.
Federal Reserve July resolution: Pay attention to the policy statement's hints on the path of interest rate cuts and the Fed's response to political pressure.
US non-farm data: If the employment data is strong, it may strengthen the expectation of "higher for longer" interest rates.
Technical aspect: Near $3,300/ounce may attract buying, but breaking through the previous high requires clearer signals of monetary policy shift.
Risk warning: Repeated trade negotiations, escalating geopolitical conflicts or unexpectedly dovish Fed may reverse the decline in gold prices.
GOLD - at Cut n Reverse Region, whats next ??#GOLD - market just reached at his ultimate area and keep in mind that if market break his current region than it will go further and nose dive..
NOTE: cut n reverse below our mentioned region..
SHORT | Gold | 4H Chart Direction: Bearish
Moving Average: Blue < Red
Pattern Impulse: Impulse correction
Fib Retracement: 38.2
MACD > 0
1st Target = 3302
2nd Target = 3290
Lots: 0.02
RISK: Economic instability still begs the question around whether commodities continue higher over the coming months.
Trade 1/20


Gold is significantly bullish, where can we short?The positive non-farm payroll report pushed the market from 3300 directly above 3330, demonstrating overall bullish momentum. Congratulations again, everyone. Real-time strategies are like a beacon guiding your investment journey. The market will never disappoint those who persevere and explore wisely. Charlie advises against blindly chasing highs. Trading advice (first hit is valid): Focus on key support levels: 3300 and 3310. Go long if these levels are reached.
~For those who want to go short above 3350-55, only use a stop-loss and feel free to try~ PEPPERSTONE:XAUUSD FXOPEN:XAUUSD ACTIVTRADES:GOLD FXOPEN:XAUUSD CMCMARKETS:GOLD VANTAGE:XAUUSD VELOCITY:GOLD
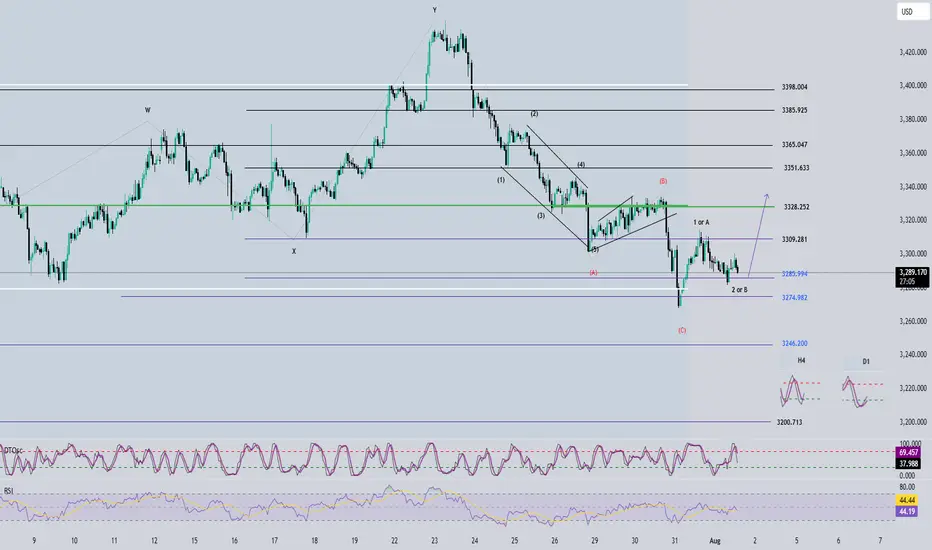
Elliott Wave Analysis – XAUUSD August 1, 2025📊
________________________________________
🔍 Momentum Analysis:
• D1 Timeframe:
Momentum has reversed to the upside. Based on this signal, we expect a bullish trend to continue for the next 5 daily candles — likely until mid-next week.
• H4 Timeframe:
Momentum has also turned upward → This suggests that from now until the U.S. session, the price will likely continue to rise or consolidate with an upward bias.
• H1 Timeframe:
Momentum is currently turning down → We anticipate a short-term corrective move. We should wait for H1 to enter the oversold zone and give a bullish reversal signal before looking for long entries.
________________________________________
🌀 Wave Structure Analysis:
The current wave structure remains complex and lacks clear confirmation. Thus, the current wave labeling should be considered provisional. However, the wave count has not been invalidated, and D1 momentum supports a bullish outlook — so we continue to maintain our wave structure bias.
Important Note:
Wave (C) in red appears relatively short. This leaves open the possibility that the price may continue lower, targeting:
• ⚠️ 3246
• ⚠️ 3200
→ This scenario will be triggered if price breaks below 3268, especially given today's Nonfarm Payroll (NFP) report.
________________________________________
📌 Two Possible Wave Scenarios:
1. Scenario 1: Black Waves 1 – 2 – 3
o Wave 1 (black) is complete.
o We are now in Wave 2 (black) → Preparing for Wave 3.
o Wave 3 tends to be strong, impulsive, and sharp with large candle bodies.
o Target: 3351
2. Scenario 2: Black ABC Correction
o The market is currently in Wave B (black).
o Potential target for Wave C: 3328
________________________________________
🛡 Support Zones & Trade Strategy:
• Support Zone 1: 3290 → A good area for potential buying, but we must wait for H1 to enter the oversold region and show a bullish reversal.
• Support Zone 2: 3275 → Deeper buy zone if the price corrects further.
________________________________________
💡 Trade Plan:
📍 Option 1 – Buy Limit:
• Buy Zone: 3290 – 3289
• Stop Loss: 3280
• Take Profit 1: 3309
• Take Profit 2: 3328
• Take Profit 3: 3351
📍 Option 2 – Buy Limit:
• Buy Zone: 3275 – 3273
• Stop Loss: 3265
• Take Profit 1: 3309
• Take Profit 2: 3328
• Take Profit 3: 3351
________________________________________
📎 Notes:
• Experienced traders should wait for clear confirmation signals on H1 before entering trades.
• New traders may consider using limit orders in the proposed buy zones.
Gold Market Rejected at 3310 as Bearish Channel HoldsGold market faced rejection at 3310, failing to break above the bearish channel, as DXY strength continues to weigh on price action. The inability to sustain above key levels reflects ongoing bearish pressure, unless a clear break occurs.
🔍 Key Insight:
3310 acts as a short-term ceiling
DXY strength supports the bearish stance, follow for more insights coment and boost idea .

XAUUSDXAUUSD breakout falling channle and resistance zone.
Buy above 3295
Stop Loss: 3291
1st TP: 3308
2nd TP: 3313
3rd TP: 3322
4th TP: 3333

GOLD: Short Trading Opportunity
GOLD
- Classic bearish formation
- Our team expects fall
SUGGESTED TRADE:
Swing Trade
Sell GOLD
Entry Level - 3299.9
Sl - 3304.2
Tp - 3291.3
Our Risk - 1%
Start protection of your profits from lower levels
Disclosure: I am part of Trade Nation's Influencer program and receive a monthly fee for using their TradingView charts in my analysis.
❤️ Please, support our work with like & comment! ❤️

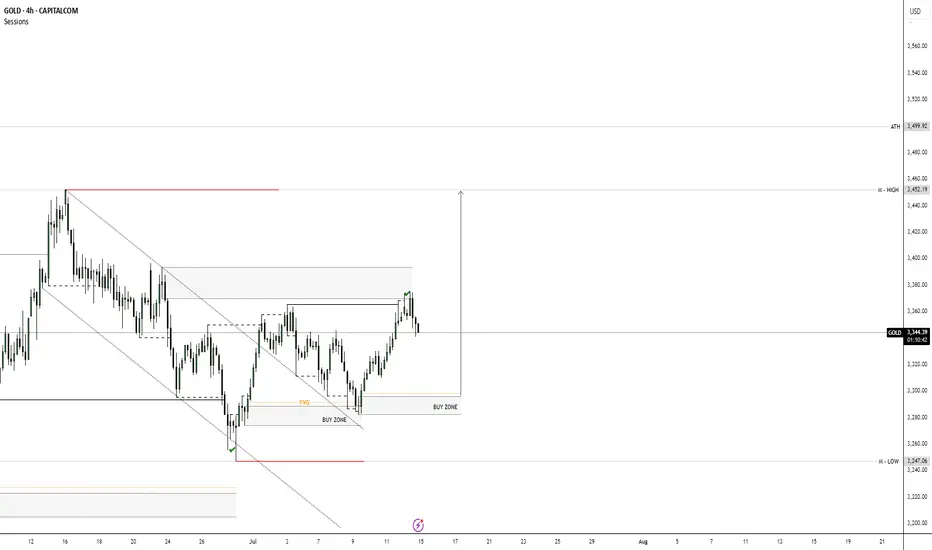
XAUUSD ANALYSYS 💸GOLD💸
Market Outlook: Bullish
• Price broke out of a downtrend channel and is now forming higher highs and higher lows — clear sign of a trend reversal.
• Current move is a pullback after a strong push up.
⸻
📍 Key Zones:
• Buy Zones and Fair Value Gaps (FVGs) are marked.
• These are areas where buyers may step in again.
• Price is pulling back into these zones — potential long entry area.
⸻
🎯 Target:
• The top red line marks a liquidity zone or resistance.
• Price is likely aiming to reach this area next.
⸻
📈 Trade Setup Idea:
• Buy on pullback to the FVG / Buy Zone.
• Stop Loss: Below the Buy Zone.
• Take Profit: At the previous high (resistance zone).
⸻
⚠️ Risk to Watch:
• If price breaks below the Buy Zone, bullish setup is invalidated — wait for new structure.
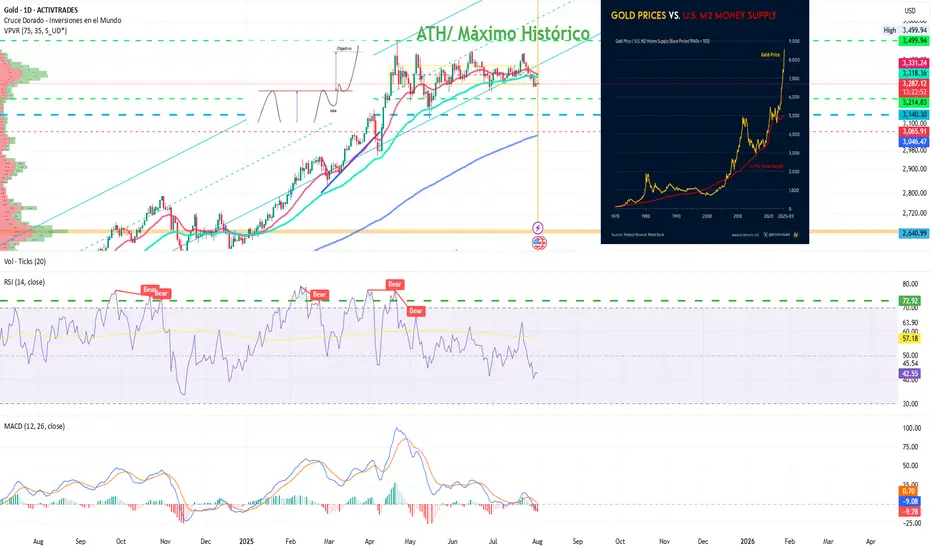
Gold: Are the Bulls Still Behind It?Ion Jauregui – Analyst at ActivTrades
Fundamental Analysis
In 2025, gold has appreciated around 27% year-to-date, reaching a peak of 33.37% at the end of April, driven by structural factors. Its strength is based on global de-dollarization, central bank purchases, persistent inflation, and expectations of real rate cuts in the U.S. Since real interest rates peaked in July 2023, gold has risen 74%, reinforcing its role as a hedge against monetary policy.
In addition, countries like China and Russia continue to accumulate gold as protection against the dollar and potential sanctions, supporting long-term structural demand. Diversifying with physical and financial gold (ETFs, mining stocks) is an increasingly common strategy in an environment of high debt, geopolitical tensions, and doubts about traditional safe-haven assets. A suggested allocation in a classic model portfolio could range between 10% and 25%, depending on the risk profile, in a typical equity-focused investment portfolio.
Technical Analysis
From a technical standpoint, gold has completed a long-term “cup with handle” formation that began in 2012, with an upside projection toward the $4,000 per ounce area. This pattern supports the continuation of its long-term upward structure.
In the short term, however, the price is in a consolidation phase after reaching all-time highs of $3,499.94 at the end of April. Since then, the lateral movement suggests a pause within the primary trend.
Technical indicators are showing mixed signals: RSI and MACD are pointing toward a possible oversold condition, suggesting a risk of short-term correction. Additionally, a bearish crossover between the 50-day and 100-day moving averages may reinforce selling pressure.
If this corrective scenario unfolds, gold could retrace toward a key support zone around $3,140, a level that has served as the base of the current range and where renewed buying interest could emerge.
Despite a possible pullback, the broader technical outlook remains constructive. Any correction would likely present tactical opportunities to re-enter the market—especially if expectations of real rate cuts or global geopolitical tensions persist.
Gold Consolidates After Highs
All in all, despite potential short-term pullbacks, gold continues to offer value as a tool for diversification, wealth protection, and a hedge against systemic risks. Its inclusion in portfolios remains relevant, even at current levels.
*******************************************************************************************
The information provided does not constitute investment research. The material has not been prepared in accordance with the legal requirements designed to promote the independence of investment research and such should be considered a marketing communication.
All information has been prepared by ActivTrades ("AT"). The information does not contain a record of AT's prices, or an offer of or solicitation for a transaction in any financial instrument. No representation or warranty is given as to the accuracy or completeness of this information.
Any material provided does not have regard to the specific investment objective and financial situation of any person who may receive it. Past performance and forecasting are not a synonym of a reliable indicator of future performance. AT provides an execution-only service. Consequently, any person acting on the information provided does so at their own risk. Political risk is unpredictable. Central bank actions can vary. Platform tools do not guarantee success.
XAUUSD-4HXAU/USD – 4H Technical Analysis
Gold (XAU/USD) is currently testing the upper boundary of a descending channel on the 4-hour chart. The overall trend remains bearish, and this resistance zone may act as a potential reversal point.
If price fails to break above the channel resistance, a downward move toward the lower boundary is likely.
🔹 Trend: Bearish
🔹 Entry Zone: Near channel resistance
🎯 Target: 3250
🛑 Stop-Loss: 3221
Traders should watch closely for bearish price action signals at the top of the channel. A confirmed rejection could offer a shorting opportunity.

GoldGold Giving pulllback and then again go sell this time target is 3247..if this level breaks and any close below h4 it will further downside


Gold (XAU/USD) Analysis:Following yesterday's Fed statements regarding the economic impact of tariffs and the decision to keep interest rates unchanged, gold prices dropped to $3,268, before rebounding today to retest the $3,310 zone. The short-term trend remains bearish.
1️⃣ A break and hold below $3,300 may push the price toward $3,280, and potentially $3,260.
🔻 A confirmed break below $3,260 could lead to a deeper decline toward a strong support zone near $3,245.
2️⃣ On the other hand, if bullish momentum appears and the price breaks above $3,310, it may open the path to $3,330 — a key level that could trigger a bearish rejection.
📈 However, if the price holds above $3,330, the next target would be $3,350.
⚠️ Disclaimer:
This analysis is not financial advice. It is recommended to monitor the markets and carefully analyze the data before making any investment decisions.
