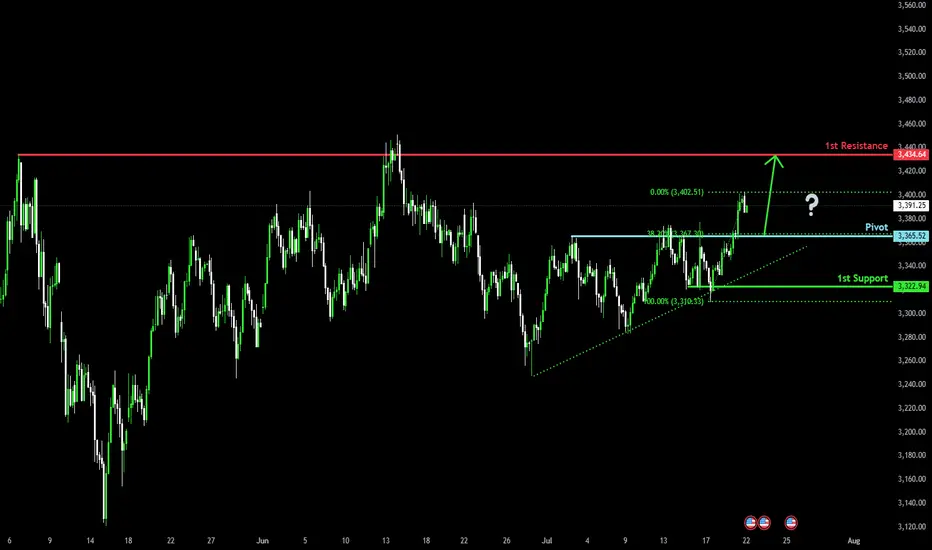
Falling towards pullback support?The Gold (XAU/USD) is falling towards the pivot which has been identified as a pullback support and could bounce to the 1st resistance.
Pivot: 3,365.52
1st Support: 3,322.94
1st Resistance: 3,434.64
Risk Warning:
Trading Forex and CFDs carries a high level of risk to your capital and you should only trade with money you can afford to lose. Trading Forex and CFDs may not be suitable for all investors, so please ensure that you fully understand the risks involved and seek independent advice if necessary.
Disclaimer:
The above opinions given constitute general market commentary, and do not constitute the opinion or advice of IC Markets or any form of personal or investment advice.
Any opinions, news, research, analyses, prices, other information, or links to third-party sites contained on this website are provided on an "as-is" basis, are intended only to be informative, is not an advice nor a recommendation, nor research, or a record of our trading prices, or an offer of, or solicitation for a transaction in any financial instrument and thus should not be treated as such. The information provided does not involve any specific investment objectives, financial situation and needs of any specific person who may receive it. Please be aware, that past performance is not a reliable indicator of future performance and/or results. Past Performance or Forward-looking scenarios based upon the reasonable beliefs of the third-party provider are not a guarantee of future performance. Actual results may differ materially from those anticipated in forward-looking or past performance statements. IC Markets makes no representation or warranty and assumes no liability as to the accuracy or completeness of the information provided, nor any loss arising from any investment based on a recommendation, forecast or any information supplied by any third-party.
CFDGOLD trade ideas

XAUUSD clean to dropXAUSD CLEAN TO DROP for the next 3 weeks
I will bee waiting for this set up and now all that we need is patience

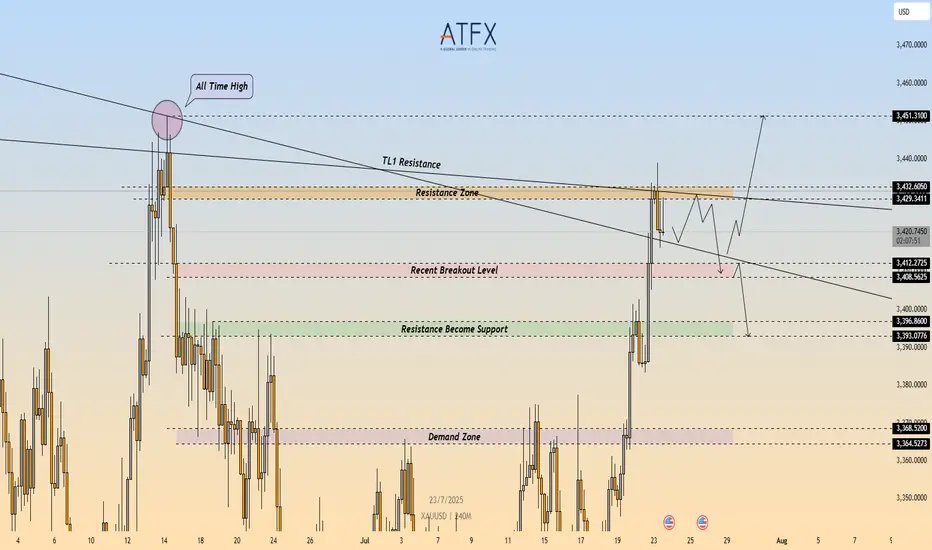
XAU/USD: Bearish Rejection at $3,432 – Short Setup in Play🔴 XAU/USD – Bearish Rejection at Key Resistance Zone ($3,432)
🔍 Technical Outlook
Gold (XAU/USD) failed to break through the $3,429–$3,432 resistance zone, which aligns with a descending trendline (TL1) and prior swing high. The rejection from this confluence zone is reinforcing bearish pressure, with price now carving out lower highs on the 4H timeframe.
A clean break below $3,412 would confirm bearish continuation and open the door toward the $3,400 area, followed by the demand zone at $3,368–$3,365.
🔻 Short Setup
Entry: 3,432
Stop Loss: 3,436
Take Profit 1: 3,412
Take Profit 2: 3,396
R\:R Ratio: ≈ 1 : 6.95
Invalidation: Close above 3,436
📌 Key Levels
Resistance: 3,429 – 3,432
Support 1: 3,412
Support 2: 3,368 – 3,365
Trendline: Long-term descending resistance acting as ceiling
📘 Summary
Gold remains capped beneath a critical resistance cluster. The rejection around $3,432 could trigger a deeper pullback toward $3,396, especially if sellers push price below $3,412. Bearish bias remains valid while price holds under the trendline.
📉 Bias: Bearish
📈 Confirmation Trigger: Break below $3,412
⚠️ Invalidation Level: Above $3,436
GOLD → Consolidation before the next jump to 3450?FX:XAUUSD continues to rally, with the price updating its local high to 3438 and moving into consolidation, possibly for another jump...
After hitting a five-week high of $3,438, traders are taking a break. Optimism is fuelled by Trump's statements about the largest deal with Japan and negotiations with Canada, but uncertainty about the details of the agreements and political instability in Japan are keeping caution in check. The market is waiting for further signals on trade and political issues, which remain key factors for gold.
Technically, the dollar continues to fall, which generally supports gold. But! Gold is approaching strong resistance at 3445-3450, where growth may be temporarily halted.
Resistance levels: 3433, 3446
Support levels: 3416, 3401, 3375
As part of a local correction, gold may test consolidation support or 0.5-0.7f before continuing to rise. There are quite a few orders in the 3433-3446 zone, and it will be difficult to break through this area to reach the target. Consolidation before this level may help the rise to continue.
Best regards, R. Linda!

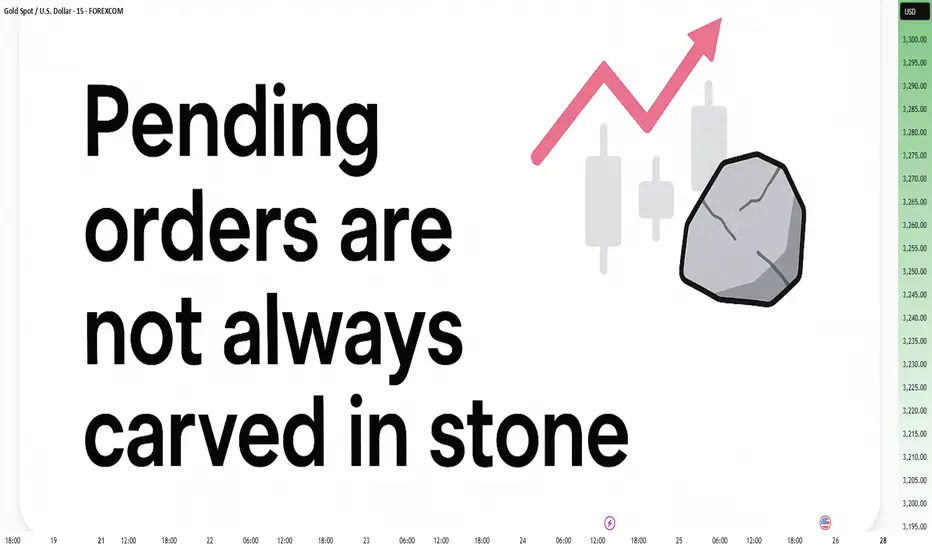
Pending Orders Are Not Set in Stone – Context Still MattersIn a previous educational article, I explained why I almost never trade breakouts on Gold.
Too many fakeouts. Too many emotional traps.
Instead, I stick to what works:
• ✅ Buying dips
• ✅ Selling rallies
But even these entries — placed with pending orders — are not automatic.
Because in real trading, price is not just a number — it’s a narrative.
And if the story changes, so should the trade.
________________________________________
🎯 The Setup – Buy the Dip Around 3400
Let’s take a real example from yesterday.
In my analysis, I mentioned I would look to buy dips near 3400, a former resistance now acting as support.
Price dropped to 3405, just a few points above my pending buy at 3402.
We saw a clean initial bounce — confirming that short-term support was real.
But I missed the entry by 30 pips.
So far, so good.
But here’s the important part — what happened next changed everything.
________________________________________
🧠 The Rejection Shifted the Entire Story
The bounce from 3405 was immediately sold into at 3420, a newly formed short-term resistance (clearly visible on the 15-minute posted chart).
After that, price started falling again — heading back toward my pending order.
📌 At that point, I cancelled the order. Why?
Because the context had changed:
• Bulls had tried once — and failed at 3420
• Sellers were clearly active and waiting above
• A second drop into my level wouldn’t be a clean dip — it would be retest under pressure.
The market was no longer giving me a “buy the dip” setup.
It was showing me a failed recovery. That’s a very different trade.
________________________________________
💡 What If It Had Triggered?
Let’s imagine that price had hit 3402 first, triggering my order.
Then rebounded, failed at 3420, and started dropping again.
Even then, I wouldn’t hold blindly.
Once I saw the rejection at 3420, I would have understood:
The structure had shifted.
The bullish case is weakening.
Exit early — breakeven or small controlled loss.
________________________________________
🔁 Sequence > Level
This is the most important principle:
• ✅ First down, then up = healthy dip → shows buyers are still in control
• ❌ First up, then down = failed breakout → shows selling pressure is stronger
Two scenarios. Same price. Opposite meaning.
That’s why you should look for:
Not just where price goes — but how it gets there.
________________________________________
🔒 Pending Orders Are Conditional
Many traders treat pending orders like traps:
“Just let price come to my level, and I’m in.”, but you should refine a little
✅ Pending orders should be based on a conditional expectation
❌ Not a fixed belief that the zone must hold
If the market tells a different story, remove the order.
No ego. No drama. Just process.
________________________________________
📌 Final Thought
Trading isn’t just about catching a price.
It’s about understanding price behavior.
First down, then up = strength.
First up, then down = weakness.
Let the market show its hand — then decide if you want to play.
Disclosure: I am part of TradeNation's Influencer program and receive a monthly fee for using their TradingView charts in my analyses and educational articles.
Gold Outlook for Today Todays outlook for Gold - I really cant share my strategy, if you want it, just send me a message and I will, It very simple, I think trading is simple, we just over think and complicate things
Gold Trade Plan 23/07/2025Dear Traders,
What we see on the chart is that the price is trying to reach the previous pivot around the 3450 area. I expect a correction from this level towards the 3370 area.
Regards,
Alireza!
Gold 30Min Engaged ( Bullish & Bearish Reversal Entry's Detected————-
➕ Objective: Precision Volume Execution
Time Frame: 30-Minute Warfare
Entry Protocol: Only after volume-verified breakout
🩸 Bullish reversal : 3354.5
🩸 Bearish Reversal : 3379
➗ Hanzo Protocol: Volume-Tiered Entry Authority
➕ Zone Activated: Dynamic market pressure detected.
The level isn’t just price — it’s a memory of where they moved size.
Volume is rising beneath the surface — not noise, but preparation.
🔥 Tactical Note:
We wait for the energy signature — when volume betrays intention.
The trap gets set. The weak follow. We execute.
Gold price analysis July 25Gold Analysis – D1 Uptrend Still Maintains, But Needs New Momentum
Yesterday’s trading session recorded a D1 candle closing above the Breakout 3363 zone, indicating that buying power in the US session is still dominant. This implies that the uptrend is still being maintained, although the market may need a short-term technical correction.
In today’s Tokyo and London sessions, there is a possibility of liquidity sweeps to the support zone below before Gold recovers and increases again in the New York session.
Important to note:
The uptrend will only be broken if Gold closes below the 3345 zone on the D1 chart.
In this case, the 3320 level will be the next support zone to observe the price reaction and consider buying points.
For the bullish wave to continue expanding towards the historical peak (ATH) at 3500, the market needs stronger supporting factors, which can come from economic data or geopolitical developments.
📌 Support zone: 3345 – 3320
📌 Resistance zone: 3373 – 3418
🎯 Potential buy zone:
3345 (prioritize price reaction in this zone)
3320 (in case of breaking through 3345)
🎯 Target: 3417
Completion of rising wedge Gold is currently still holding rising channel along with the swing moves we were on buy at 3410 and my optimal target was 3425-3430 which is achieved now I'm expecting the reversal move!!
What's possible scanarios we have?
▪️I'm looking for sell opportunity from 3430-3435 area by following our structural strategy, also we have previous moves on Rising channel, market always respect its prevoius BOS and my Selling trade target will be 3405 then 3395 in extension.
▪️if H4 candle closing above 3435-3438 this Parallel moves will be invalid.

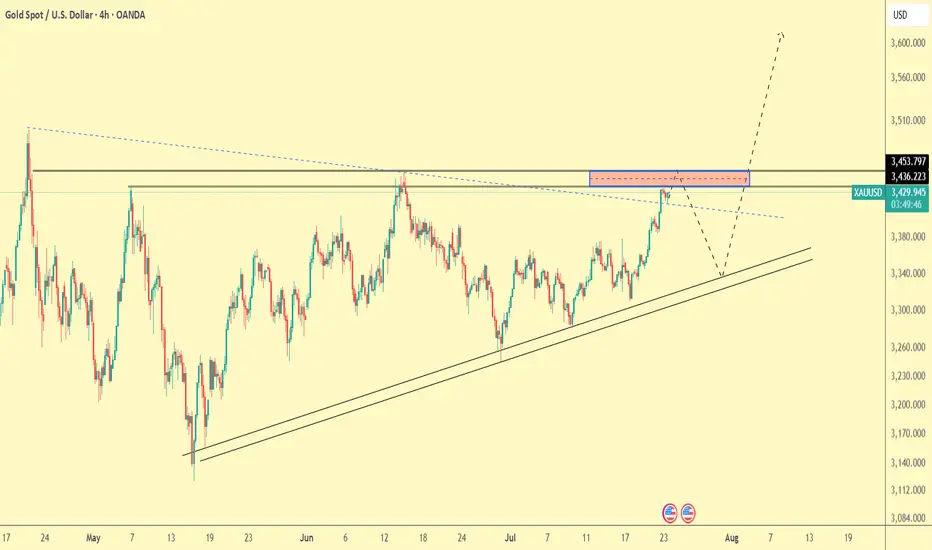
Lingrid | GOLD Weekly Analysis: Testing Resistance ZoneOANDA:XAUUSD markets are showing renewed strength as prices continue to test the highest levels reached in the first week of this month, demonstrating persistent bullish momentum despite ongoing consolidation. The precious metal is approaching a decisive technical juncture that could determine the next major directional move.
The chart reveals a compelling technical setup with gold forming higher lows while maintaining the upward trend continuation. After the previous fake breakout and flag pattern completion, the market has established a solid foundation above the $3,330 support level. The current structure shows a series of higher lows, confirming the underlying bullish bias.
The weekly high retest presents a crucial inflection point. A successful break above this level could trigger the next major leg higher toward the $3,400+ target zone, particularly given the ascending triangle formation and persistent institutional interest. The convergence of multiple technical indicators, including the trend continuation pattern and higher low formation, suggests accumulation at current levels.
Key levels to monitor include the immediate resistance at $3,393 and the critical $3,450 level. A decisive break above these levels would likely accelerate momentum toward $3,500-$3,600, while failure to maintain the higher low structure could see a pullback toward $3,285 support. The overall technical picture remains constructively bullish within the broader uptrend.
If this idea resonates with you or you have your own opinion, traders, hit the comments. I’m excited to read your thoughts!
Report - 25 jully, 2025U.S.–EU Tariff Negotiations Stabilizing Markets
Reports confirm the U.S. and EU are nearing a deal for 15% reciprocal tariffs—lower than the initially threatened 30% by President Trump. This easing of tensions led to moderate equity gains in both blocs, with the Stoxx 600 reaching a 6-week high before closing +0.2%. Pharmaceutical and auto stocks outperformed (Volkswagen +2.3%, Bayer +2.3%).
Forecast: If the 15% deal is finalized by the August 1 deadline, it would remove a key overhang on equities and boost cyclical sectors reliant on transatlantic trade. A failure, however, risks escalation, triggering retaliatory tariffs by the EU on $93bn of U.S. goods, dragging risk assets sharply lower.
DXY Outlook: Tariff de-escalation boosts safe-haven flows and investor optimism, supporting USD strength.
S&P 500: Short-term relief rally expected if the 15% tariff framework is signed. However, margin compression risks remain from lingering supply chain disruptions.
Tesla vs Trump: Policy Shock Rattles EV Sector
Elon Musk warned that Trump's anti-EV stance and trade war posture will sharply erode Tesla’s regulatory credit revenue and remove the $7,500 EV tax credit. Tesla's stock has cratered 37% since December, with a sharp 8% drop yesterday. Adjusted Q2 net income was down 22%, revenue -12%.
Risk Forecast: Loss of EV subsidies + political fallout between Musk and Trump could drag Tesla further and dampen broader EV sector growth.
XAUUSD: Rising political uncertainty and risks to the U.S. tech sector may drive safe-haven flows into gold.
Dow Jones: Tesla's underperformance and anti-EV policies could limit industrial sector gains.
ECB Holds Rates Amid Trade Risk Fog
The European Central Bank paused its easing cycle, holding the benchmark rate at 2%. Lagarde emphasized a "wait-and-watch" stance, signaling uncertainty due to unresolved trade talks and tariff volatility.
Market Implication: Eurozone government bond yields rose (10Y Bund at 2.70%), paring rate-cut bets. The euro softened to $1.1760.
EURUSD: Lack of further ECB accommodation and weaker consumer confidence amid trade frictions.
Fed Independence in Jeopardy? Market Confidence Wobbles
Pimco warned that White House pressure on Fed Chair Powell—including potential firing and scrutiny over $2.5bn HQ renovations—could destabilize markets. Trump continues pushing for aggressive 1% rates, diverging from current 4.25–4.5% levels.
Fiscal/Political Implication: Undermining Fed autonomy risks flight from U.S. bonds, undermining monetary policy credibility and capital inflows.
USDJPY: Yen may gain if markets lose faith in U.S. institutional integrity, despite rate differentials.
DXY: Temporary support from yields, but structural downside if Fed credibility erodes.
Deutsche Bank and BNP: Diverging Strengths in Volatile Landscape
Deutsche Bank posted its strongest Q2 in 18 years, driven by litigation charge reversals and stable investment banking performance. BNP Paribas also reported solid FICC trading (+27%), though equity trading lagged due to weak derivatives demand.
Equity Implication: Strong capital returns and stable European banking profitability support DAX resilience amid trade noise.
DAX: Boosted by banking and auto outperformance.
China–EU Trade Strains Escalate
Von der Leyen directly confronted Xi Jinping over trade imbalances and support for Russia. EU exports to China are down 6% YoY while Chinese imports to the EU are up 7%. Xi defended Beijing’s stance, warning against "decoupling" rhetoric.
Geostrategic Implication: EU may escalate anti-dumping and export control measures. Markets may see renewed volatility in European industrials and luxury sectors reliant on China.
XAUUSD: Rebalancing of power and heightened East–West tensions favor gold.
Oil Oversupply Warning from TotalEnergies
Total warned of an oil glut due to OPEC+ production increases and weakening global demand. Q2 profits fell 30% YoY. Brent now likely to stay within $60–70 range barring major geopolitical flare-ups.
Crude Oil: Short- to medium-term downside risk with soft demand and oversupply fears.
Energy Stocks: Dividend maintenance remains but debt levels and margin pressures may weigh.
AI Spending Surges – Alphabet and SK Hynix
Alphabet posted a 19% Q2 profit jump as AI integration boosts search volumes. Google’s cloud revenues rose 32%. Capex raised to $85bn. SK Hynix also posted record revenues from high-bandwidth memory chip sales, extending its lead over Samsung.
S&P 500: AI-driven earnings upside bolsters tech sector. Expect multiple expansion in mega-cap AI-exposed names.
XAUUSD : Robust AI investment supports risk appetite but inflationary fears could lift gold marginally.

"XAU/USD Hits Major Demand – Is a Relief Rally Brewing?"🟡 XAU/USD (Gold) – Demand Zone Rejection in Play | Bullish Correction Ahead?
Timeframe: 30-Minute | Date: July 25, 2025
Created by: AllyPipsExpert
Indicators: Ichimoku Cloud, BOS (Break of Structure), Dynamic S/R, Trendlines
---
🔍 Technical Analysis & Key Insights:
🔸 1. Market Recap – Distribution & Downtrend Confirmation:
After the Break of Structure (BOS) near 3385, gold confirmed a bearish reversal following the distribution phase at the top resistance zone around 3445–3460.
Bearish momentum was sustained by a descending trendline, paired with a bearish Kumo (Ichimoku cloud) crossover.
🔸 2. Major Zone Tagged – Key Demand Area Tested:
Price has now reached the critical demand block at 3320–3340, a zone that previously initiated bullish impulse on July 18–19.
The current bullish projection (in blue) reflects potential short-term recovery or correction phase, following oversold conditions and historical support strength.
🔸 3. Bullish Reversal Potential – Short-Term Retracement?
The blue arrow reflects a likely bullish retracement toward 3360–3380, aligning with trendline retest and potential Kumo rejection.
Expect sellers to re-enter if price retests former BOS/imbalance zone, creating scalp or swing sell setups on confirmation.
---
🔧 Confluences & Technical Highlights:
Confluence Point Description
Demand Zone Strong previous accumulation at 3320–3340
BOS Retest Area Key liquidity level now acting as resistance
Ichimoku Cloud Price below cloud = bearish bias maintained
Descending Trendline Reinforces bearish structure unless broken
Price Action Rejection wick at demand + potential short squeeze
---
🎯 Trade Outlook:
🧭 Bias: Short-Term Bullish Rebound → Long-Term Bearish Continuation
🟩 Support: 3320 – 3340
🟥 Resistance: 3360 – 3385 (BOS & Trendline zone)
🔁 Scenario: Bounce → Retest → Continuation lower (unless breakout confirmed)
---
📘 Why This Chart Could Be Featured:
✅ Multi-layered Analysis: BOS, zones, cloud, price action, and psychological zones used together.
✅ Forward-Looking: Projects the next logical market reaction instead of just explaining the past.
✅ Clean, Structured, Educational: Layout and visuals guide the viewer through logical trade steps.
✅ Value-Packed: Provides actionable levels and flexible scenarios — helpful to traders of all levels.

XAUUSD Our old trade is holding in profits from top. but this one is reetry and played well but news can change thing dramatically
Manage risk at first
Sell short plan 15 minutes time frame

Is Smart Money Selling Gold? A VSA LookHey Traders,
Let's take a look at the Gold (XAU/USD) 1-hour chart using Volume Spread Analysis (VSA). The price made a strong run-up to a new high around $3,438, but the volume is telling us a story of potential weakness.
Here’s a simple breakdown of what I'm seeing.
The Trap at the Top (Signs of Weakness)
Think of the market as being moved by "smart money" (professionals) and "herd money" (the crowd).
Climax Volume: See that huge volume spike right at the peak on July 23rd? While it looks like strong buying, this is often a classic sign of a Buying Climax. This is where smart money starts selling their positions to the excited crowd who are buying at the top, fearing they'll miss out.
No Real Buyers Left: After the peak, notice how the price tried to push higher a few times but on much lower volume? This is a "No Demand" signal. It’s like a car trying to rev its engine, but it's out of gas. It shows there isn't enough buying power to push the price any higher.
Sellers Take Control: As the price started to fall from the top, look at the volume on the down bars. It got bigger. This tells us that supply (selling pressure) is now in control, and they are pushing the price down with force.
Where Are We Now?
The price has dropped and is now hovering around the $3,330 area. The volume has dried up for now, which means the market is taking a pause and deciding where to go next.
What to Watch For Next
Based on the VSA story, here are two possible scenarios:
Scenario 1 (Bearish 📉): The weakness continues. If we see the price try to rally from here but the volume is very low, it would be another major red flag. It would suggest sellers are still in control, and we could see a break below the recent low of $3,320 for another leg down.
Scenario 2 (Bullish 📈): This is a bear trap. For this to happen, we would need to see a strong sign of buying returning. For example, a sharp drop on massive volume that is quickly bought back up. This would signal that the sellers have been absorbed and smart money is starting to buy again.
Conclusion:
For now, the evidence points more towards weakness. The action at the top suggests that smart money was distributing (selling) their gold.
Key Takeaway: Be cautious of any weak-looking bounces. The sellers appear to have the upper hand until we see a clear sign of strength with high buying volume.
This is not financial advice. This is just my interpretation of the chart using VSA. Always do your own research and manage your risk. Good luck trading!

XAU/USD – Likely Wave ⑤ Top In – ABC Correction in Progress!OANDA:XAUUSD
✅ We’ve most likely completed our (Circle) Wave ⑤, and are now entering the first corrective wave of an ABC pattern (marked in 🟡 yellow brackets).
🔹 The (A) wave unfolded as a clean white ABC correction – textbook structure, worked out perfectly.
🔹 From (A) to (B) we saw an impulsive move (likely a 1-2-3-4-5, though not labeled).
🔻 From (B), a strong bearish move broke right through our 🔴 ascending trendline, signaling a potential trend reversal.
👉 We’ve likely completed wave 1 of the new downtrend and are now in a corrective move upward, forming yellow wave 2:
🟡 (A) – (B) – (C), with the (B) once again forming an internal ABC structure.
🎯 We’re now watching for the completion of wave C – this will complete yellow wave 2.
📐 The target zone (TP) lies in the yellow Fibonacci retracement area, with a key level at the 78.6% retracement (marked in white).
🛑 Stop Loss should be placed above the 4-month zone, or just above wave (B).
📊 The Take Profit will be more precise once the top of wave C is confirmed – but expect it to align closely with the 🔵 Fibonacci extension zone.

Gold scalp buying opportunity before final dropGold has broken above the mini bull flag formation and is currently sustaining above the structure. The strategy is to patiently await a pullback into the highlighted buy-back zone, where a favorable entry opportunity may present itself. Focus remains on the projected flag targets, as the ongoing momentum suggests promising upside potential. Monitor price action closely.

GOLD continues to correct down, good news from trade situationOANDA:XAUUSD has fallen sharply again, currently trading around $3,360/oz, reflecting the easing of global trade tensions, affecting demand for safe-haven assets. The US Dollar and US Treasury yields have also increased, affecting gold prices.
The US Dollar Index ( TVC:DXY ), which tracks the greenback against six other currencies, rose to 97.56.
The yield on the 10-year US Treasury note US10Y rose to 4.386%. The US real yield, calculated by subtracting inflation expectations from nominal interest rates, rose nearly 3.5 basis points to 2.046%.
Markets are increasingly optimistic about such deals after the United States and Japan reached a trade deal, and the European Union could be next. In addition, rising stock markets and low volatility have kept gold's gains in check.
The United States and the European Union are moving toward a potential trade deal that would include a 15% tariff on EU goods and zero tariffs on some items.
The European Commission said Thursday that a negotiated trade solution with the United States is within reach.
“Our focus is on reaching a negotiated outcome with the United States,” a European Commission spokesperson told reporters about the EU-U.S. tariff talks. “We believe that such an outcome is achievable.” The European Commission has repeatedly said that its current priority is to reach a deal with the United States to avoid the 30% tariffs that U.S. President Trump has proposed to impose on EU products starting August 1.
On the economic data front, initial jobless claims in the United States unexpectedly fell last week, suggesting the job market remains solid.
The U.S. Bureau of Labor Statistics reported on Thursday that initial jobless claims fell to 217,000 in the week ended July 19, below expectations of 227,000 and down from 221,000 the previous week.
Technical Outlook Analysis OANDA:XAUUSD
Gold is heading for its third consecutive day of decline since hitting the bullish target level sent to readers in the weekly edition on Sunday at $3,430.
Despite the sharp decline, gold still has enough technical conditions for an uptrend given its current position and structure.
Specifically, gold is still above the EMA21, which is considered the nearest support at the moment. Along with that, the uptrend price channel is the short-term trend. However, for gold to qualify for a short-term bullish cycle, it needs to be confirmed by price action above the 0.236% Fibonacci retracement level, then the target is $3,400 in the short term, more than $3,430.
On the other hand, RSI is still holding above 50, and 50 in this case acts as momentum support. Therefore, gold still has room to rise.
In case gold is sold below EMA21, it may suffer a further decline with the next target around $3,310 in the short term, more than $3,300 and the 0.382% Fibonacci retracement level. And if gold loses the support at the 0.382% Fibonacci level, it will qualify for a bearish cycle.
Intraday, the current position of gold price is still tilted towards the upside, and the notable price points will be listed as follows.
Support: $3,350 – $3,310 – $3,300
Resistance: $3,371 – $3,400 – $3,430
SELL XAUUSD PRICE 3406 - 3404⚡️
↠↠ Stop Loss 3410
→Take Profit 1 3398
↨
→Take Profit 2 3392
BUY XAUUSD PRICE 3329 - 3331⚡️
↠↠ Stop Loss 3326
→Take Profit 1 3337
↨
→Take Profit 2 3343

XAUUSD swing is ready Gold is currently still holding rising channel we were on sell throughout today and achieved with 180 PIPs TP Hit now I'm going to take Buy trade at 3350-3340 zone
What's possible scanarios we have?
▪️I'm gonna take buy trade from 3340-3350 area by following our rising Trend along with structural liquidity sweeps strategy, my target will be 3365 then 3378 in extension.
▪️if H4 candle closing below 3335 this Parallel moves will be invalid and don't look for buy till confirmation

XAUUSD NEW OUTLOOKXauusd buy from 3360
Tp1 3370
Tp2 3380
Tp3 3390
Stope Lose 3350
TRADE AT YOUR OWN RISK

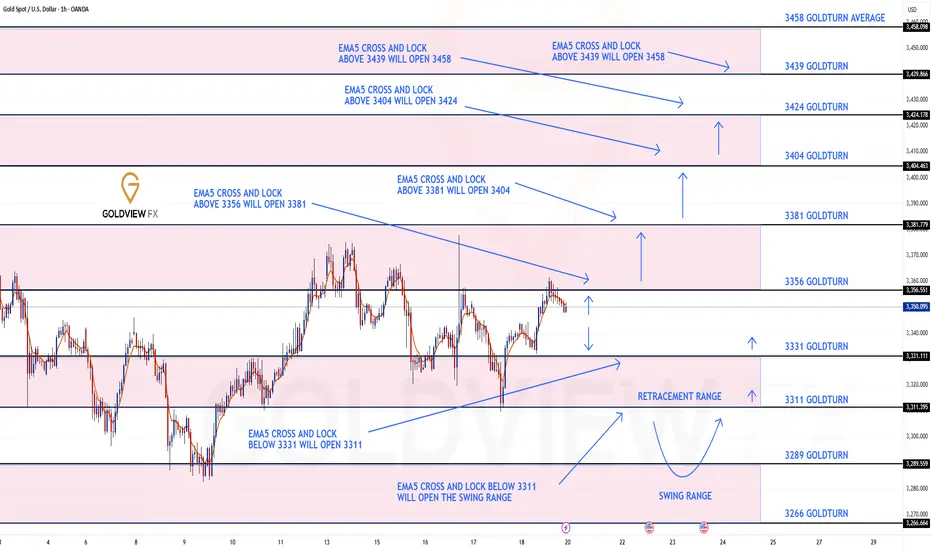
GOLD 1H CHART ROUTE MAP UPDATE & TRADING PLAN FOR THE WEEKHey Everyone,
Please see our updated 1h chart levels and targets for the coming week.
We are seeing price play between two weighted levels with a gap above at 3356 and a gap below at 3331. We will need to see ema5 cross and lock on either weighted level to determine the next range.
We will see levels tested side by side until one of the weighted levels break and lock to confirm direction for the next range.
We will keep the above in mind when taking buys from dips. Our updated levels and weighted levels will allow us to track the movement down and then catch bounces up.
We will continue to buy dips using our support levels taking 20 to 40 pips. As stated before each of our level structures give 20 to 40 pip bounces, which is enough for a nice entry and exit. If you back test the levels we shared every week for the past 24 months, you can see how effectively they were used to trade with or against short/mid term swings and trends.
The swing range give bigger bounces then our weighted levels that's the difference between weighted levels and swing ranges.
BULLISH TARGET
3356
EMA5 CROSS AND LOCK ABOVE 3356 WILL OPEN THE FOLLOWING BULLISH TARGETS
3381
EMA5 CROSS AND LOCK ABOVE 3381 WILL OPEN THE FOLLOWING BULLISH TARGET
3404
EMA5 CROSS AND LOCK ABOVE 3404 WILL OPEN THE FOLLOWING BULLISH TARGET
3424
EMA5 CROSS AND LOCK ABOVE 3424 WILL OPEN THE FOLLOWING BULLISH TARGET
3458
BEARISH TARGETS
3331
EMA5 CROSS AND LOCK BELOW 3331 WILL OPEN THE FOLLOWING BEARISH TARGET
3311
EMA5 CROSS AND LOCK BELOW 3311 WILL OPEN THE SWING RANGE
3289
3266
As always, we will keep you all updated with regular updates throughout the week and how we manage the active ideas and setups. Thank you all for your likes, comments and follows, we really appreciate it!
Mr Gold
GoldViewFX
Continued price increase - gold increased to 3450⭐️GOLDEN INFORMATION:
Gold prices climbed for a second straight session on Tuesday, gaining over 0.9% as sliding US Treasury yields continued to weigh on the US Dollar. Investors remained cautious amid lingering uncertainty over upcoming US trade agreements. At the time of writing, XAU/USD is trading at $3,427, having rebounded from an intraday low of $3,383.
Yields on US government bonds have now declined for five consecutive days, pressuring the Greenback—reflected in the softer US Dollar Index (DXY). Heightened speculation that the US and European Union (EU) may fail to secure a trade agreement before the looming August 1 deadline has intensified demand for safe-haven assets. As a result, gold surged to a five-week high of $3,433.
⭐️Personal comments NOVA:
Gold price continues to increase, FOMO from the market is good and positive. Heading towards 3450
⭐️SET UP GOLD PRICE:
🔥SELL GOLD zone: 3449- 3451 SL 3456
TP1: $3435
TP2: $3422
TP3: $3405
🔥BUY GOLD zone: $3380-$3378 SL $3373
TP1: $3390
TP2: $3400
TP3: $3415
⭐️Technical analysis:
Based on technical indicators EMA 34, EMA89 and support resistance areas to set up a reasonable BUY order.
⭐️NOTE:
Note: Nova wishes traders to manage their capital well
- take the number of lots that match your capital
- Takeprofit equal to 4-6% of capital account
- Stoplose equal to 2-3% of capital account
