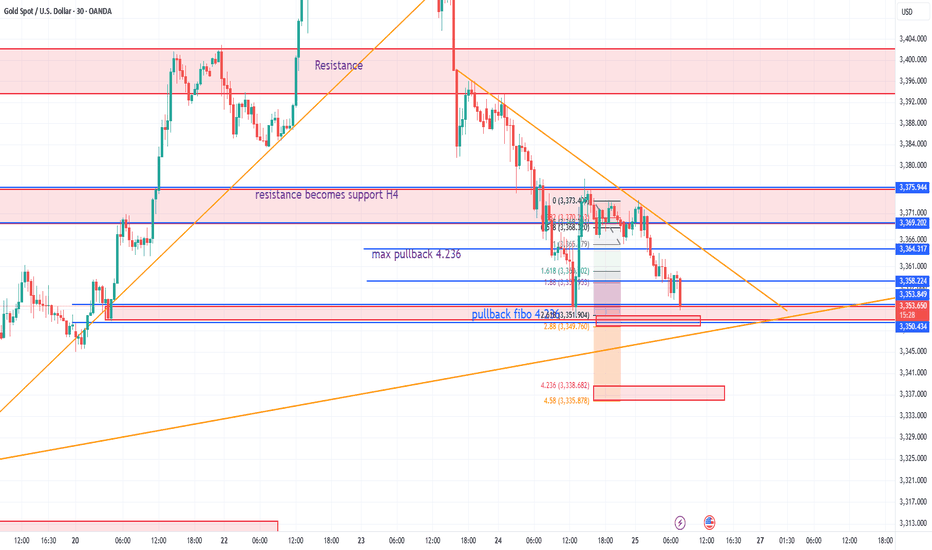
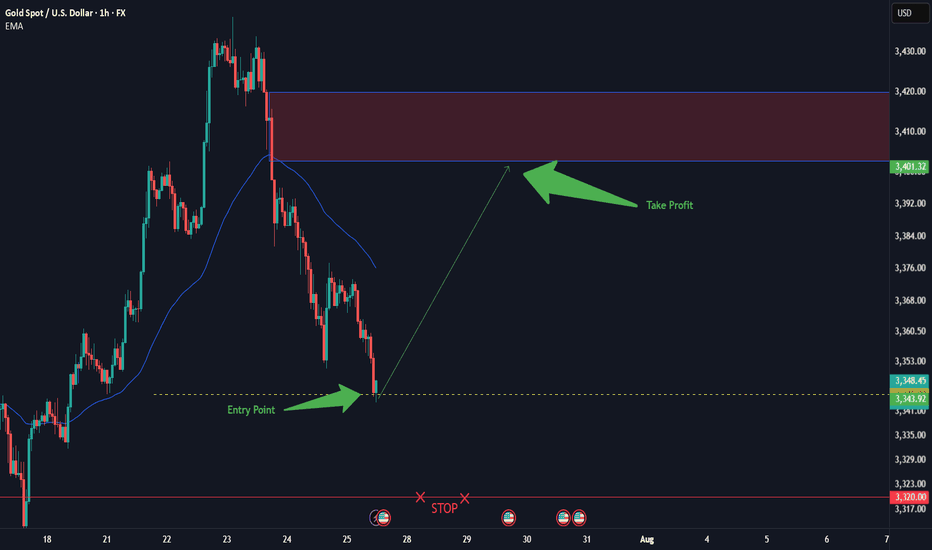
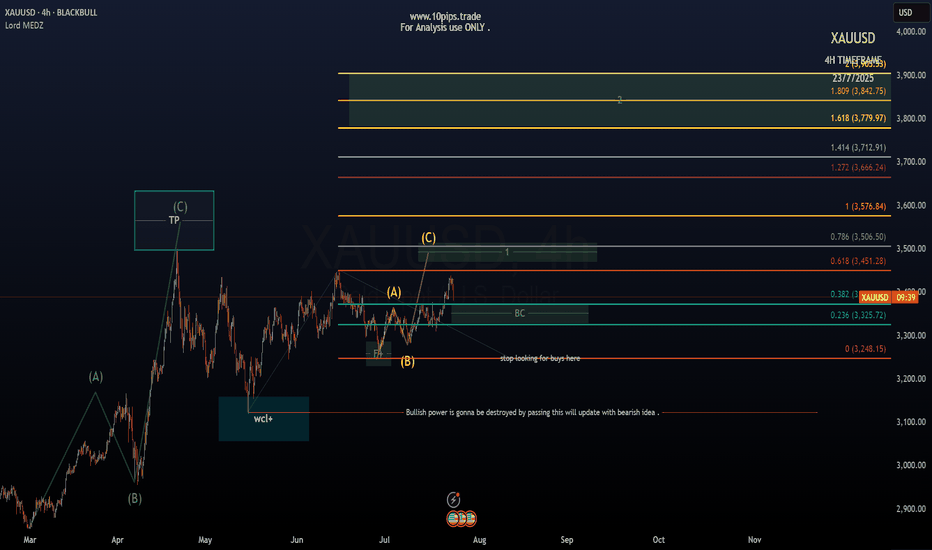
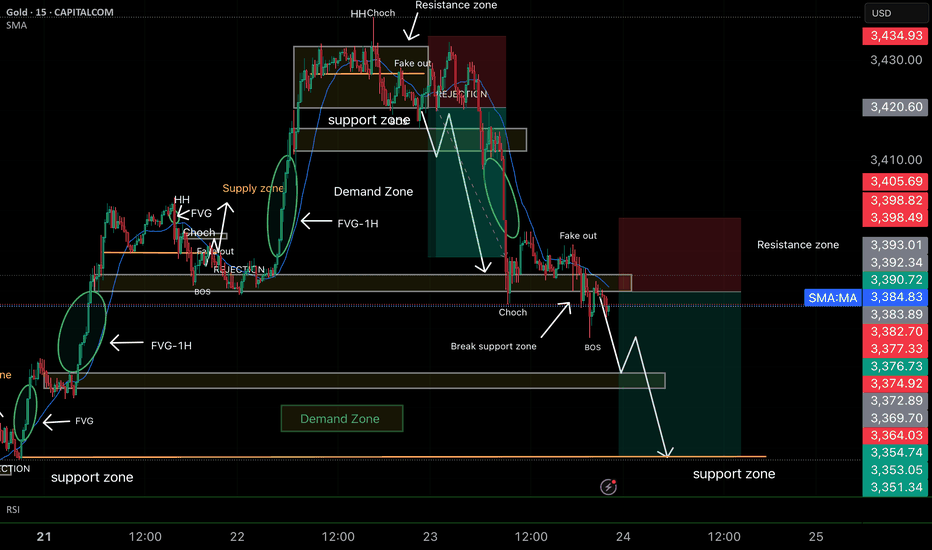
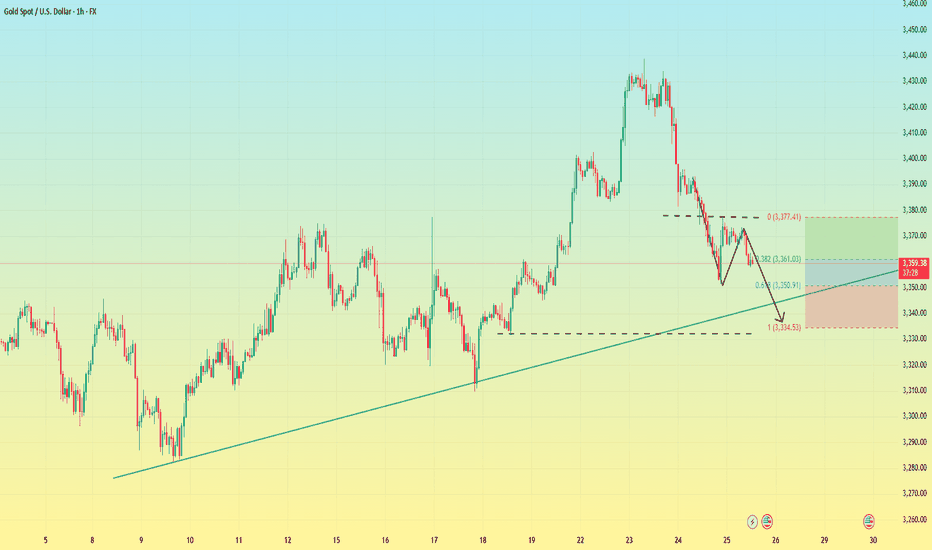
6.30 Safe haven disappears, gold loses its luster!Gold did not break through the upper pressure at midnight last Friday. Gold fell directly after opening in the morning on Friday. The bears broke through the previous 3295 support line, and the lowest reached 3255 in the evening. It closed at around 3274, and the daily line also closed in the form of a big Yin line.
From the 4-hour analysis, the upper short-term resistance focuses on the 3295-3301 line, and the 3316 line is focused on. In terms of operation, it is still rebounding and continuing to be short and follow the trend to fall. The short-term support below focuses on the 3250-3255 line. The overall high-altitude participation tone remains unchanged relying on this range. I will remind you of the specific operation strategy during the session, and pay attention to it in time.
Gold operation strategy:
1. Short gold rebounds at the 3295-3301 line, and short gold rebounds at the 3314-16 line, stop loss at 3326, target 3255-3260 line, and continue to hold if it breaks;
CFDGOLD trade ideas
Gold continues to be weak, but be careful about operations
📣Gold prices fell 2% last Friday, hitting a near one-month low. Optimistic trade-related agreements boosted risk appetite and weakened the attractiveness of gold as a safe-haven asset. This week, the market will usher in a group meeting of major central bank governors around the world (Fed Chairman Powell, European Central Bank President Lagarde, Bank of England Governor Bailey, Bank of Japan Governor Kazuo Ueda, and Bank of Korea Governor Lee Chang-yong). The market will also usher in non-agricultural data. In addition, Powell's remarks on whether to resign may ignite the market this week. Gold prices may fluctuate more around the lower track of the Bollinger Band at $3,270/ounce this week.
Technical analysis:
Last Friday, the K-line had a lower shadow, and the Bollinger Band did not diverge. It is not easy to go short directly in operation, but wait for the rebound to confirm 3295 and the key resistance of ma5 to be short.
💰 Operation strategy: Rebound to 3280-3283 to go short, target 3270-3265, stop loss 3288-3290
XAUMO REPORT: XAUUSD WEEKLY ANALYSIS
Period: Monday June 30 – Friday July 5
Focus: US Independence Day (July 4), NY Market Closure Impact
🟢1. Price Action Context
Last Week (ending June 28):
Weekly bearish engulfing closed near the lows (~3,250 area).
Series of failed rallies above 3,330.
Price compressed in a tight lower range—distribution, not accumulation.
Monday June 30 – Friday July 5:
Market begins in a low-confidence, low-volume environment.
Tuesday–Wednesday: traders will be positioning ahead of July 4 closure.
Thursday (July 4): NY market closed—no COMEX metals futures settlement.
Friday (July 5): NY market reopens—liquidity and volume surge back in.
🟡 2. Range, Support & Resistance
Composite Volume Profile:
VAH: ~3,410
POC: ~3,330 (where the heaviest volume has been transacted)
VAL: ~3,250 (final defense)
Support:
3,250: major structural shelf
3,200: next key liquidity target
Resistance:
3,330–3,350: loaded supply zone
3,390–3,420: overhead liquidity from prior weeks
Interpretation:
Price under POC, hugging VAL, is bearish.
Acceptance under 3,250 sets up a vacuum to 3,180–3,200.
🔵 3. Volume Footprint and Delta
Footprint Characteristics:
Strong negative delta (-21K) as price approached 3,250.
Buyers unable to lift offers at 3,300+.
Repeated ask dominance = supply persistence.
Institutional Read:
They’re selling into every bounce, and liquidity thinness around July 4 increases stop-hunt potential.
🟣 4. Trend and Wave Structure
Weekly trend: bearish
Daily trend: bearish with lower highs and lower lows
Wave count:
Wave 1: 3,500 ➡ 3,273
Wave 2: retrace ~3,330
Wave 3: active—projected target 3,180
🟤 5. Stop Hunt Zones
Above:
3,330–3,350: obvious short stops and breakout buy stops.
Below:
3,250: stop cluster from dip buyers and trapped longs.
Expected Behavior:
Institutions use Wednesday and low liquidity Thursday to spike stops before the real move on Friday.
Stop Hunt Scenario:
July 3–4: quick liquidity sweep above 3,330.
July 5 (Friday): NY reopen—supply steps in, drives price back down.
🟢 6. Market Closure & Liquidity Impact
NY Market Closure Schedule:
July 4 (Thursday):
NY COMEX metals closed for Independence Day.
Forex open but liquidity ~40% of normal.
Price can move erratically with minimal volume.
July 3 (Wednesday):
Early close in many US desks.
Position squaring—thin books.
July 5 (Friday):
Liquidity flood back in—true directional follow-through likely.
Implications:
Avoid heavy positioning during July 4 closure.
Expect false breakouts and “ghost candles”.
Major moves likely Friday July 5 during NY session.
🟠 7. Psychological Dynamics
Retail:
FOMO if price spikes above 3,330 on low liquidity.
Fear if price knifes under 3,250 without volume confirmation.
Institutions:
Use the holiday to:
Clear out stops.
Create liquidity pools.
Accumulate positions for Friday’s push.
🔴
8. Tangible Day-Trader Scenarios
🟢 Scenario A: Pre-Holiday Stop Hunt Trap
When: July 3–4
Price spikes over 3,330 on low volume.
Footprint shows negative delta quickly after.
Execution:
Sell limit ~3,340.
SL: 3,375.
TP: 3,200.
Note: Keep size reduced—thin conditions are volatile.
🟣 Scenario B: Post-Holiday Breakdown
When: Friday July 5
NY opens, volume returns.
Price fails to reclaim 3,250 after test.
Execution:
Sell stop 3,249.
SL: 3,310.
TP: 3,180.
Scale in as confirmation strengthens.
🟠 Scenario C: Holiday Range
When: July 4–early July 5 pre-NY
Price likely ranges 3,250–3,330.
Avoid entries unless volatility contraction ends with volume breakout.
🟡 9. Hypothetical Institutional Trade Plan
✅ Order Type: Sell Stop
✅ Entry: 3,249
✅ Stop Loss: 3,310
✅ Take Profit: 3,180
✅ Position Size: Max 0.5–1% account risk
✅ Trigger: NY session reopens Friday with volume confirmation
✅ Confidence: 85% (post-holiday breakdowns historically have high follow-through)
🟢 10. The Executive Recap
✅ Timeframe:June 30–July 5
✅ Trend:Weekly/Daily bearish
✅ Volume:Negative delta clusters
✅ Stop Hunts:
3,330–3,350 (trap)
3,250 (flush)
✅ Liquidity Event:July 4 closure reduces liquidity by ~60%
False moves likely
Major move probable Friday NY session
✅ Execution:
Low liquidity: reduced size
Confirmation: delta + volume
No chasing pre-closure
#GoldTrading #XAUUSD #ForexTrader #PriceActionTrading #TechnicalAnalysis #VolumeProfile #FootprintAnalysis #InstitutionalTrading #DayTrading #MarketAnalysis #ForexSignals #ComexGold #TradingStrategy #MarketPsychology #LiquidityTraps #StopHunt #NYMarketClosure #July4Trading #MetalsMarket #TrendAnalysis #WaveAnalysis #SupplyAndDemand #SmartMoney #ForexEducation #CMEGroup #TradingMindset #RiskManagement
⚠️ Disclaimer : This is a purely educational scenario. You are the only one responsible for your risk.
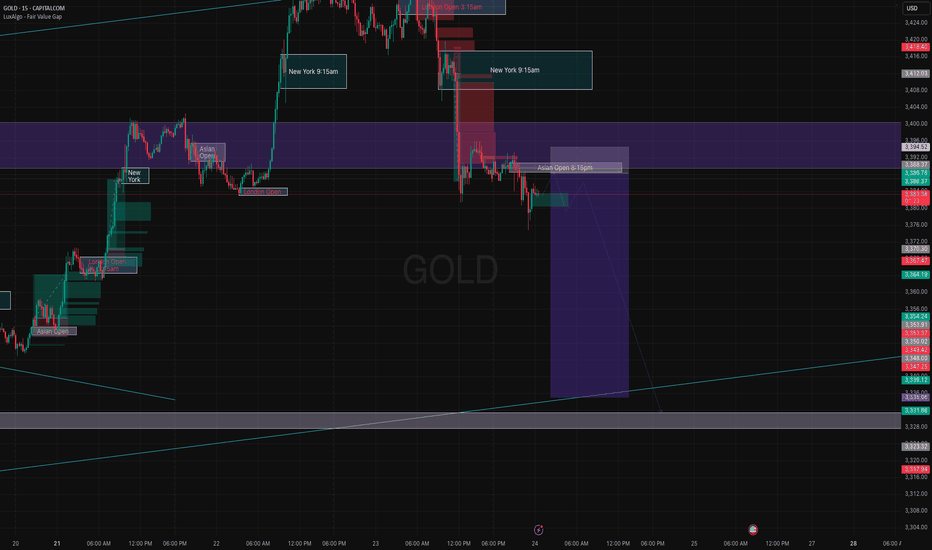
XAUUSD Analysis – June Monthly CloseGold starts the week with a weak bounce attempt after a strong bearish momentum on Friday, which pushed the market below the key 3254 support. The downtrend structure remains valid with a clear pattern of lower highs and lower lows on the 4H chart.
At the moment, price is trapped inside the 3254–3295 range. Despite the strong bearish pressure, we have yet to see a meaningful correction after the sharp drop on June 28th. This opens the door for a potential intraday pullback to test minor supply and moving average resistance near 3291–3297.
However, today is monthly candle close, which means increased volatility and possible false breakouts—especially during US sessions. Traders should be cautious with breakout traps, especially around 3305–3310, where stop hunting might occur.
The bigger picture still favors the bears unless gold manages to break and hold above the descending trendline and the EMA cluster.
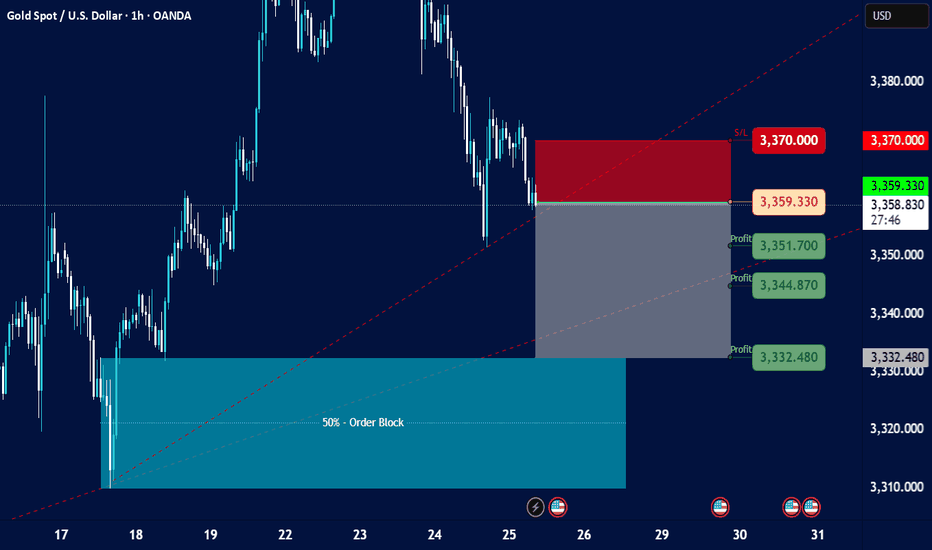
📌 Trade Setup (Short Bias – Intraday Correction)
SELL zone: 3291 – 3297
SL: 3303 (Above supply & EMA test zone)
TP1: 3278
TP2: 3255
TP3: 3215
This is not a high-conviction swing setup but a tactical short based on potential rejection from previous supply and dynamic resistance. Small lot size is recommended due to the wider stop-loss and low R/R reward unless high volatility plays in our favor.
📊 Key Intraday Levels
R3: 3342
R2: 3322
R1: 3295
Pivot: 3254
S1: 3214
S2: 3180
S3: 3123
XAUUSD June 29,2025🟦 XAUUSD Analysis – June 29, 2025
Market Structure:
Price is in a bearish trend on the 1H timeframe.
Liquidity is resting below a recent low around $3,240 (Sell-Side Liquidity – SSL).
There is a visible Order Block (OB) around $3,310–$3,320, which could act as a magnet if price reverses.
Anticipated Move (Blue Path):
1. Price is expected to drop below the SSL to trigger stop-losses and collect liquidity.
2. After the liquidity grab, a bullish reversal is likely.
3. Price may then rally toward the OB, which could act as resistance or a point for institutional selling.
---
🔎 Probability Breakdown:
Event: Break below SSL (~$3,240)
Likelihood: ✅ High
Note: Classic liquidity grab setup
Event: Bullish reversal after sweep
Likelihood: ⚠️ Moderate–High
Note: Wait for confirmation (BOS, FVG, bullish candle)
Event: Rally to OB (~$3,310–$3,320)
Likelihood: ⚠️ Moderate
Note: Depends on bullish structure forming
Event: Rejection from OB
Likelihood: ✅ High
Note: OB may act as supply zone
---
⚠️ Caution:
This scenario is only valid if price grabs SSL first.
No entry should be made without a proper bullish confirmation (e.g., break of structure, fair value gap fill, or strong bullish candle).
Always use risk management – this is a hypothetical setup, not financial advice.
---
XAUUSD: Trend changed to bearish. Significant downside potentialGold turned neutral again on its 1D technical outlook (RSI = 49.253, MACD = 18.142, ADX = 16.679) as it crossed below both the 4H MA200 and 1D MA50. The two form a Bearish Cross. Technically a Channel Down has emerged, no different than those that emerged after rejections on the R1 Zone (like now). As long as the 4H MA50 acts as a Resistance and holds, we will be bearish, aiming at the S1 level (TP = 3,245).
## If you like our free content follow our profile to get more daily ideas. ##
## Comments and likes are greatly appreciated. ##
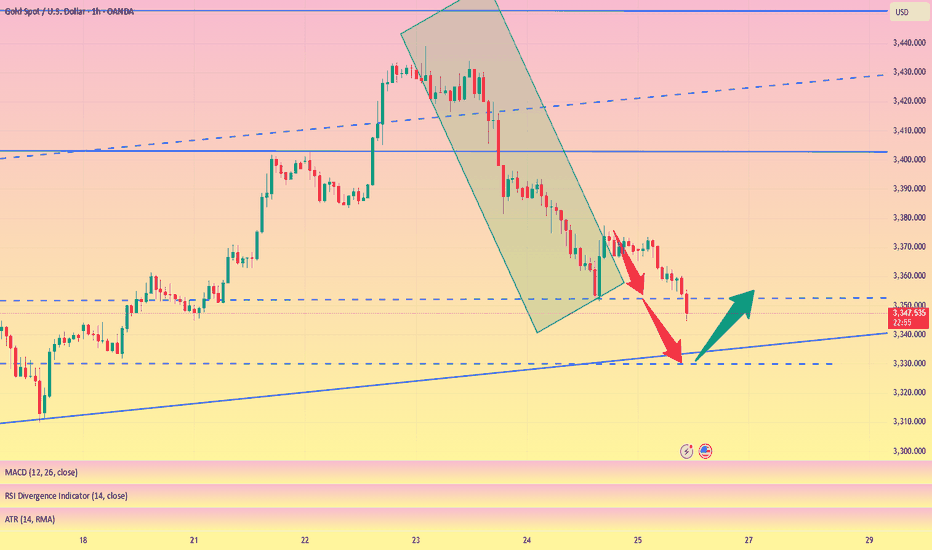
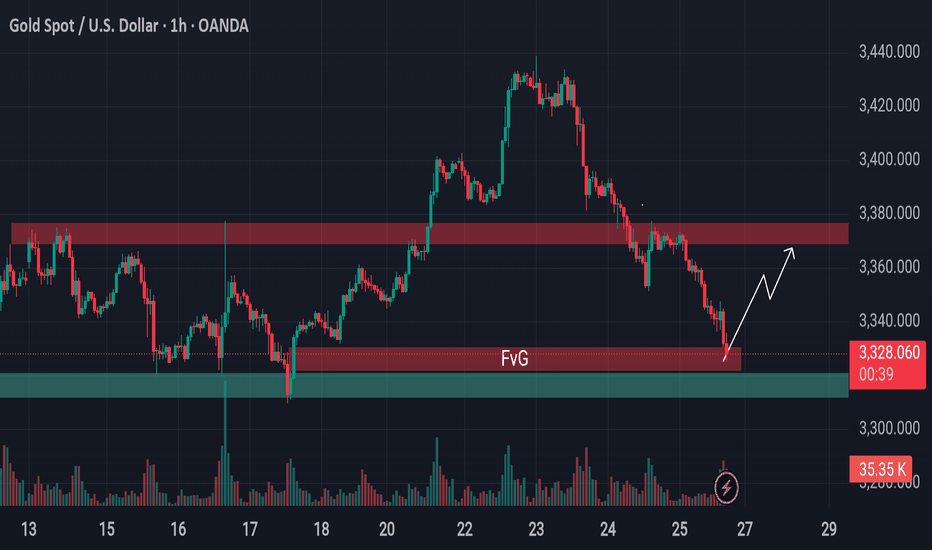
XAUUSD has been in a strong free fall following the sell strategXAUUSD has dropped sharply in a free fall, perfectly following the sell strategy from 3348–3350.
We have won.
Trading Strategy for XAUUSD OANDA:XAUUSD
Based on the current price structure and short-term bias, here are two tactical trade setups:
Sell Setup – If Price Rejects Resistance
Entry: 3,348 – 3,350 USD
Stop-loss: 3,357 USD
Take-Profit 1: 3,340 USD
Take-Profit 2: 3,335 USD
Take-Profit 3: 3,330 USD
Buy Setup – If Price Holds Support
Entry: 3,328 – 3,330 USD
Stop-loss: 3,320 USD
Take-Profit 1: 3,338 USD
Take-Profit 2: 3,340 USD
Take-Profit 3: 3,348 USD
Important: Always set a stop-loss in every trade to manage risk effectively.
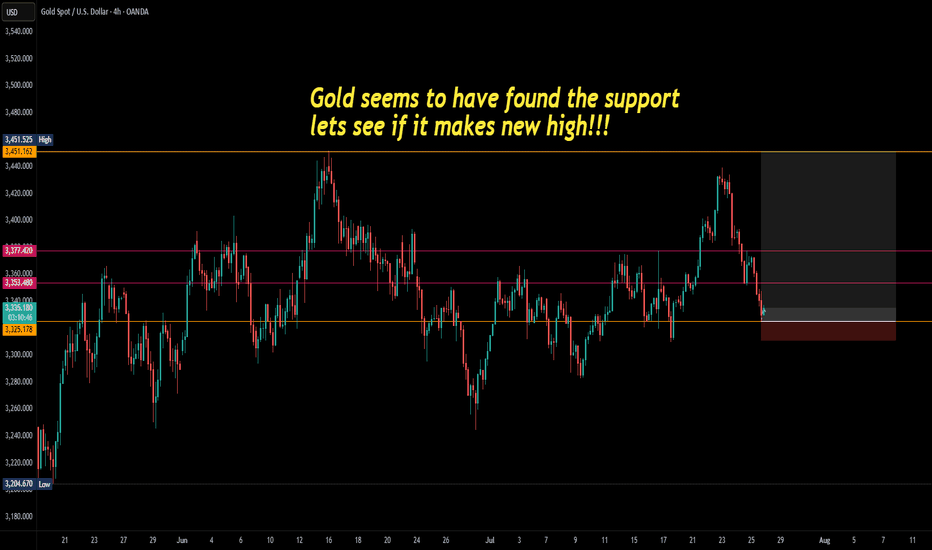
TECHNICALS: Gold on buythrough out last week gold made a reversal pattern on the 1HR TF. It might touch the 3250 price level before heading to the 3350 take profit level this week or it could take off directly from the range it closed at last week. either way, gold is heading for a buy this week based on technical analysis. have a wonderful trading week ahead!!!
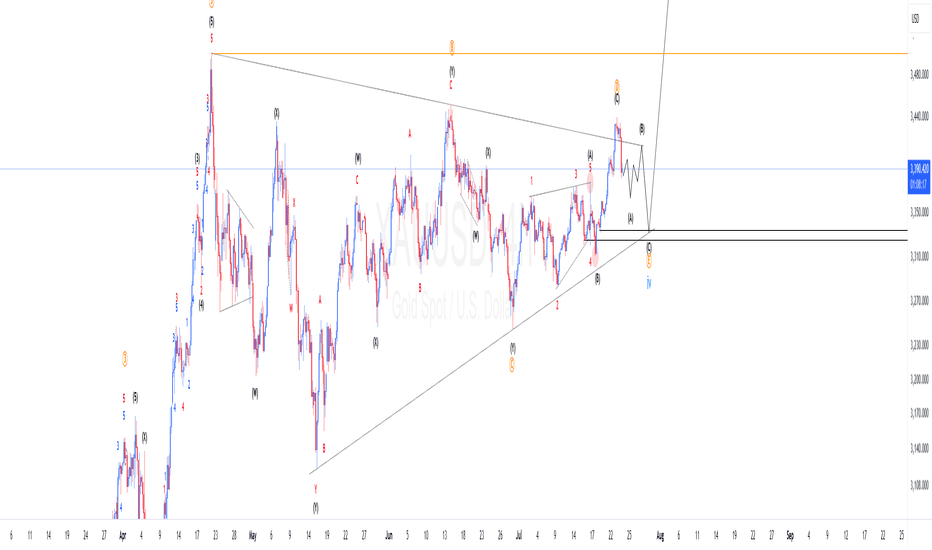
XAUUSD Elliot wave update: Is wave 4 still in play?From our previous count we were anticipating a drop for 4th wave completion. We can see now we have been dropping as anticipated. Given the current wave structure I am expecting a double 3 (wxy) to complete this 4th wave. If we are correct then we should expect price to continue down from current position before pulling back up and fall one more time. To take advantage of the move if not caught at the top, one should find areas where price will find resistance to short the market.
Learn Best Change of Character CHoCH Model in Trading with SMC
Most of the SMC traders get Change of Character CHoCH WRONG!
In this article, I will share with you Change of Character models that have a low accuracy and better to be avoided.
I will teach you the best CHoCH model for Forex Gold trading and show you how to identify it easily.
Let's start with the basic theory first and discuss what Change of Character signifies.
Change of Character in Bearish Trend
In a downtrend, Change of Character CHoCH is an important event that signifies a violation of a bearish trend.
CHoCH is confirmed when the price breaks and closes above the level of the last lower high.
Above, is a text book Change of Character model in a bearish trend.
For the newbie traders, such a price action provides a strong signal to buy while it fact it is NOT .
One crucial thing is missing in this model to confirm a bullish reversal.
According to basic trend analysis rules, we say that the market trend is bullish if the price forms a bullish impulse, retraces and sets a Higher Low HH , forms a new bullish impulse with a new Higher High HH.
Only then, we can say that the market is trading in up trend.
CHoCH model above confirms a bearish trend violation BUT it does not confirm a trend change.
Such a model may easily signify a deeper correction.
Look what happened with GBPNZD.
Though the price formed a confirmed bearish CHoCH, it was a false signal and just an extended correction.
That's a perfect bullish reversal model.
It combines CHoCH and conditions for a bullish trend.
Such a union is extremely accurate in predicting up movements.
Examine a price action on USDJPY.
Not only the price formed a confirmed CHoCH but also we see a start of a new bullish trend.
Change of Character in Bullish Trend
In an uptrend, Change of Character CHoCH is a significant event that signifies a violation of a bullish trend.
CHoCH is confirmed when the price breaks and closes below the level of the last higher low.
Above is a typical model of a bearish CHoCH.
For many traders, that is the signal to open short.
However, it is not that accurate and one important component is missing there.
According to basic price action rules, the market trend is bearish
if the price forms at least 2 bearish impulses with Lower Lows LL and a pullback between them with a Lower High LH.
Only when these 3 conditions are met, a bearish trend is confirmed .
Perfect bearish Change of Character model should include both CHoCH and a bearish trend price action. That will confirm a violation of a bullish trend and start of a new bearish trend.
EURCAD has a very strong potential to continue falling:
not only we see a valid bearish Change of Character but also
a start of a new bearish trend based on a price action.
Next time when you identify CHoCH on forex market, make sure that you check the preceding price action. It will help you to more accurate assess reversal probabilities and make a wiser trading decision.
❤️Please, support my work with like, thank you!❤️
I am part of Trade Nation's Influencer program and receive a monthly fee for using their TradingView charts in my analysis.
A new golden week, grasp it with the best condition
Good weekend everyone, this week's trading time is over, and next week's trading time will also enter the countdown. No matter how you grasp the market this week, whether happy or sad, Theo hopes that everyone will not bring your mood to the trading environment next week.
After all, next week is also a new beginning of the week. In the new week, everyone should be prepared for a new state. A good state should be persevered, and a bad state should be adjusted. With a good state to grasp the market trend of next week, I believe you can also be invincible and grasp the market better!
📊Technical aspects
Gold did not break through the upper pressure at midnight on Friday. Gold fell directly after opening in the morning on Friday. The bears broke through the previous 3295 support line, and the lowest level in the evening was 3255, closing at around 3274.
The daily line also closed in the form of a big negative line, with an obvious downward trend, and all the previous support will also turn into pressure. The short-term moving average system crossed downward to accumulate energy for the bears. Since the closing did not break through the upper 3300 pressure level, we will continue to rebound and short next week. After all, the technical side is still short, and only by following the trend can we keep up with the rhythm of eating meat.
From the 4-hour analysis, the upper short-term resistance is around 3295-3301, with special attention paid to the suppression at 3316. In terms of operation, the rebound continues to be the main short and the trend looks down. The lower short-term support is around 3250-3255. The overall main tone of high-altitude participation remains unchanged relying on this range.
💰Strategy Package
Short Position:3290-3300,SL:3315,Target: 3240-3250
Next week's market trend analysisShort-term technical analysis of gold next week:
After gold was horizontally consolidated below 3400, it had two relatively large retracements. The short-term downward channel, the upper edge of the channel is currently around 3340, which is also the turning point of the short-term long and short cycles that we need to pay attention to later.
Has the current big rhythm entered a weak position?
Daily level analysis: After reaching 3500, gold is still in a trend of high-level consolidation, and there is a periodic switch between long and short positions, and there is no extremely strong or weak rhythm. In this consolidation process, there are two relatively large retracements: the first from 3500 to 3200 space 300 points, the second from 3435 to 3120 space 315 points. In other words, in the current daily level cycle, the maximum decline is around 300 US dollars. Not exceeding this maximum retracement value, to a certain extent, it is still in the rhythm of high-level correction. According to the range of this space retracement, the limit of the daily retracement is around 3150, with an error of about 20 points. However, the daily range is large, so it is too early to talk about this threshold.
At present, the short-term pressure points of 0.618 and the top and bottom structures are all around 3300. Another point for everyone to pay attention to: in the market with a small cycle of negative decline, once there is a sideways trend. Don't take it as support! The price is consolidating horizontally, which only means that the current bulls are weak in pulling back and the change of weakness must be a strong pullback to break through the big negative. Similarly, the slow rise market is the same.
The first support below in the short term is around 3250. The strong support is at the integer level of 3200. Once this position is reached, it will become a repeated test position like 3400.
GOLD ANALYSIS FOR MONDAY MARKET OPEN, 30TH JUNE, 2025Gold looks bearish heading into the new week. We had the formation of a weekly engulfing candle last week. I expect a pullback buy at market open from the current level to a take-profit level of 3316.
After that, I expect a sell-off from the 3318 level down to the 3000 level for the rest of the week.
I will be posting daily updates here, cheers!
XAUUSD Update 29th JUNE 2025Last week, pullback has reached 62% fibonaci.
It have an opportunity to continue the correction in to 3205 support or more lower at 3190 level support.
So we need to becarefull on next week and we looking for a reversal / rejection signal from the market as a confirmation.
We need to give our attention to a fundamental data also. If there is a big news on war / geopolitical or global economic in July, we could be more convidence about gold price direction.
If 3155 lose...it would be more deep, but it would be unlikely.
Have a good luck !
P.S : If you agree, Boost it
GOLD Setup- Bearish Bias!FOREXCOM:XAUUSD Price is forming a series of lower highs and lower lows on the 4‑hour timeframe, indicating a downtrend bias. Recent resistance at the 70 EMA / descending trendline is holding strong,hard to break above.
Based on recent candle pattern with long lower wicks at current price, it’s most likely A short term correctional swing might occur to zone 3295-3310.
Setup:
Entry: 3300-3310
Targets: 3260, 3240, 3210
Stop Loss: 3331
Risk: 1:2,3,5
Disclaimer: This is not financial advice.
.
Welcoming your thoughts in this setup. Let’s grow together<3
Gold trend next week: shorts are dominant, longs are secondaryGold trend next week: shorts are dominant, longs are secondary
(June 29, 2025)
Analysis of current market situation and key price levels:
The gold market has completely entered the short-dominated stage, and the technical pattern shows a typical step-down trend.
This week, the market rebounded to only $3,321 before continuing to fall, breaking through the 3,300 psychological barrier, the 3,280 technical support level and the daily level trend line, forming a standard downward channel.
The current price is testing the key support area of 3,250-3,270.
Moving average system: The 50-day moving average (3,325) and the 200-day moving average (3,288) formed a death cross, and the price continued to fall below all major moving averages.
Trading volume characteristics: When COMEX gold futures fell below 3,300 points, the trading volume increased to 180% of the daily average, indicating an increase in short positions.
Position structure: CFTC data showed that speculative net long positions fell to the lowest level in 12 months.
A single buy order of more than 5,000 lots (about 160 million US dollars) appeared in the 3270 area.
Operation strategy for next week:
Scenario 1: 3270 support level is effective (probability 40%)
Rebound target: 3295 points (intraday) → 3313 points (intraweek)
Operation suggestion:
Radicals can try to go long with a light position at 3268-3272 points. (Stop loss 3258)
Conservatives wait for a breakout of 3285, then fall back to 3278 for follow-up
All long orders are closed in batches above 3310
Scenario 2: Direct break down (probability 55%)
Downward target: 3250→3232 (April low)→3200 psychological barrier
Operation strategy:
Current price short orders can be held to 3250 to close half of the position
Rebound to 3285-3290 to increase short positions (stop loss 3303)
After breaking 3250, be cautious in chasing shorts (to prevent short-term short covering)
Scenario 3: Range oscillation (probability 5%)
Volatility range: 3270-3295
Event-driven strategy:
Focus on July 1 ISM manufacturing PMI (North 22:00 Beijing time)
Fed officials' speeches (especially Williams' speech at 09:30 on July 2)
Institutional order flow analysis:
There are stop-loss orders worth about $320 million below 3270
Above 3300, there are about $280 million of sell orders (mainly from CTA strategies)
Special tips for risk control
Liquidity risk: Market liquidity may drop sharply before the July 4th Independence Day holiday in the United States
Risk of sudden policy changes: There may be changes in the ceasefire agreement between Russia and Ukraine
Technical traps:
Beware of the "false breakthrough" that may appear in the 3270 area
Note the weakening of the short-term correlation between US Treasury yields and gold
In the current market environment, it is recommended to adopt the "main short and secondary long" trading strategy.
For short-term traders, the rebound opportunity in the 3270 area is worth participating in with a light position;
Mid-term investors should remain patient and wait for clearer reversal signals or lower safety margins.
A panoramic analysis of the gold market in June: an in-depth interpretation of geopolitics, monetary policy and price trends.
The current gold market is at a critical turning point, with multiple factors interweaving to affect the short-term fluctuations and long-term trends of gold prices.
As of June 29, 2025, the international gold price has experienced violent fluctuations, falling from the high point at the beginning of the month to a low point in the past four weeks, and market sentiment has shifted from optimism to caution.
This article will comprehensively sort out the latest gold market dynamics, deeply analyze the impact of geopolitical risks, the direction of the Federal Reserve's monetary policy, the global economic situation and technical factors on gold prices, and look forward to the possible trend of the gold market in the future, providing investors with a comprehensive market perspective and strategic recommendations.
The latest gold price trends and market overview:
In June 2025, the international gold market experienced significant price fluctuations, showing a trend of "first rise and then fall". As of the close of June 28, the spot gold price was $3273.11/ounce, down 1.64% from the previous trading day, hitting the lowest level since December 2024;
The multiple factors that led to the plunge in gold prices include:
The strengthening of the Federal Reserve's hawkish signals, the easing of geopolitical risks, and the intensification of technical selling.
The US core PCE price index released on June 27 rose 2.8% year-on-year, higher than market expectations. Several Fed officials publicly stated that "interest rates may be raised by another 50 basis points this year", causing the US dollar index to soar to 107.5, which strongly suppressed gold.
At the same time, the two sides of the Russian-Ukrainian conflict reached a phased ceasefire agreement on June 25, and the market's risk aversion demand dropped sharply, and the gold ETF holdings decreased by 42 tons in a single week.
Technically, the gold price fell below the key point of $3,400, triggering a large-scale liquidation of algorithmic trading. The trading volume of gold futures on the New York Mercantile Exchange (COMEX) surged to three times the usual day, further exacerbating the downward momentum.
From the perspective of market structure, the current gold market shows obvious differentiation characteristics:
On the one hand, institutional investors such as hedge fund giant Bridgewater Fund were exposed to reduce their holdings of gold ETF shares by more than 30% and increase their holdings of US Treasury bonds;
On the other hand, Goldman Sachs lowered its three-month gold target price from $3,600 to $3,100 on the grounds that "the upward cycle of real interest rates has not ended." This shift in institutional behavior reflects the market's pessimistic expectations for gold's short-term prospects.
It is worth noting that despite the short-term weakness, long-term support factors for gold still exist.
Global central bank demand for gold purchases increased by 18% year-on-year in the first quarter of 2025. Central banks in emerging markets such as China and India continued to increase their holdings of gold to diversify foreign exchange reserve risks.
In terms of physical demand, the China-India wedding season (June-August) and the expected "October" consumption peak season, gold jewelry demand accounted for more than 45% of global total demand, and China's gold consumption in 2025 may exceed 1,200 tons (an increase of 8% year-on-year).
This resilience of supply and demand fundamentals provides potential support for gold prices.
The impact of geopolitical risks on the gold market
Geopolitical factors have always been an important variable affecting gold prices. Changes in the global geopolitical pattern in June 2025 have had a significant impact on the gold market.
The sharp fluctuations in gold prices this month are closely related to the evolution of geopolitical events such as the situation in the Middle East and the Russia-Ukraine conflict. These events directly affect the demand intensity of gold as a "safe haven asset" by changing the market's risk aversion sentiment.
The situation in the Middle East has experienced a transition from tension to relaxation this month, becoming a key driver of the rise and fall of gold prices.
In early June, concerns about the escalation of the conflict between Israel and Iran pushed the price of gold to $3,415 per ounce.
Market data shows that for every 10 points increase in the historical geo-risk index, the price of gold has risen by an average of 2.3%.
However, as Israel revised the hostage negotiation plan, direct conflict between Iran and Israel was temporarily suspended, and tensions in the Middle East showed obvious signs of easing.
In late June, Trump publicly declared that "the Israel-Iran conflict is over", further weakening the market's risk aversion demand.
The fading of this geo-risk premium directly led to a decline in the attractiveness of gold as a safe haven asset, becoming one of the important factors for the decline in gold prices.
The development of the Russia-Ukraine conflict also had a significant impact on the gold market.
On June 25, Russia and Ukraine reached a phased ceasefire agreement. This breakthrough has significantly boosted market risk appetite and further weakened the safe-haven demand for gold.
Prior to this, the market had generally worried that if the ceasefire negotiations broke down or the scope of the conflict expanded, it might push up the volatility of gold prices. The conclusion of the ceasefire agreement eliminated this uncertainty, resulting in a 42-ton decrease in gold ETF holdings in a single week, reflecting the rapid cooling of investors' risk aversion.
It is worth noting that although geopolitical risks have eased recently, potential risk factors still exist.
The "proxy war" in the Middle East (such as the attack on Red Sea merchant ships by the Houthi armed forces in Yemen) is still ongoing, and the security risks of global energy transportation channels (such as the Suez Canal) have not been completely eliminated.
In addition, geopolitical variables such as the 2025 US election (November) and the expected winter offensive of the Russia-Ukraine conflict may still push up safe-haven demand in the future. The "safe-haven attribute" of gold as an important safety cushion for its price has not completely disappeared.
From historical experience, the impact of geopolitical events on gold often presents the characteristics of "buy expectations, sell facts".
When a geopolitical crisis first appears or escalates, the price of gold usually rises rapidly; once the situation eases or the solution becomes clear, the price of gold will fall back.
The market performance in June 2025 once again verified this rule.
However, our team believes that the current easing of the geopolitical situation may only be temporary, and the structural contradictions in the Middle East and Eastern Europe have not been fundamentally resolved. New conflicts may still break out in the future, which will provide potential support for gold prices.
In terms of the interactive relationship between geopolitics and gold prices, the market needs to pay attention to several key nodes: First, whether the situation in the Middle East will be repeated, especially the direction of relations between Iran and the United States and Israel;
Second, whether the ceasefire agreement between Russia and Ukraine can continue, and whether large-scale military operations will be restarted in winter;
Third, the uncertainty of geopolitical policies in the US election year, especially the policy statements on key regions such as the Middle East and Asia-Pacific.
These factors may rekindle the market's risk aversion in the future and drive the gold price to rebound.
Analysis of the Federal Reserve's monetary policy and the trend of the US dollar:
The Federal Reserve's monetary policy trends and the trend of the US dollar have always been the core factors affecting the price of gold. The changes in the market's expectations of the Federal Reserve's policies in June 2025 directly led to the sharp fluctuations in the price of gold. As an interest-free asset, the price of gold is negatively correlated with the actual interest rate level, and the Federal Reserve's interest rate policy has a profound impact on the trend of the US dollar index and global capital flows, which makes the Federal Reserve's every move affect the nerves of the gold market.
In June, the Federal Reserve's policy stance showed a clear hawkish turn, which put heavy pressure on the gold market.
The US core PCE price index released on June 27 rose 2.8% year-on-year, higher than market expectations. This data strengthened the reason for the Federal Reserve to maintain high interest rates.
Several Federal Reserve officials subsequently publicly stated that "another 50 basis points of interest rate hikes may be made this year", causing the US dollar index to soar to 107.5, a recent high.
According to the CME "Fed Watch" tool, as of June 27, traders bet on a 79.3% probability of keeping interest rates unchanged in July, and only 20.7% expected a single rate cut of 25 basis points; in the forecast for September, the probability of cumulative rate cuts of 25 or 50 basis points reached 74.9% and 19.1%, respectively.
This change in interest rate expectations directly pushed up the US dollar and suppressed the price of gold denominated in US dollars.
There are obvious differences within the Federal Open Market Committee (FOMC) on the timing of rate cuts, and this policy uncertainty has exacerbated the volatility of the gold market.
Some officials emphasized the resilience of the job market and the potential upside risks of inflation, and believed that it was necessary to wait for more economic data observations after the implementation of tariff policies;
Other views tended to take preventive easing measures in the fall.
In his speech after the June interest rate meeting, Fed Chairman Powell emphasized that "there is no rush to cut interest rates", further dampening the market's expectations for a shift in monetary policy in the short term.
This inconsistency in policy signals has caused gold investors to wait and see, and some funds have chosen to temporarily withdraw from the gold market.
The strong rebound of the US dollar index is a direct factor suppressing gold prices.
As the market's expectations for the Fed to maintain high interest rates heat up, the US dollar index has rebounded significantly from its annual low and has broken through the 107 mark as of June 28.
The strengthening of the US dollar makes gold denominated in US dollars more expensive for holders of other currencies, suppressing international demand.
Technical analysis shows that the cyclical (monthly) turning point of the US dollar index is coming. Due to its recent obvious downward trend, the impact of this turning point is obviously biased towards the US dollar, which may further suppress gold prices.
It is worth noting that there is a dual mechanism for the impact of the Fed's policy on gold.
In the short term, the hawkish stance pushes up the US dollar and real interest rates, directly suppressing gold prices; but in the medium and long term, maintaining high interest rates may increase the risk of economic recession, which may enhance the safe-haven appeal of gold in the future.
The current market is in a stage of game between these two forces, which is also an important reason for the intensified volatility of gold prices.
The Fed's balance between suppressing inflation and avoiding a hard landing of the economy will determine the future direction of gold.
In the coming period, the market needs to pay close attention to several key data points to judge the direction of the Fed's policy:
First, the change in inflation data around the deadline for tariff suspension on July 9;
Second, employment and GDP data before the Fed's interest rate meeting in September;
Third, the impact of global supply chain conditions on core inflation.
These factors will jointly determine the Fed's policy path, and thus affect the medium-term trend of gold prices.
If the US economic data shows obvious signs of slowing down, it may restart the market's expectations for interest rate cuts, which will provide upward momentum for gold;
On the contrary, if the economy remains resilient and inflation remains high, gold may continue to be under pressure.
Analysis of the global economic situation and gold demand:
Changes in the global macroeconomic environment have a profound impact on the gold market. The complex situation of the global economy in June 2025 has created a structural differentiation in gold demand.
On the one hand, trade policy uncertainty and concerns about slowing growth support the safe-haven demand for gold;
On the other hand, the inhibitory effect of high gold prices on physical consumption and the adjustment of the pace of gold purchases by some central banks put pressure on gold prices. This interweaving of long and short factors puts the gold market in a delicate balance.
The uncertainty of tariff policy has become an important variable affecting the gold market.
The US government has made it clear that it will not extend the suspension period of import tariffs, which will expire on July 9. This decision will directly affect the global supply chain costs and inflation levels.
Although the specific adjustment plan has not yet been announced, the market is generally worried that if the new tariff measures are implemented, it may push up the price pressure on the production side, thereby indirectly supporting the demand for gold as a safe-haven asset.
At present, the United States has not reached an agreement framework with its major trading partners (including the European Union), and policy uncertainty may continue to provide support for gold prices.
Gold’s Future: Contrary to Expectations?With rising geopolitical tensions in the Middle East, many analysts and global financial institutions have begun betting on a potential increase in gold prices. Some major banks have even raised their forecasts for gold to as high as $4,000 per ounce, raising a critical question: Will gold prices truly rise as expected, or are the markets heading toward a different outcome, one that sees gold’s future moving contrary to expectations?
Recent history has taught us much about gold’s behavior during times of crisis. Investors often turn to gold during heightened turmoil be it political, economic, or even health-related, because it is considered one of the most prominent safe havens and a key hedge against inflation.
Regarding the latest political tensions, gold has shown short-term positive reactions, often spiking in response to unfolding events. However, once markets absorb the impact, prices typically stabilize or partially retreat awaiting new developments or an escalation that could reignite momentum. This scenario played out in recent weeks during Middle East tensions, specifically on June 13, 2025, when gold rose by about 1.92% in a single day, only to drop 2.99% shortly after increasing all its gains.
When comparing the current situation to past events, a familiar pattern emerges. For instance, during the outbreak of the Russia-Ukraine conflict in 2022, gold prices initially surged but then started to disregard the ongoing war. A similar reaction occurred with trade tariff decisions imposed by the U.S. president where gold responded briefly to each new headline, only to retreat thereafter.
In summary, gold responded to the latest Middle East developments with a slight uptick but soon absorbed the tension and returned to a more stable state awaiting a potentially more severe escalation.
Technical Outlook for Gold Prices:
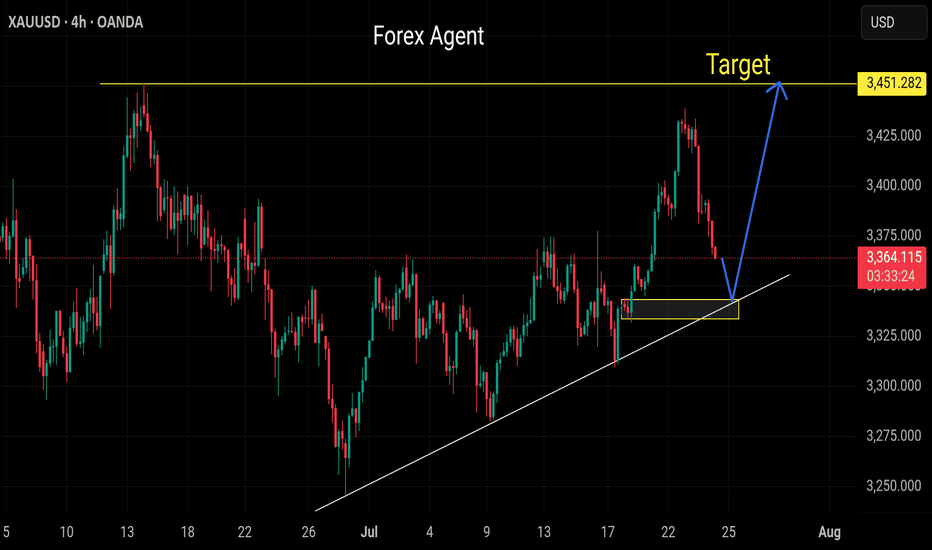
Gold is currently trading in a downward trend on the daily chart, forming lower lows consistently. The current zone near 3366.804 is technically significant, acting as a strong resistance level that could push gold to continue its descent toward the 3225 mark.
This bearish scenario would only be invalidated if the price breaks above 3451.130 and closes a daily candle above that level, signaling a possible reversal in the current trend.
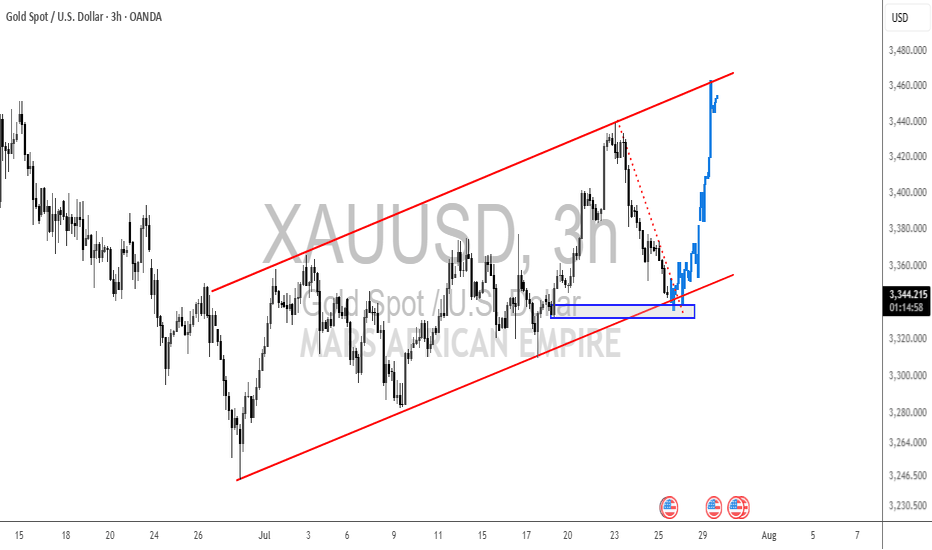
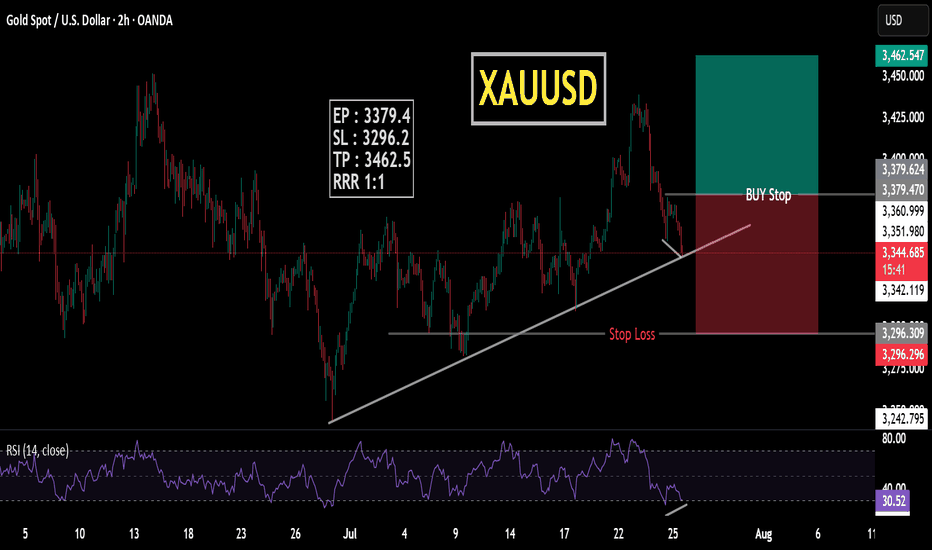
Gold Buy- Go for buy if setup given
- just a small trade
- Refine entry with smaller SL for better RR, if your strategy allow
A Message To Traders:
I’ll be sharing high-quality trade setups for a period time. No bullshit, no fluff, no complicated nonsense — just real, actionable forecast the algorithm is executing. If you’re struggling with trading and desperate for better results, follow my posts closely.
Check out my previously posted setups and forecasts — you’ll be amazed by the high accuracy of the results.
"I Found the Code. I Trust the Algo. Believe Me, That’s It."