Losing over and over again? Losing over and over again? The problem isn’t your strategy – it’s your mind.
Let’s be honest:
Are you repeating the same old mistakes… even though you know they’re wrong?
You know you shouldn’t enter a trade without confirmation – but you still do.
You know you should stick to your stop-loss – but you move it.
You know your mindset is unstable today – but you still open the chart and… click.
So stop blaming the market.
You’re not losing because the market is cruel.
You’re losing because you can’t control yourself.
💣 The most dangerous psychological trap: Knowing it's wrong – but doing it anyway
It’s not because you lack knowledge.
It’s not because your system doesn’t work.
It’s because your emotions are running the show.
Ask yourself:
Have you ever traded just to escape boredom, helplessness, or emotional emptiness?
Have you ever used the chart to hide from real-life pressure?
Have you ever placed a trade just to relieve stress?
If your answer is yes... then the problem isn’t technical.
It’s psychological – and deeper still, it’s emotional.
👹 The 3 emotional demons controlling your trading – and you don’t even realise it
1. FOMO – You fear being left behind more than you desire to win
You see price running → you see others making money → you feel the pressure.
You think: “I can’t miss this move!”
→ You jump in impulsively, without analysis.
FOMO reflects a lack of trust in yourself.
You don’t believe more opportunities will come.
You’re not trading with clarity – you’re reacting from fear.
2. Revenge Trading – You can’t accept the feeling of being “wrong”
Every loss feels like humiliation.
You can’t handle being “mistaken.”
So you fight the market back – like someone who’s lost all reason.
But the market doesn’t care if you’re hurt.
You’re projecting your frustration onto a system that has no emotion.
→ In that moment, you’re no longer a trader – you’re a gambler trying to ease emotional pain.
3. Overtrading – You measure your worth by how many trades you win
You only feel valuable when you’re making money.
You hate “doing nothing” – it makes you feel useless.
So you keep trading – endlessly, irrationally.
Overtrading reflects a deep fear of stillness and lack of control.
You seek validation… from your trading account.
🔍 Painful truth: You’re not losing because of the market – you’re losing because of unrealistic expectations
You expect to always be right.
You expect to get rich quickly.
You expect to prove something – to others and to yourself.
You pressure yourself to perform – and when results don’t come, your psychology collapses.
You’re not trading to beat the market.
You’re trading to fix something inside yourself.
✅ The solution? It’s not more knowledge – it’s emotional honesty
Stop trading the moment you feel out of control – whether you're winning or losing.
Keep an emotional journal daily – even on days you don’t trade. Be raw. Be real. No excuses.
Ask the right questions:
Am I trading to make money – or to soothe an emotional void?
Am I entering because of a setup – or because I’m afraid of missing out?
Do inner work outside of trading: meditate, exercise, heal emotionally, take breaks, talk to someone who gets it.
💬 Final thought:
Losing isn’t scary – what’s scary is never facing the real reason behind your losses.
Stop searching for the next shiny indicator.
Stop chasing strategies with a “90% win rate.”
You just need a decent system – and a strong mind to execute it.
True success comes when you no longer use trading to prove yourself –
but treat it like a calm, patient profession.
#TradingPsychology #EmotionalDiscipline #FOMOTrading #RevengeTrading #Overtrading
#MindsetMatters #TraderGrowth #SelfAwareness #TradingUK #ForexEducation #InnerGameOfTrading #ConsistencyIsKey #MentalEdge
CFDGOLD trade ideas

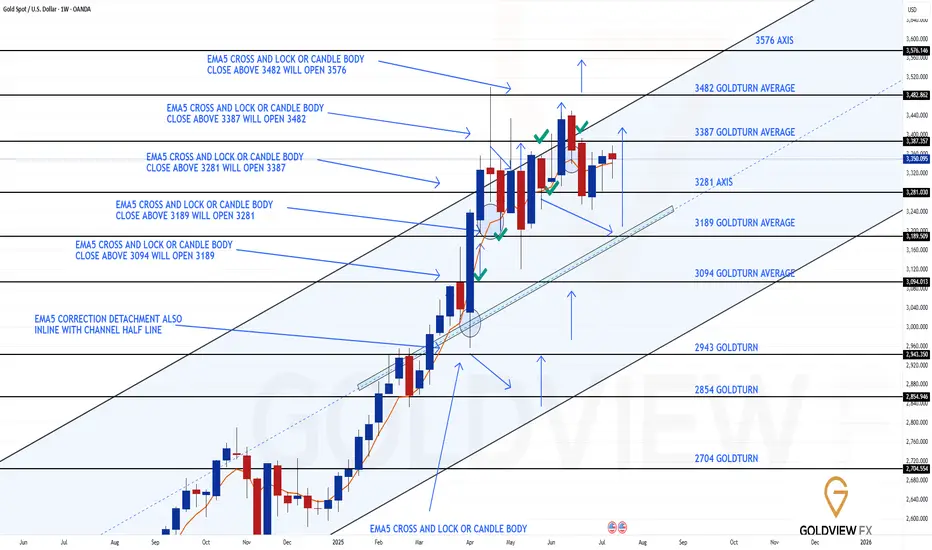
GOLD WEEKLY CHART MID/LONG TERM ROUTE MAPHey Everyone,
Please see update on our Weekly Chart idea.
As of now, nothing has changed structurally, the framework remains fully intact, and price continues to trade cleanly within the defined range.
After delivering a rejection at the channel top, price pulled back into 3281 support, where buyers once again stepped in decisively. That level held firm on a weekly closing basis, validating it as a reliable pivot and launching price back into bounce mode.
Despite the progress, we’ve yet to test the 3387 gap, which continues to act as a short term magnet. The longer range gap at 3482 also remains open and in focus as the larger objective.
Key takeaways from the current structure:
🔹 Structure unchanged:
The rising channel remains orderly. EMA5 still hasn’t locked bearishly, and the mid-line continues to climb beneath price, maintaining a constructive bias.
🔹 Support confirmed – 3281:
Held for a second time, reaffirming its significance in the broader structure.
🔹 3387 gap still in play:
While price is gravitating toward this zone, it has not yet been tested. Expect a reaction on first contact.
Updated Levels to Watch:
📉 Immediate Support – 3281
Held again, reinforcing its status as the key structural axis.
📈 Resistance 1 – 3387
Still untested. Remains the active near term target.
📈 Resistance 2 – 3482
Unfilled weekly gap and broader objective.
Plan:
As long as 3281 continues to hold, the bias remains for a measured grind higher toward 3387 and, eventually, 3482. If 3281 fails, we’ll reassess at the rising mid line for the next structured long opportunity.
As always, we will keep you all updated with regular updates throughout the week and how we manage the active ideas and setups. Thank you all for your likes, comments and follows, we really appreciate it!
Mr Gold
GoldViewFX
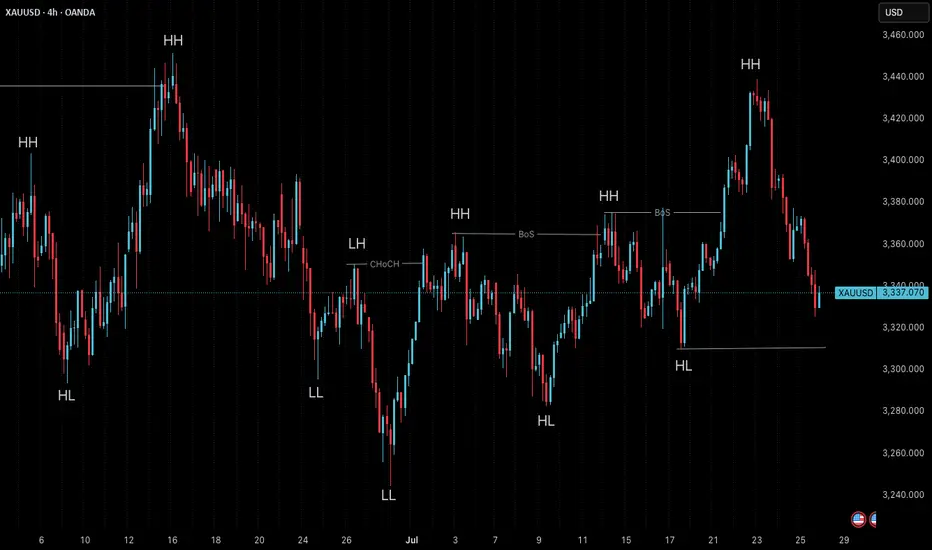
Market Structure is Not Strategy — It’s Your Starting Point“The chart doesn’t hide anything. But your mind does.”
Before any indicator, setup, or signal… comes structure.
🔍 What is Market Structure?
At its core, market structure is the sequence of higher highs (HH) and higher lows (HL) in an uptrend, or lower lows (LL) and lower highs (LH) in a downtrend.
It is the skeleton of price .
Everything else — entries, zones, signals — is just clothing.
If you can’t see the skeleton, you’re reacting to noise.
🎯 Why It Matters:
It’s not a signal. It’s context .
It tells you whether you’re trading with the market or against it .
It defines where your patience begins — not where your entry is.
Market structure helps you let go of the urge to chase. It brings order to the chaos.
🧩 Key Components to Track:
Break of Structure (BoS): Confirms trend continuation
Change of Character (ChoCH): Signals a potential reversal
Swing Points: Define the intent behind price moves
Liquidity Sweeps: Often mask real structure beneath short-term traps
🛑 Common Mistake:
Most traders jump straight to the setup without asking the most important question:
“Where am I in the structure?”
They try to buy a pullback — in a downtrend.
They try to fade a move — right before continuation.
They chase candles — instead of waiting for alignment.
That’s not strategy. That’s stress.
🛠 Tip to Practice:
Use this simple framework to build clarity:
Start from the H4 chart — this gives you the broader directional bias
Drop to M15 — here’s where structure begins to form tradeable setups
Finally zoom into M1 — this is where confirmation happens before entry
Ask yourself:
Where did the last BoS or ChoCH happen on each timeframe?
Is M15 aligning with H4 intent — or contradicting it?
Did you enter after M1 confirmation , or based on impulse?
You don’t need to predict price. You need to align with it.
🪞 Final Thought:
Structure isn’t strategy.
It’s the mirror that shows what’s real before your bias speaks.
When you master structure, you stop forcing trades — and start flowing with them.
💬 Want more like this?
If this post resonated with you — drop a comment below.
Let me know what you'd like to dive deeper into — price action, gold setups, market structure, or the psychology behind your trades.
I’ll build future tutorials based on what matters to you.
📘 Shared by @ChartIsMirror
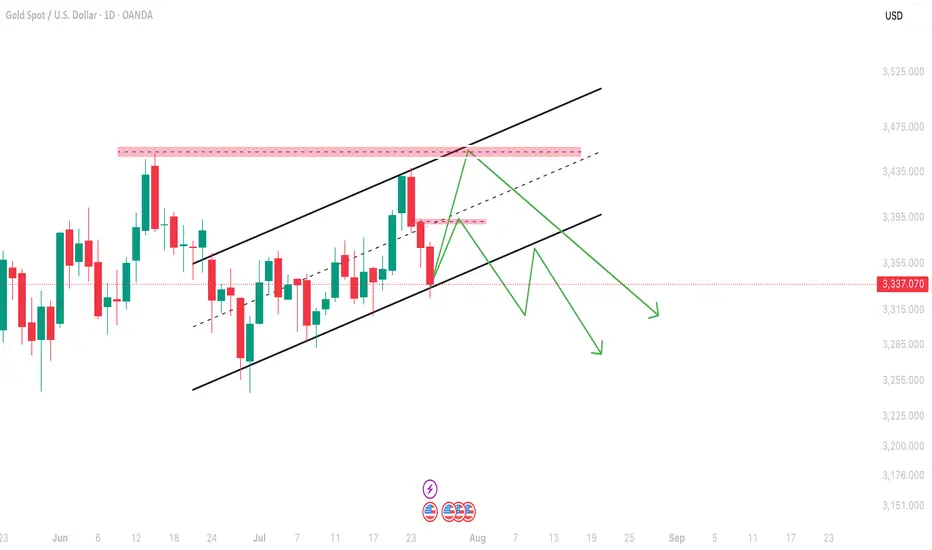
Daily Time frame Structure setAs you can see gold is moving in a channel in daily time frame so according to me next move will be till protected order block i.e 3382-3388 and after that big fall expected and if any candle close above 3384 then 3451 is the next target for gold.
Bullish Momentum Fading? Key Correction Levels Ahead XAUUSD – Bullish Momentum Fading? Key Correction Levels Ahead (23 July)
📰 Market Overview
Gold surged strongly overnight, driven by:
A speech from Fed Chair Jerome Powell, with no hints of resignation or major policy shift.
Rising geopolitical tensions between the US, China, and the EU — with the 1st of August marked as a key deadline.
A notable drop in US bond yields and the US Dollar, triggering increased demand for safe-haven assets like gold.
While today’s economic calendar is quiet, the market remains sensitive to sudden volatility.
📉 Technical Analysis
On the H4 chart, the recent bullish wave shows signs of exhaustion. Reversal candles are now forming on the H1 and M30 timeframes — suggesting a potential correction in the short term.
The 3412 – 3410 support zone will be critical. If price breaks below and invalidates the ascending trendline, we may see a deeper pullback toward lower liquidity zones (FVGs).
Below that, the 335x region offers strong confluence (Fibonacci 0.618 + previous demand zone), making it a prime area for potential long entries if price action confirms a bounce.
📌 Trade Setups to Watch
🔻 SELL ZONE: 3469 – 3471
Stop Loss: 3475
Take Profit Targets: 3465, 3460, 3455, 3450, 3445, 3440, 3430, 3420
→ Wait for a breakout and retest before shorting.
🔸 BUY SCALP: 3385 – 3383
Stop Loss: 3379
TP Targets: 3390, 3394, 3398, 3402, 3406, 3410
→ Ideal for intraday pullback entries with clear structure.
🔹 STRONG BUY ZONE: 3356 – 3354
Stop Loss: 3350
TP Targets: 3360, 3364, 3368, 3372, 3376, 3380, 3390, 3400
→ Great long-term entry zone with technical alignment (liquidity + fib levels).
⚠️ Risk Management Reminder
Even in low-news sessions, markets may spike unexpectedly due to political statements or liquidity sweeps.
Always respect your TP/SL levels — smart trading is protected trading.
💬 Patience breeds precision. Wait for the zone, trust the plan, and manage the trade.

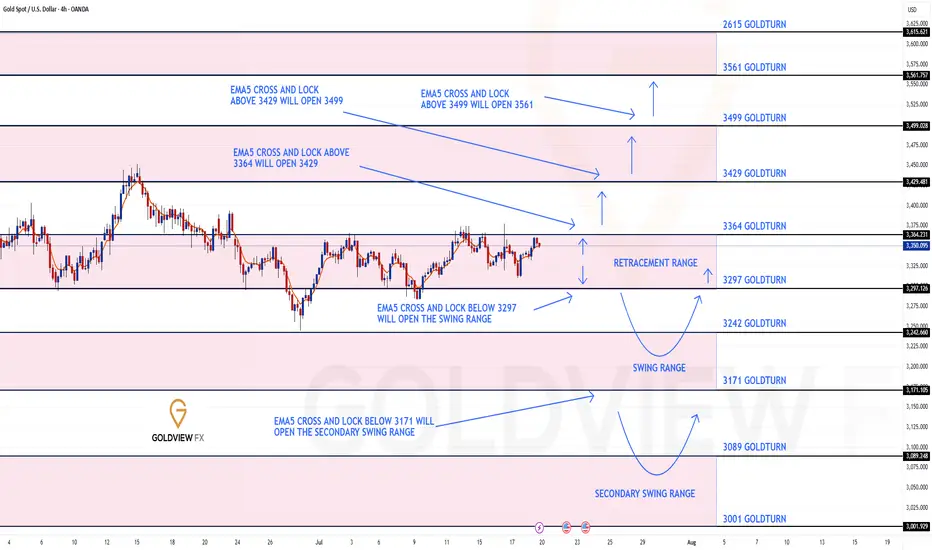
GOLD 4H CHART ROUTE MAP UPDATE & TRADING PLAN FOR THE WEEKHey Everyone,
Please see our updated 4h chart levels and targets for the coming week.
We are seeing price play between two weighted levels with a gap above at 3364 and a gap below at 3297. We will need to see ema5 cross and lock on either weighted level to determine the next range.
We will see levels tested side by side until one of the weighted levels break and lock to confirm direction for the next range.
We will keep the above in mind when taking buys from dips. Our updated levels and weighted levels will allow us to track the movement down and then catch bounces up.
We will continue to buy dips using our support levels taking 20 to 40 pips. As stated before each of our level structures give 20 to 40 pip bounces, which is enough for a nice entry and exit. If you back test the levels we shared every week for the past 24 months, you can see how effectively they were used to trade with or against short/mid term swings and trends.
The swing range give bigger bounces then our weighted levels that's the difference between weighted levels and swing ranges.
BULLISH TARGET
3364
EMA5 CROSS AND LOCK ABOVE 3364 WILL OPEN THE FOLLOWING BULLISH TARGETS
3429
EMA5 CROSS AND LOCK ABOVE 3429 WILL OPEN THE FOLLOWING BULLISH TARGET
3499
EMA5 CROSS AND LOCK ABOVE 3499 WILL OPEN THE FOLLOWING BULLISH TARGET
3561
BEARISH TARGETS
3297
EMA5 CROSS AND LOCK BELOW 3297 WILL OPEN THE SWING RANGE
3242
3171
EMA5 CROSS AND LOCK BELOW 3171 WILL OPEN THE SECONDARY SWING RANGE
3089
3001
As always, we will keep you all updated with regular updates throughout the week and how we manage the active ideas and setups. Thank you all for your likes, comments and follows, we really appreciate it!
Mr Gold
GoldViewFX
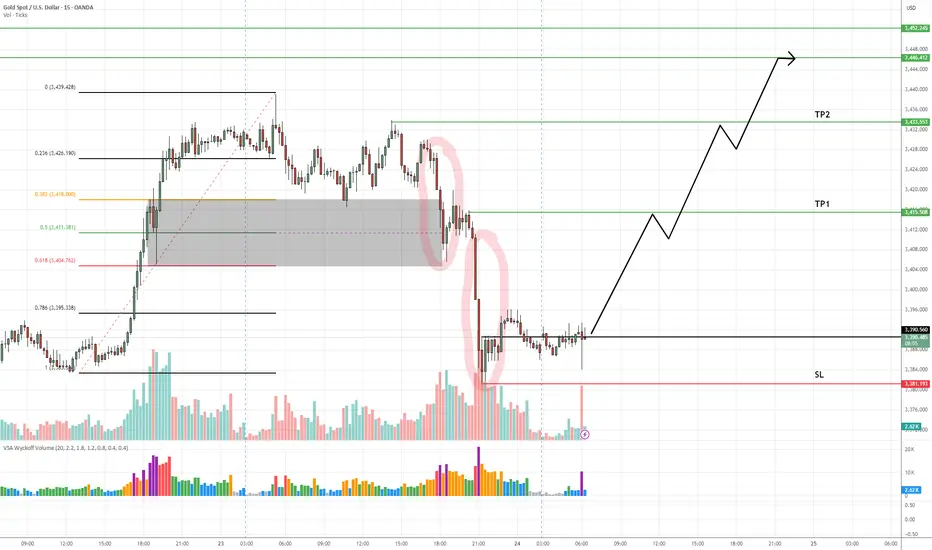
XAUUSD Buy Setup – VSA + Smart Money Reaction at Demand Zone✅ Entry: Current price action (around 3,392)
🎯 Take Profit 1 (TP1): 3,415
🎯 Take Profit 2 (TP2): 3,446–3,452
🛑 Stop Loss (SL): 3,381 (below the confirmed demand zone)
📊 Technical Insight (VSA-Based Analysis):
The sharp markdown into the demand zone occurred with expanding volume and wide spreads, a classic sign of stopping volume—potential smart money absorption of panic selling.
The second wide-range down candle was followed by lower volume and tighter spread bars, indicating supply exhaustion.
The market is forming a cause (accumulation) at the bottom of this drop, confirmed by:
No follow-through selling despite high volume
Narrow spread candles showing hesitation from sellers
Increasing volume on small up-bars, suggesting hidden buying
The zone aligns with previous structure and lies just above the 0.786 Fib retracement, adding further confluence to the bullish case.
Buy at the ICT Flip StageThe price is approaching a high probability zone for purchases, follow up, the price must break all the highs

XAUUSD 4H Technical Outlook The current market structure on the 4H timeframe shows a clear sweep of a liquidity pool near the recent highs (~3,348), followed by a strong bearish reaction. Price action suggests a short-term shift in momentum toward downside targets.
🔻 Bearish Scenario
After liquidity was grabbed above the recent highs (highlighted in the orange circle), price rejected sharply. The next critical level lies at the Bullish OB (LTF) around the 3,325–3,337 zone. A break below this could lead to a deeper retracement into the Fair Value Gap (FVG) and demand zone at 3,150–3,244.
📍 Key Levels:
Resistance: 3,347 – 3,439
Support: 3,244 – 3,150 (watch for reaction in the FVG zone)
Intermediate target: 3,244.41 (Low)
🟢 Bullish Case
If price finds support at the OB and respects the ascending trendline, we could see a reversal back to re-test the upper resistance near 3,438.
📈 Bias: Bearish until price confirms support above 3,337 and reclaims liquidity zone.
🔔 Watch for:
Price reaction at OB (3,325–3,337)
Break and close below 3,244 could accelerate selling
Potential long setup from FVG with bullish confirmation

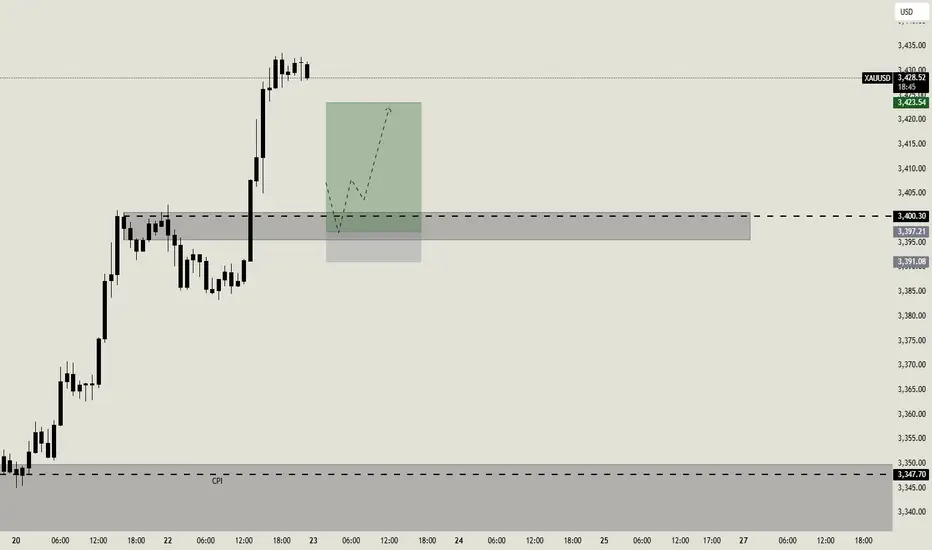
GOLD Buy limit targetGold is preparing a possible retracement till the $3400 area. My plan is wait the price there and enter long if this level will get a rejection. This is a high volume area where price could catch some volatility to bounce
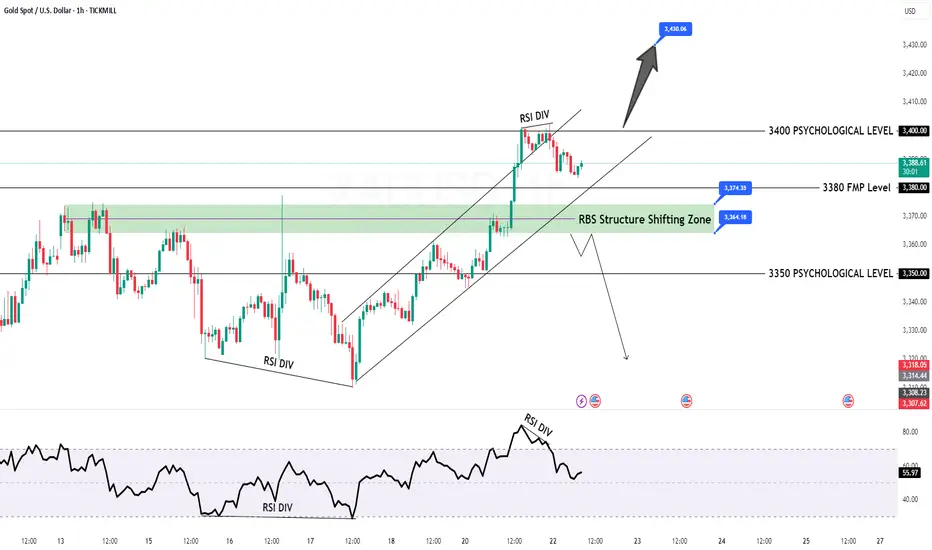
GOLD Intraday H1 Chart Update For 22 July 2025Hello Traders,
Today we have FED Chair Powell Speech ahead
all eyes on 3400 Psychological Level Break for now, if market successfully breaks 3400 then it will move towards 3435
below 3400 it will move back towards 3350 level
Disclaimer: Forex is Risky
Lingrid | GOLD Price Correction or Continuation ?The price perfectly fulfilled my last idea . OANDA:XAUUSD has completed an A-B-C bullish movement within the rising structure and is now testing a key resistance zone near 3,387. With momentum fading near the upper boundary, a potential correction toward the 3,367 area is likely before any further advance. A bounce from the SWAP zone may trigger renewed upside toward the 3,430 resistance. Price action remains bullish above the higher low and broken triangle pattern.
📉 Key Levels
Buy trigger: Rebound from 3,367
Buy zone: 3,355–3,370
Target: 3,430
Invalidation: Break below 3,342
💡 Risks
Deep correction below key structure
Failure to reclaim resistance after retest
Sudden shift in macroeconomic sentiment
If this idea resonates with you or you have your own opinion, traders, hit the comments. I’m excited to read your thoughts!

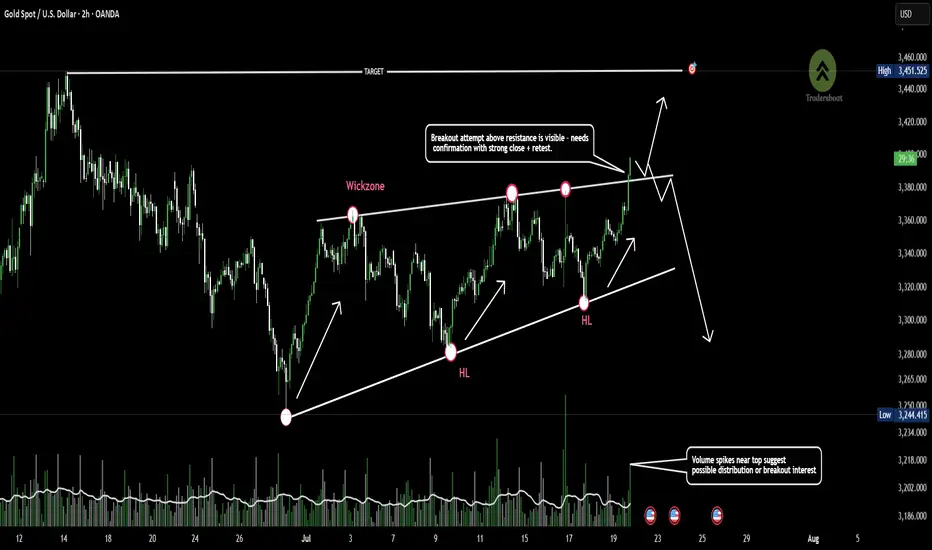
Gold approaches wedge resistance -Breakout or Fakeout incoming?Gold is trading within a rising wedge pattern, showing consistent higher lows and repeated rejections near the 3400 resistance zone.
Price is now approaching the upper trendline, an area of prior wick rejections and potential liquidity grab.
A confirmed breakout could signal continuation, while failure to sustain above this level may indicate bearish divergence or a reversal setup.👀📉
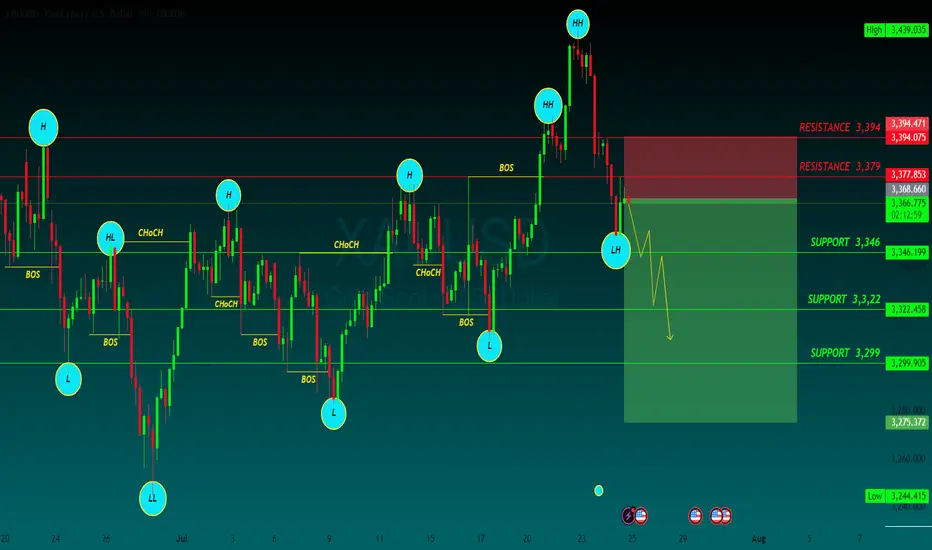
GOLD SELLGold price bears retain control amid fading safe-haven demand, rebounding USD
US President Donald Trump announced late Tuesday that his administration had reached a trade deal with Japan. Furthermore, reports that the US and the European Union are heading towards a 15% trade deal boost investors' confidence and weigh on the safe-haven Gold price for the second straight day on Thursday.
The markets do not expect an interest rate cut from the US Federal Reserve in July despite Trump's continuous push for lower borrowing costs. In fact, Trump has been attacking Fed Chair Jerome Powell personally over his stance on holding rates and repeatedly calling for the central bank chief's resignation.
Moreover, Fed Governor Chris Waller and Trump appointee Vice Chair for Supervision Michelle Bowman have advocated a rate reduction as soon as the next policy meeting on July 30. This keeps the US Dollar depressed near a two-and-a-half-week low and could offer some support to the non-yielding yellow metal.
Traders now look forward to the release of flash PMIs, which would provide a fresh insight into the global economic health and influence the safe-haven commodity. Apart from this, the crucial European Central Bank policy decision might infuse some volatility in the markets and drive the XAU/USD pair.
Meanwhile, the US economic docket features Weekly Initial Jobless Claims and New Home Sales data, which, in turn, would drive the USD and contribute to producing short-term trading opportunities around the commodity. Nevertheless, the fundamental backdrop warrants caution for aggressive traders.
SUPPORT 3,346
SUPPORT 3,322
SUPPORT 3,399
RESISTANCE 3,394
RESISTANCE 3,379
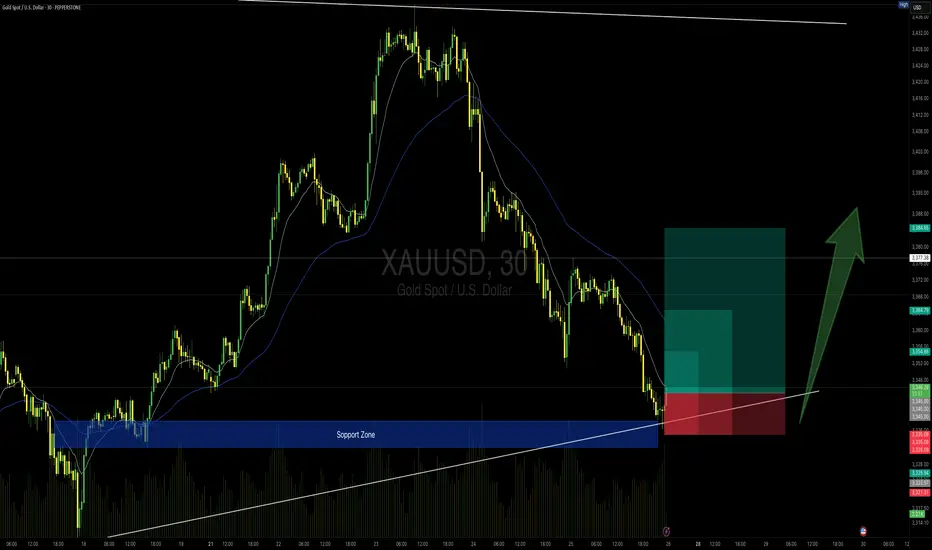
GOLD 30min Buy Setup (High Risk - High Reward)📍 TVC:GOLD 30min Buy Setup – MJTrading View
After an extended bearish leg, price has tapped into a strong support zone that previously acted as a launchpad. Also touching the main Uptrend...
We now see initial signs of absorption with potential reversal setup forming just above the ascending trendline.
🔹 Entry Zone: 3344–3346
🔹 SL: Below 3335 (under structure & wick base)
🔹 TP1: 3355
🔹 TP2: 3365
🔹 TP4: 3385+ (if momentum sustains)
🔸 RR: Up to 1:4 depending on target selected
🧠 Context:
– Still inside broader bullish structure (macro HL)
– Support zone coincides with rising trendline
– Potential for bullish reaccumulation after sharp drop
– Volume spike near zone suggests active buyers
Stay sharp and manage your risk please...
See the below Idea for full concept:
"Support isn't just a level — it’s a battlefield. If buyers win, they don’t look back."
#MJTrading #Gold #BuySetup #PriceAction #SmartMoney #ChartDesigner #ReversalSetup #MarketStructure
Psychology Always Matters:
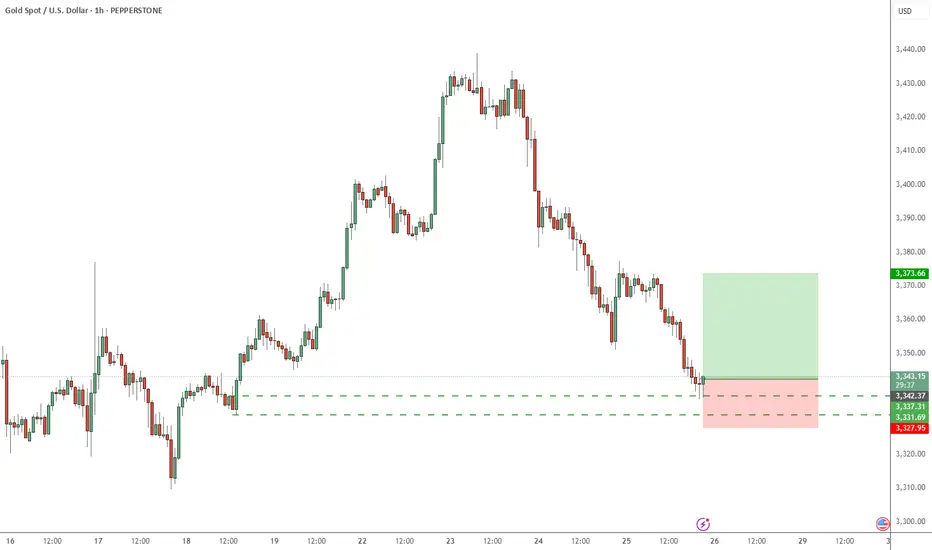
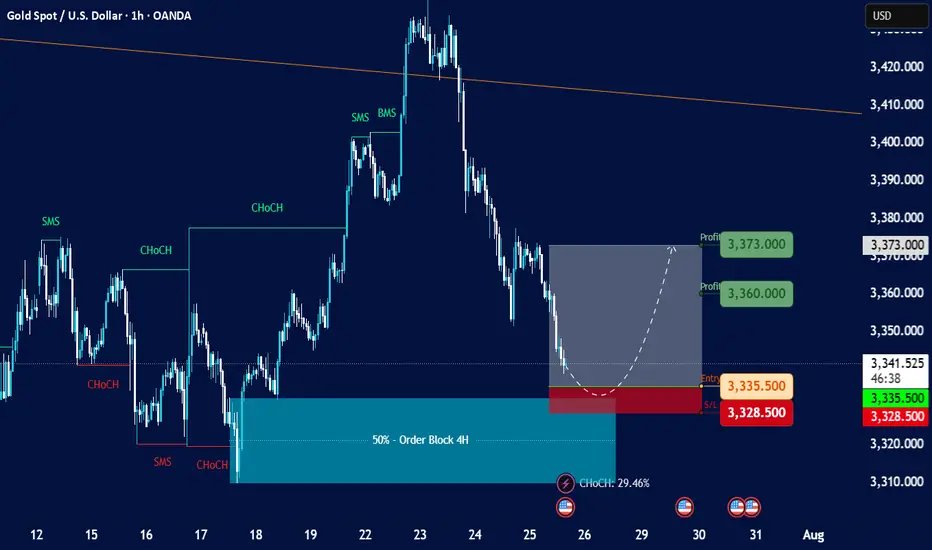
Gold Spot / U.S. Dollar (XAU/USD) with a 1-hour timeframeOverall Trend and Market Structure:
The chart displays a mix of bullish and bearish movements, but recent price action (from around July 23rd onwards) shows a significant downturn after a peak.
There are "SMS" (Structural Market Shift) and "ChoCH" (Change of Character) labels, indicating shifts in market structure. Initially, there were bullish shifts, but the recent price action suggests a potential bearish shift or at least a significant retracement.
A large "50% - Order Block 4H" is highlighted in blue, which acted as support and led to a strong upward move previously.
Current Price Action and Setup:
The current price is around 3,340.670.
There's a proposed short-term trading setup, indicated by:
Entry: 3,335.500 (red dashed line)
Stop Loss (SL): 3,328.500 (red shaded area)
Profit Targets (TP):
3,360.000 (green shaded area, "Profit 3,360.000")
3,373.000 (green shaded area, "Profit 3,373.000")
The setup is highlighted with a gray shaded area, indicating the potential path of price for this trade. It appears to be a long (buy) setup, anticipating a bounce from the current levels.
The "CHOCM: 29.46%" at the bottom suggests some kind of indicator or calculation related to market character.
Key Observations and Considerations:
Previous Bullish Momentum: The price rallied strongly after touching the "50% - Order Block 4H" around July 17-18, reaching a high near 3,430.
Recent Bearish Retracement: Since July 23rd, the price has pulled back significantly from its peak, almost revisiting the higher levels of the previous order block.
Potential Support: The proposed entry point for the long trade (3,335.500) is within a zone that previously acted as support or a level from which price bounced. It's also near the top of the "50% - Order Block 4H" area, suggesting this could be a retest or a bounce from a key support zone.
Risk-Reward: The setup shows a relatively tight stop loss compared to the potential profit targets, which is generally favorable for risk management.
GOLD (XAUUSD) Intraday Idea LongGold been keeping falling on both Asian and European sessions.
Most probably likely to pullback to London high after the New York session open.
Let's see if this plays out!
Good Luck!

XAUUSDThe price is currently moving within an ascending channel on the one-hour timeframe. I expect it to bounce off the trendline and the blue zone I’ve marked. If I see a proper candlestick pattern and a strong reaction, I’ll consider entering a buy position.

XAUUSD - Bullish Bias Holding StrongPair: XAUUSD (Gold)
Bias: Bullish
HTF Overview: Multi-timeframe structure aligned bullish. Market is in a clear uptrend across 4H and 1H, currently retracing toward key OB levels.
LTF Confirmation: Waiting on price to mitigate the 1H OB — once tapped, will drop to 15M and 5M for confirmation before any entries.
Entry Zone: 1H OB marked — setup strengthens if inducement or liquidity sweep occurs just before mitigation.
Targets: Short-term target is the previous high — extended target based on 4H continuation range.
Mindset Note: Alignment is there — now it’s about patience and waiting for execution clarity. Let price deliver the opportunity.
Bless Trading!

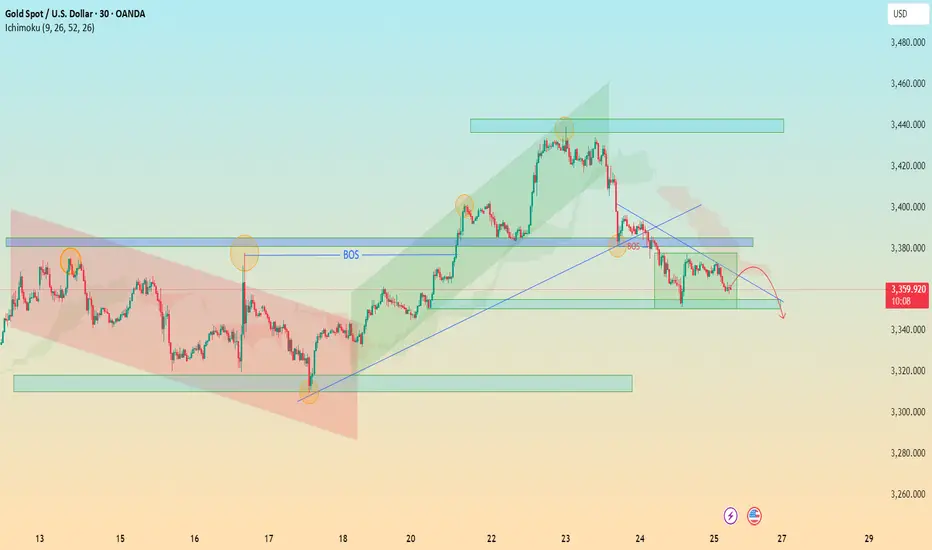
XAU/USD Bearish Retest in Motion – Watch 3340 for Breakout 🔍 XAU/USD (Gold) – Bearish Reversal Outlook
Timeframe: 30-Minute
Date: July 25, 2025
Indicators Used: Ichimoku Cloud, BOS (Break of Structure), Trendlines, Support & Resistance Zones
---
⚙ Technical Breakdown:
1. Previous Market Structure – Accumulation to Expansion:
Descending Channel (Red Box): Market moved within a bearish channel until the breakout occurred.
Key Break of Structure (BOS) around 3365 level signaled the beginning of bullish momentum — a textbook shift from accumulation to expansion phase.
Rally towards 3445 zone: Strong impulsive wave followed by higher highs and higher lows within a green rising channel.
2. Bull Trap and Structural Breakdown:
At the 3445-3460 resistance zone, price failed to maintain momentum and formed a double top / distribution setup.
The second BOS near 3385 confirmed a shift from bullish to bearish market structure.
Ichimoku Cloud also flipped bearish — price is now trading below the cloud, signaling potential continued downside.
3. Current Consolidation and Bearish Retest:
Price is now trapped in a bearish flag / rectangle pattern between 3360 – 3380.
Recent rejections from the descending trendline and overhead supply zone indicate weak bullish attempts and presence of strong selling pressure.
4. Anticipated Move – Bearish Continuation:
The projected red path suggests a retest of the diagonal resistance, followed by a breakdown toward key demand zone at 3340 – 3320.
If that zone fails, we may see a deeper move toward 3280.
---
📌 Key Technical Zones:
Zone Type Price Level (Approx.) Description
Resistance 3445 – 3460 Double Top / Strong Supply
Support 3340 – 3320 Historical Demand Zone
Short-term Resistance 3375 – 3385 BOS Retest + Trendline
---
🎯 Trading Insight:
📉 Bias: Bearish
⚠ Invalidation Level: Break above 3385 with volume
📊 Potential Target: 3340 → 3320
🧠 Trade Idea: Look for short entries on weak retests near descending trendline or cloud rejection.
---
🏆 What Makes This Chart Unique for Editors’ Picks:
✅ Multiple Confluences: Structural shifts (BOS), trendlines, Ichimoku, and classic patterns (channels, flags).
✅ Clear Visual Storytelling: Logical flow from bearish to bullish and back to bearish structure.
✅ Forward Projection: Predictive outlook based on strong technical context — not just reactive analysis.
✅ Educational Value: Useful for beginners and intermediate traders alike to understand structure transitions and key levels.