GOLD Will Move Higher! Buy!
Here is our detailed technical review for GOLD.
Time Frame: 12h
Current Trend: Bullish
Sentiment: Oversold (based on 7-period RSI)
Forecast: Bullish
The market is on a crucial zone of demand 3,347.64.
The oversold market condition in a combination with key structure gives us a relatively strong bullish signal with goal 3,425.86 level.
P.S
We determine oversold/overbought condition with RSI indicator.
When it drops below 30 - the market is considered to be oversold.
When it bounces above 70 - the market is considered to be overbought.
Disclosure: I am part of Trade Nation's Influencer program and receive a monthly fee for using their TradingView charts in my analysis.
Like and subscribe and comment my ideas if you enjoy them!
CFDGOLD trade ideas

#3,377.80 Resistance remains strongMy position: I have Bought Gold many times above #3,400.80 benchmark however as it got invalidated, I Bought #3,390.80 again late U.S. session and closed my set of Buying orders on #3,395.80 nearby extension. I left one runner (#3,390.80 entry point) with Stop on breakeven expecting Asian session to recover #3,400.80 benchmark, however it was closed on break-even as Gold extended Selling sequence. I will continue Selling every High's on Gold and if #3,357.80 gives away, expect #3,352.80 and #3,342.80 contact points to be met.
As expected Gold delivered excellent #3,372.80 and especially #3,365.80 - #3,352.80 Selling opportunities throughout yesterday's session which I utilized to it's maximum. I have also Bought Gold on late U.S. session with #3,372.80 as an entry point / however since Gold was ranging, I closed my order on break-even and met Gold below #3,352.80 benchmark this morning personally on my surprise (I did expected #3,377.80 to be invalidated to the upside).
Technical analysis: Gold’s Price-action is performing well below both the Hourly 4 chart’s and Daily chart’s Resistance zones for the cycle. Selling direction of today’s session is directly correlated with Fundamentals leaving the scene which found Sellers near the Intra-day #3,377.80 Resistance and most likely DX will close the Trading week in green, however struggling to make Bullish comeback and if #3,327.80 - #3,342.80 reverses the Selling motion, Gold’s Daily chart’s healthy Technicals which preserved core uptrend values. If the Price-action gets rejected at #3,352.80 - #3,357.80 Resistance zone, then further decline (under conditions where I will have more information with U.S.’s session candle) is possible and cannot be ruled out. Notice that at the same time and manner, Bond Yields are on consecutive Selling spree as well which Fundamentally has a diagonal correlation with Gold. The slightest uptrend continuation there, should add enormous Selling pressure on Gold.
My position: I am Highly satisfied with recent results and will take early weekend break (no need to Trade more). If however you decide to Trade today, Sell every High's on Gold / no Buying until Monday's session (my practical suggestion).

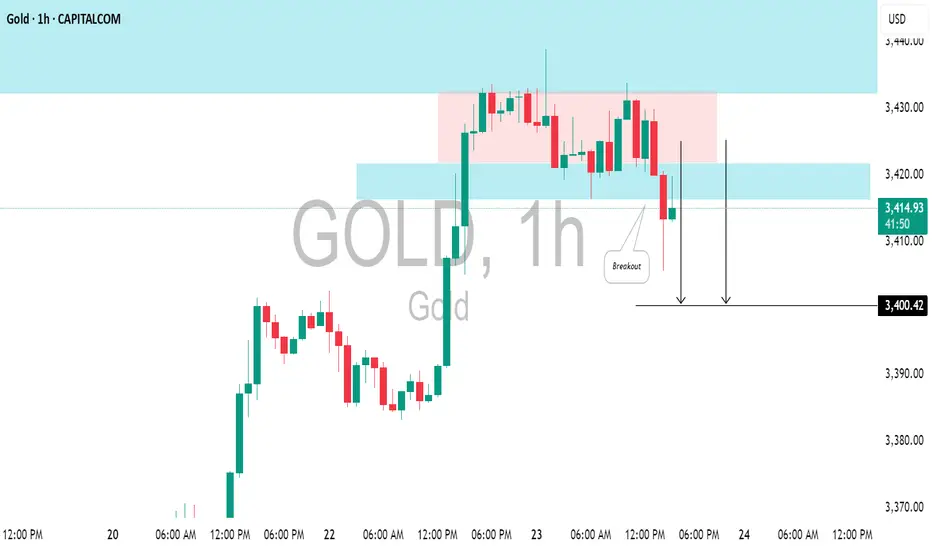
GOLD(#XAUUSD): Pullback From Resistance ConfirmedGOLD could retreat from the highlighted resistance level.
I observed a horizontal trading range pattern following a test of significant intraday resistance, along with a breach of its support level marked by a strong bearish candle.
Target - 3400.
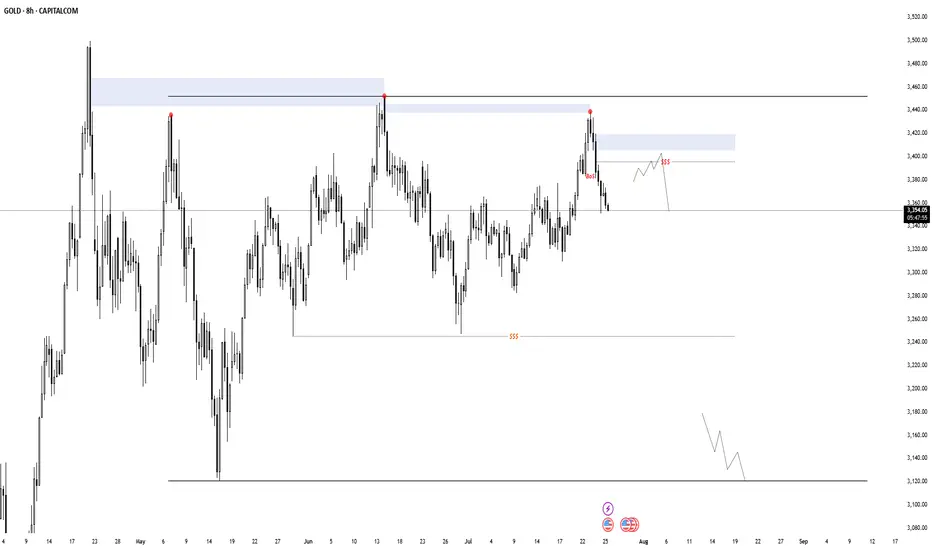
Gold DistributionI was to focused on crypto this week that i completely missed that. At the moment it's an confirmed internal model 2 distribution. If i'm lucky i get an entry in a redistribution form up there. Target is the range low, invalidation above the 3rd tap.

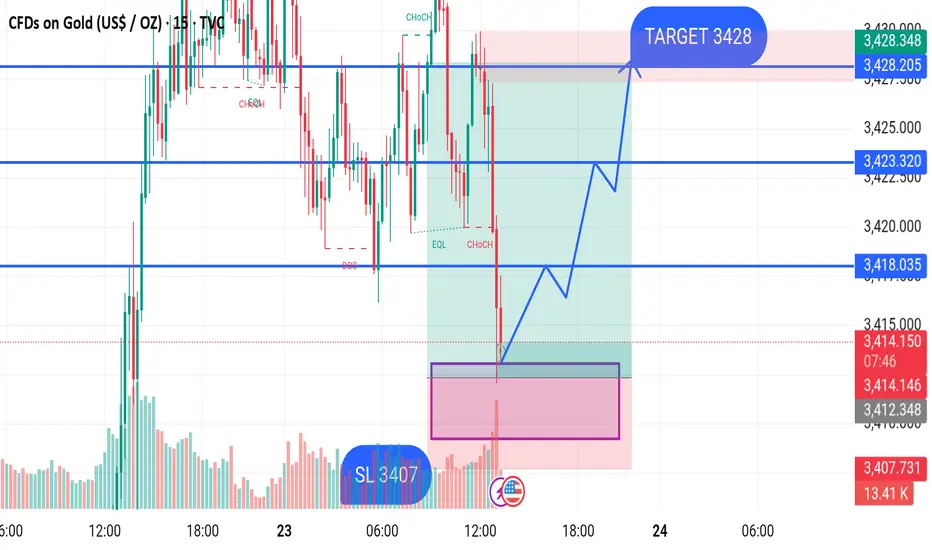
GOLD BUY M15 Gold (XAUUSD) Analysis – 15-Minute Timeframe
Price has recently shown a strong bearish move after a CHoCH (Change of Character) confirmation. The market has entered a demand zone (highlighted in pink), where a potential bullish reversal is expected.
Entry Zone: Around 3407–3408 level (within the demand area)
Stop Loss (SL): 3407 (just below the demand zone)
Target: 3428 (major resistance and supply zone)
The expected move shows price reacting from the demand zone, forming higher highs and higher lows, with bullish confirmation. If price holds above the 3407 level, buyers may take control and push price toward the 3428 target.
Key Levels:
Demand Zone: 3407 – 3408
Support Level: 3418.035
Resistance Levels: 3423.320 and Final Target 3428
Gold in Demand Zone | Target $3,380🚨 GOLD/USD – BIG MOVE LOADING! 🚨
🔍 Price is currently reacting from a major demand zone ($3,340–$3,345) with signs of accumulation and a possible double bottom pattern forming.
📉 After a strong downtrend, this looks like a liquidity sweep and smart money trap — prepping for a reversal back to the $3,380 resistance zone where liquidity resides.
📈 Scenarios to Watch:
1️⃣ Price sweeps support again and reverses hard
2️⃣ Clean structure break above $3,365, followed by a retest
🎯 Target: $3,380–$3,385
🛡️ Invalidation: Strong close below $3,335
⚠️ Confirmation Required! Best entry would be after structural break + retest. Keep your risk tight, and let the market show its hand.
⸻
📌 Key Levels:
• Support Zone: $3,340–$3,345
• Target Zone: $3,380–$3,385
• Invalidation: Below $3,335
⸻
📣 If this setup helps you, like 👍, comment 💬, and follow 🔔 for more high-probability ideas every week!
#Gold #XAUUSD #SmartMoney #LiquidityGrab #ForexSetup #PriceAction #BreakoutTrade #DoubleBottom #TradingView #GoldAnalysis #ForYou #FXStrategy #SupplyAndDemand

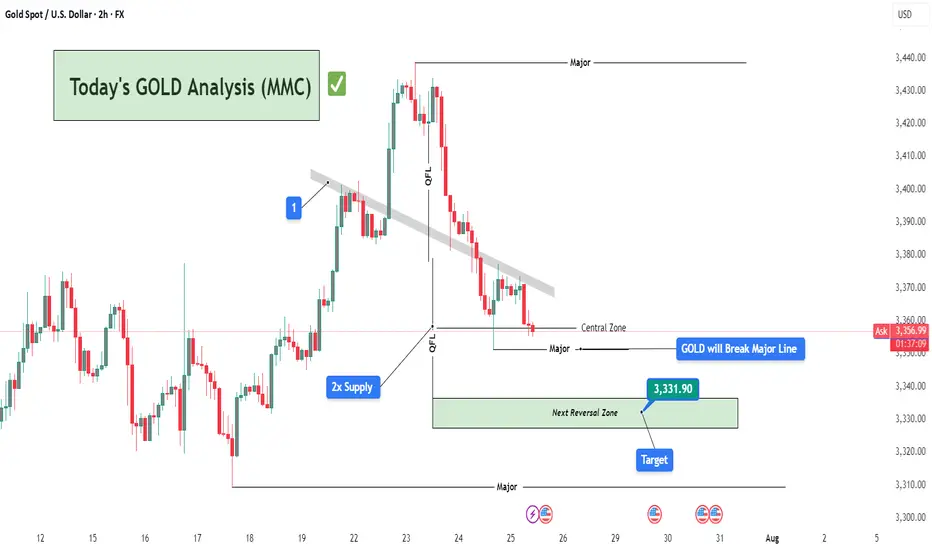
Today's GOLD Analysis (MMC) – Sell Bias Continues To Next TargetChart Overview:
This 2-hour GOLD (XAU/USD) chart showcases a clear bearish structure in line with the Mirror Market Concepts (MMC) methodology. Price action is respecting key supply zones and continues to reject significant levels, confirming the dominance of sellers in the short-term structure.
🔍 Key Technical Elements:
1️⃣ Break of Trendline (MMC QFL Entry Model)
The descending grey trendline marks consistent lower highs, showing clear bearish pressure. The breakout and rejections around this trendline zone (annotated “1”) confirm it as a strong supply area. This breakdown set the stage for a QFL (Quick Flip Liquidity) drop.
🧊 2x Supply Zone (High Confidence Rejection)
The 2x supply label highlights an area where price rapidly reversed with aggressive bearish momentum. This zone was tested and respected again, leading to further downside pressure, reinforcing the idea of institutional selling interest from that level.
📉 QFL Levels & Central Zone
Two major QFL drops are evident, where price broke previous demand structures and created new supply imbalance. The Central Zone currently acts as short-term support, but price is hovering just above it with weak bullish reaction, indicating potential for further breakdown.
🎯 Target & Reversal Zone – 3,331.90
The green zone below marks the Next Reversal Zone, with a highlighted price target at 3,331.90. This is where:
Previous liquidity was absorbed.
Demand imbalance may attract buyers again.
MMC reversal structures might be anticipated.
This zone aligns perfectly with the broader MMC concept of flipping between major zones and reversal blocks.
🧠 Trade Idea & Strategy (MMC Traders’ Minds)
Current Bias: Bearish
Entry Trigger: After rejection from trendline & 2x supply area.
Stop-Loss Suggestion: Above the trendline or recent supply wick (~3,375-3,380).
Take-Profit Zone: Primary TP at 3,331.90, with eyes on lower reversal targets if momentum persists.
Market Behavior: Controlled by sellers, liquidity sweeps seen, weak demand below Central Zone.
📌 Key Events to Watch
As marked at the bottom, major US news events are scheduled between July 30th and 31st, which could act as catalysts for price acceleration toward the reversal zone or cause sharp volatility. Plan accordingly.
🧭 Conclusion:
Gold is respecting bearish market structure under the MMC model. With clear QFL breakouts, rejection from 2x Supply, and weak bullish attempts near the Central Zone, this chart favors short setups targeting the 3,331.90 zone. MMC traders should monitor price action closely within the Reversal Zone for potential buy signals or trend continuation if sellers remain aggressive.
Gold is Targeting Fresh HighsHey Traders, in today's trading session we are monitoring Gold for a buying opportunity around 3,410 zone, Gold is trading in an uptrend and currently is in a correction phase in which it is approaching the trend at 3,410 support and resistance area.
Trade safe, Joe.

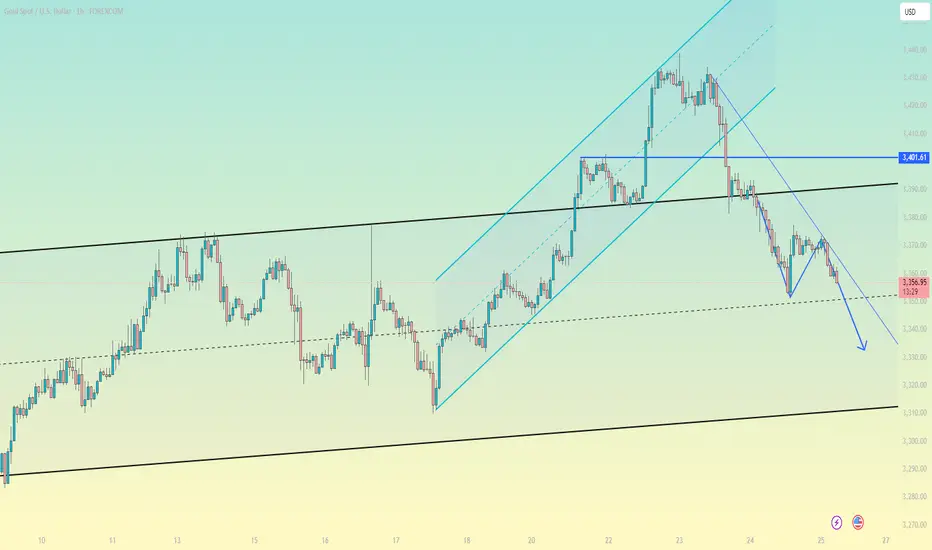
Gold is under pressure, shorts aim at 3310Gold is under pressure, shorts aim at 3310
Gold technical analysis and trading strategy: key support faces test, weak rebound, beware of breakout risk
Fundamental driving factors
The stabilization of the US dollar index suppresses gold prices: recent US economic data (such as retail sales, initial jobless claims) show resilience, the market's expectations for the Fed's rate cuts have been postponed, and US Treasury yields have rebounded, weakening the attractiveness of interest-free assets such as gold.
Risk aversion cools down: The situation in the Middle East has not escalated yet, and the rebound in US stocks has weakened the safe-haven demand for gold.
Fund flow: ETF holdings data show that institutional investors have continued to reduce their holdings of gold recently, reflecting that market sentiment is cautious.
Key technical signals
1. 4-hour cycle: oscillating bearish structure
Clear suppression: The overnight rebound high of 3375 (38.2% Fibonacci retracement level) constitutes a short-term strong and weak boundary, and the price has failed to stand firm here, indicating that bullish momentum is insufficient.
Support overlap: The 3340-35 area is the resonance area of the 4-hour trend line support and the Fibonacci downward target (3335-40). If it is lost, the downward space will be opened to 3320-3300.
Indicator divergence: The MACD histogram is shrinking and the fast and slow lines are close to the zero axis, and the RSI is hovering below 50, suggesting that the rebound momentum is exhausted.
2. 1-hour cycle: short-term technical structure is formed
Descending channel: Thursday's high of 3395 and the current high of 3377 form a secondary high point. Connecting the low point of the hourly chart can draw a descending channel, and the price runs along the lower track of the channel.
Key watershed: 3350 (61.8% retracement level) is a short-term long and short battle point. After breaking it, it will accelerate the test of 3340-35.
Today's trading strategy
Direction: Rebound high and empty mainly, and follow up after breaking the support.
Entry:
Aggressive short order: 3368-3373 light position short test, stop loss above 3380, target 3345-3340.
Steady short order: If the price rebounds to 3375-3380 under pressure, add short position, stop loss 3385, target unchanged.
Take profit and risk control:
Partial reduction of position near the first target 3340, the remaining position observes the support strength of 3340-35.
If it quickly breaks below 3340, short can be chased to 3325-3320 (previous low of daily line).
Alternative plan:
If the price unexpectedly breaks through 3380 and stabilizes, short position needs to be exited, wait and see the 3390-3400 pressure zone and then choose the opportunity to layout.
Key Tips
Don’t blindly buy the bottom: The current technical structure has not shown a bottom signal. Although the 3340-35 area is support, if it is accompanied by a large negative line break, it may trigger long stop-loss orders.
Data risk: Pay attention to the US PMI data in the evening. If it is stronger than expected, it may strengthen the dollar to suppress gold prices.
I was bluffed?Idk >:’(
TradingView isn’t carrying my vibe right now, it just told me how blunt I was with my message. So accept this as a random interaction with me :)

Weekly Outlook: Gold Builds Pressure – Is the Big Move Coming?📆 Big Picture View
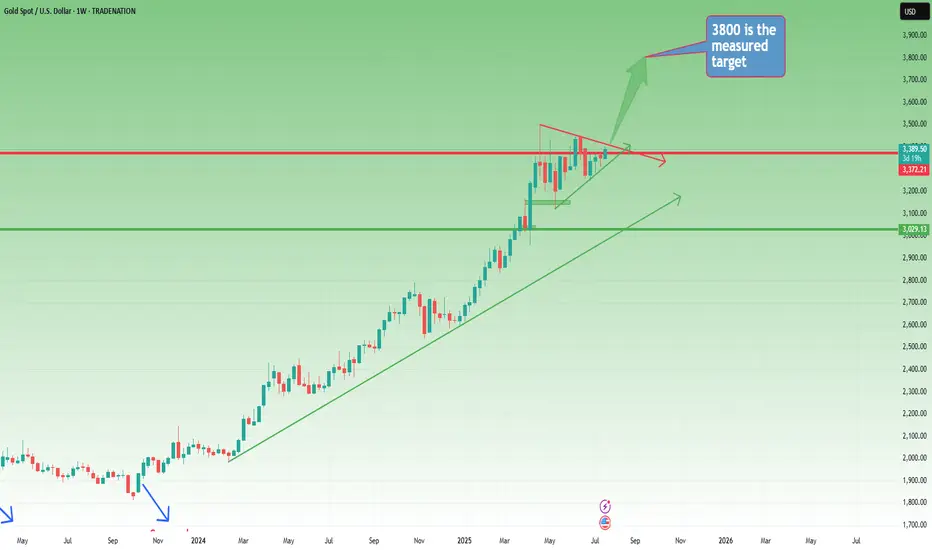
Since the start of 2024, Gold has been moving in a well-defined long-term bullish trend.
Yes, there were meaningful pullbacks along the way — but the direction was never in doubt. Step by step, Gold climbed over 15,000 pips in just over a year, reaching a new all-time high in late April.
📉 Post-ATH: A Period of Stabilization
After peaking, Gold shifted into consolidation mode, with price gravitating around the 3300 zone.
This sideways movement has been ongoing for the past three months, but it’s not a sign of weakness — it’s the market catching its breath.
On the weekly chart, this consolidation is now forming a symmetrical triangle, a classic continuation pattern that often appears mid-trend.
📐 The Technical Setup
- The symmetrical triangle shows compression of volatility
- Buyers and sellers are slowly converging toward a decision point
- A breakout is approaching, and when it comes, it could be explosive
🎯 What’s the Trigger?
- A confirmed break above 3450 would validate the triangle breakout
- That opens the door to quickly test the 3500 round figure
- The measured target for the triangle sits at 3800
Given the time Gold has spent consolidating (3+ months), this target could realistically be reached by year’s end
🧭 Strategic Takeaway
- As long as Gold holds above 3300, the bullish structure remains valid
- Breakout above 3450 is the green light for the next leg up
- Until then, the consolidation continues, and smart money prepares
📌 Conclusion:
Gold is building pressure. The weekly triangle is maturing.
This isn’t the end — it’s the pause before the next move.
Stay patient. Stay focused.
Because if 3450 breaks… 3800 is not a dream — it’s a destination. 🚀
Disclosure: I am part of TradeNation's Influencer program and receive a monthly fee for using their TradingView charts in my analyses and educational articles.
P.S: Here you have a short term analysis on Gold
NordKern - XAUUSD InsightNordKern | Simplified Insight OANDA:XAUUSD possible scenarios
Gold saw some upside today, primarily driven by softer TVC:DXY and trade deadlines ahead. To be specific:
1. Softer U.S. Dollar (DXY)
The U.S. Dollar Index fell ~0.1–0.2% today, making gold more attractive for international buyers
Kitco confirms the decline in USDX, paired with weaker Treasury yields, is fueling bullion demand.
2. Cautious Market Ahead of Trade Deadlines
Markets are bracing for the August 1 U.S. tariff deadline, especially involving the EU. Investors are positioning defensively, increasing safe-haven interest in gold.
Heightened trade tensions and uncertainty including possible Trump-Xi talks boost demand for safe assets.
3. Falling Treasury Yields & Fed Policy Expectations
The U.S. 10‑year Treasury yield has slipped (~4.37%), reducing gold’s opportunity cost and supporting its attractiveness.
Market pricing shows increasing odds of a Fed rate cut at next week’s FOMC meeting, something analysts like Christopher Waller suggested.
4. Geopolitical & Trade Risk Premiums
Escalating trade risk (tariffs looming) and geopolitical uncertainty are prompting safe-haven inflows into gold.
India’s MCX mirror those sentiments: gold rose ~0.5% on local contracts amid global trade nerviness.
To sum it up:
Gold is rallying today primarily because of the softer dollar, lower yields, and elevated trade risks ahead of the August 1 tariff deadline all of which reinforce its safe-haven allure.
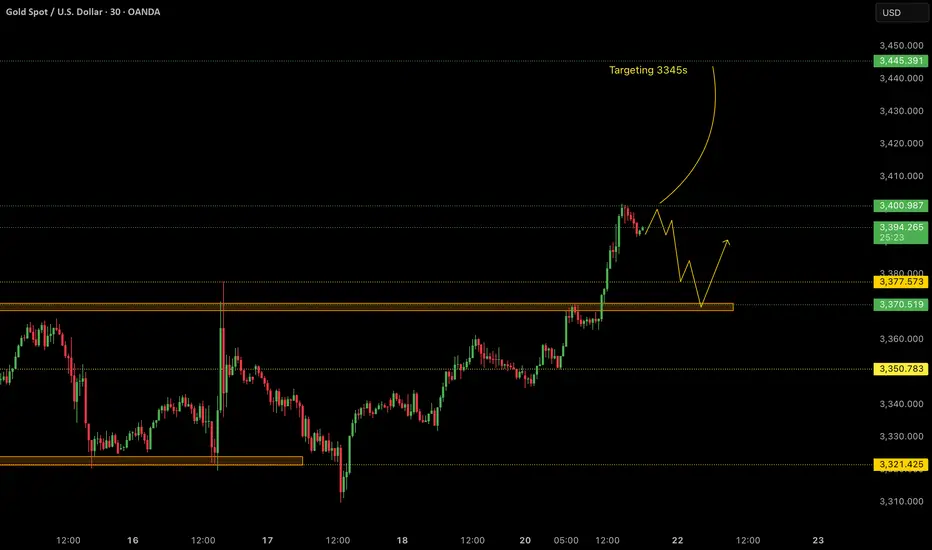
Trade Setup - Shorts; if we retest 3370s
- We would primarily look to enter into lower risk buys on gold at more preferable levels such as 3370. After breaking to the upside from the consolidation area, a pullback and a retest to that area would not be out of the ordinary.
Trade Setup - Buys; if we break above 3400
- In case of the dollar remaining soft, we can expect gold to continue its upside rally without any major pullbacks. In this case, we would be looking for the breaks of 3400 and continue to hold until around 3345s.
Key Notes:
- Softer Dollar
- Possible retest of 3370s
- Watch for potential breaks of 3400
This remains a tactically driven setup. Manage risk appropriately and stay alert for any renewed political developments.
Gold – 25 July: Watching M15 Demand for Bullish Reversal📍 Gold – 25 July Outlook
Early Signs of Reversal from H4 OB Zone – Wait for Clear Continuation
🔍 Market Recap & Context:
Yesterday, the H4 Order Block zone (3359–3345) was retested and showed signs of holding. A visible M15 structure shift (ChoCH) suggests the market may be preparing to resume the uptrend.
However, the M15 Break of Structure (BoS) has not yet occurred — so this is not a confirmed reversal .
📍 Current Zone to Watch:
M15 Demand Zone: 3359.5 – 3351.5
Price is retracing into this zone. If respected, it could be the base for the next bullish leg.
📌 Trade Setup Possibility:
If price holds the M15 demand zone and M1 gives confirmation (e.g., micro-ChoCH + micro-BoS , a long trade could be considered.
But keep in mind — this would be an aggressive entry , because the M15 BoS is still pending.
This setup would rely on:
• Candlestick behavior
• Volume spikes or reaction
• Price action psychology
✅ Strategy Note:
Wait for signals like:
– Bullish engulfing on M1 or M5
– Micro ChoCH + demand hold
– Volume absorption or imbalance reaction
Only act if the market shows strength — not just a zone tap.
📝 Summary:
• Bias: Early bullish reversal watch
• Zone in Play: 3359.5–3351.5 (M15 demand)
• Confirmation: M1 LTF shift + strong candlesticks
• Caution: No M15 BoS yet — be precise and patient
• Risk Management: 1:3 RR — 40 pip SL / 120 pip TP
Let the chart speak first — observe with stillness, execute with precision.
📘 Shared by @ChartIsMirror


350pips Secured — Focus Shifts to Dip-Buying StrategyToday's trading was very successful, and the grasp of the long and short rhythm was very accurate. Today's trading situation is as follows:
1. Close the short position with an overnight entry price of around 3386 near 3380, with a loss of 60 pips, and the loss amount exceeded $6K;
2. Directly short gold near 3380, manually close the position near 3366, profit 130pips, profit amount exceeded $12K;
3. Long gold near 3356, hit TP: 3372 and end the transaction, profit 160pips, profit amount exceeded $8K;
4. Long gold near 3362, hit TP; 3375 and end the transaction, profit 120pips, profit amount exceeded $6K.
Intraday trading summary: Today, the long and short sides completed a total of 4 transactions, one of which suffered a loss, but the net profit was 350pips, and the profit amount exceeded $20K. For short-term trading, I think I can submit a satisfactory answer to myself today!
How to execute the transaction next? Gold started to pull back from around 3438 and has now reached a low of around 3351, with a retracement of more than 870pips. The retracement space is not small. However, gold has stabilized above 3350 and has started a technical rebound repair, and the upward force is not weak, so gold may have completed the retracement. Under the support of these two technical conditions, gold may regain its upward momentum and hit 3400 again.
At present, the short-term resistance is obvious, located in the area near 3380. Once gold breaks through 3380, gold will inevitably continue to rise and hit 3400 again; but I think as long as gold stabilizes above 3350, it is not difficult to break through the short-term resistance of 3380, so gold will inevitably test the 3400 mark again; and the short-term support below is in the 3365-3355 area. Gold may still retreat to this area first during the rise in order to increase liquidity and accumulate momentum, helping gold to break through 3380 more easily.
So for the next short-term trading, I think it is feasible to go long on gold in the 3365-3355 area, first looking at the target area of 3380-3390, and then 3400.
