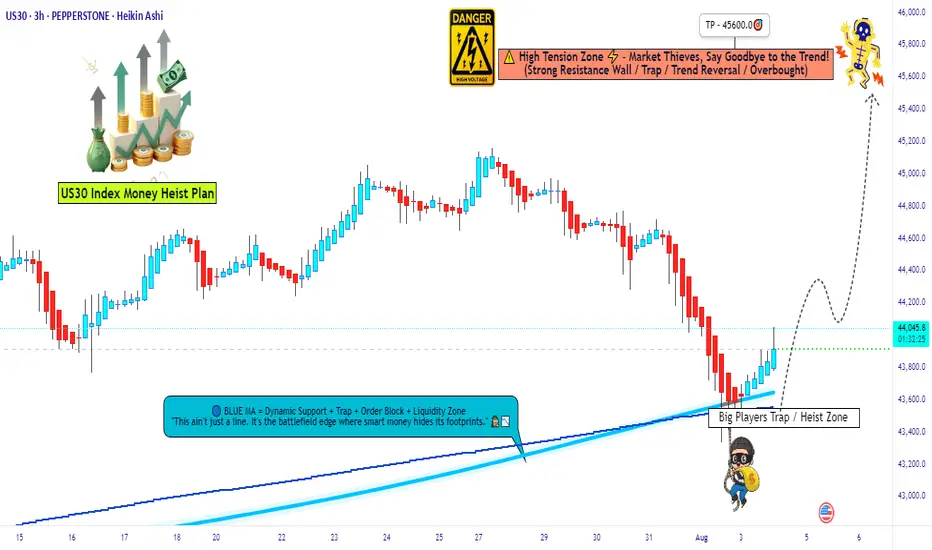
Heist Alert: Dow 30 Bullish Surge Incoming – Lock In Targets🦹♂️💎 “US30 Gold Vault Heist” – Thief’s Bullish Break-In Plan! 🚨📈
(Brought to you by Thief Trader – Layered Entry. Zero Mercy. Big Bags.)
🌍 Welcome to the Heist Floor, Global Market Bandits!
🎯 US30 is the next vault on the hitlist – and we’re going in loud but calculated.
💣 The Setup: Bullish Raid in Progress!
The Thief has eyes on Wall Street's armored vault — US30 Index — gearing up for a multi-layered bullish assault.
💼 Using limit orders like C4 on the door hinges, we’re stacking precise entries for maximum loot extraction. This isn’t gambling — this is organized market crime.
🔓 Entry Protocol – Any Price Level Is Breachable
🪜 Layered Limit Orders: Entry at any market level, multiple orders spread like a thief’s toolkit.
No sniper candle required — we work the shadows and stack with precision.
(Use the 15m-1H TF to tighten your strike zone.)
🛑 Stop Loss – The Getaway Hatch
📍 SL parked at 43300.0 – if the mission fails, we vanish clean.
No chasing losses — the next heist awaits.
📈 Take Profit – The Loot Vault
🎯 Target: 45600
That’s the gold room, the top floor, the getaway car location.
Use trailing SLs to secure the bag mid-run if resistance agents start showing up.
🧠 Behind the Heist – What’s Fueling This Move?
Global risk-on tone? ✅
Dow futures resilience? ✅
Thief’s sentiment meter flashing GREEN? ✅
Index rebalancing & sector flow favoring bulls? ✅
We don’t just trade the chart. We rob the macro narrative.
🚫 News Caution – No Sudden Sirens
Avoid entering during red folder data drops or FOMC speeches.
Stay ghosted. Let the volatility settle, then strike. 🕵️♂️
💥 Smash the BOOST Button 💖 If You’re With the Crew!
Let’s run this like a proper cartel of information — share it, save it, tag your trader circle.
Every like supports the next robbery plan.
No signals. No fluff. Just pure market exploitation.
📌 Disclaimer: Educational analysis only. No financial advice. Manage your risk like a true thief — never expose the whole bag.
💼📊 Thief Trader Out — More heist maps coming soon.
🔐 Rob Smart. Stack Heavy. Run Fast. 🦹♂️💸📈
US30 trade ideas
4H Analysis of Dow Jones | Selling Pressure Below Key Resistance4H Analysis of Dow Jones
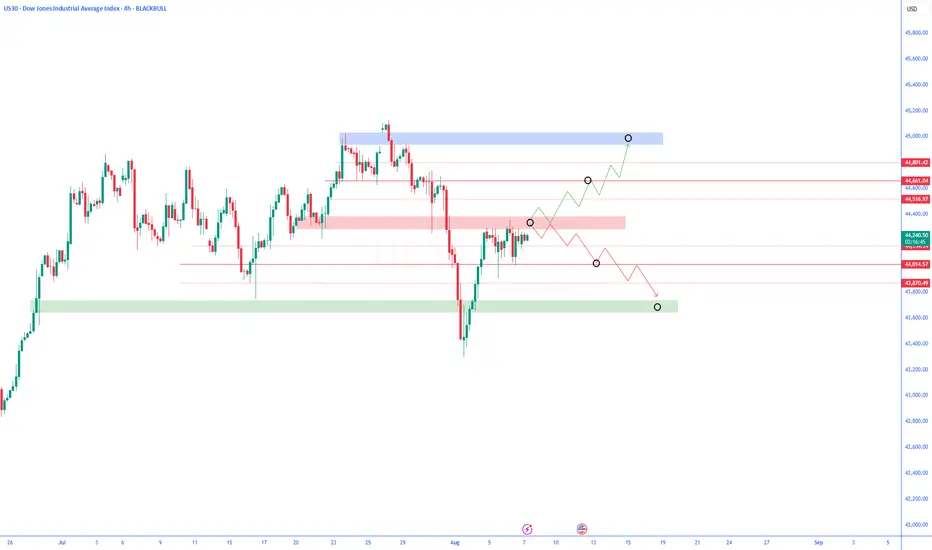
🔸 Price is currently trading below a key resistance level and has yet to break above it.
🔻 If weakness persists, a bearish reversal toward lower support levels is likely.
🔹 A confirmed breakout above the resistance could open the path for further upside.
✅ Price reaction to this resistance will determine the next market direction.
US30 Swing Short!
HI,Traders !
#US30 keeps falling down
And the index broke the
Key wide horizontal level
Around 43924.6 which is now
A resistance and the breakout
Is confirmed so we are very
Bearish biased and we will
Be expecting a bearish
Continuation on Monday !
Comment and subscribe to help us grow !

US30 Bearish Breakout!
HI,Traders !
#US30 made a bearish
Breakout of the key horizontal
Level of 44822.3which also
Seems to have been a neckline
Of the small H&S pattern so
We are locally bearish biased
And we will be expecting a
Further bearish move down !
Comment and subscribe to help us grow !

US30 LongElite Analysis
Double confirmation on lower time frame
- Interesting is that I am finding the same confirmations in the seconds charts giving me a stronger trade.
Targeting upper liquidity pools
Executed in a lower time frame

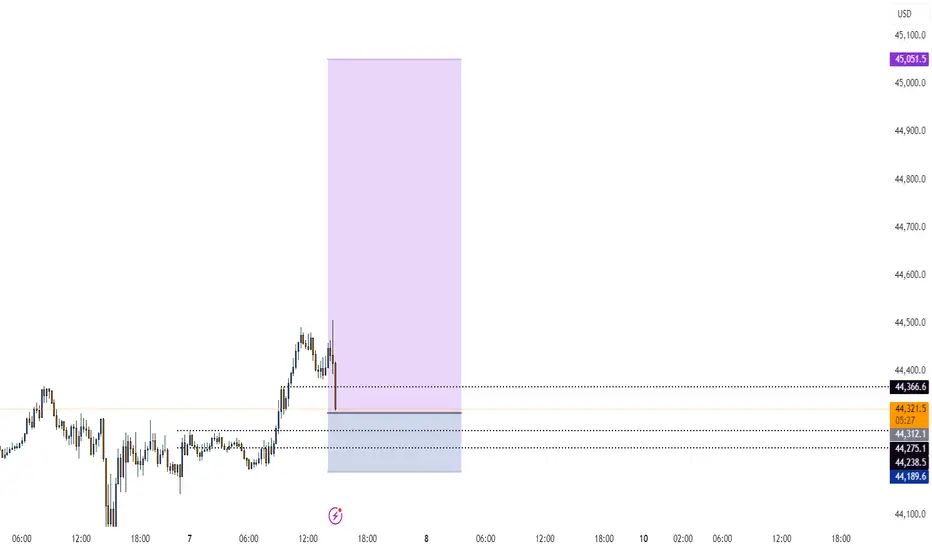
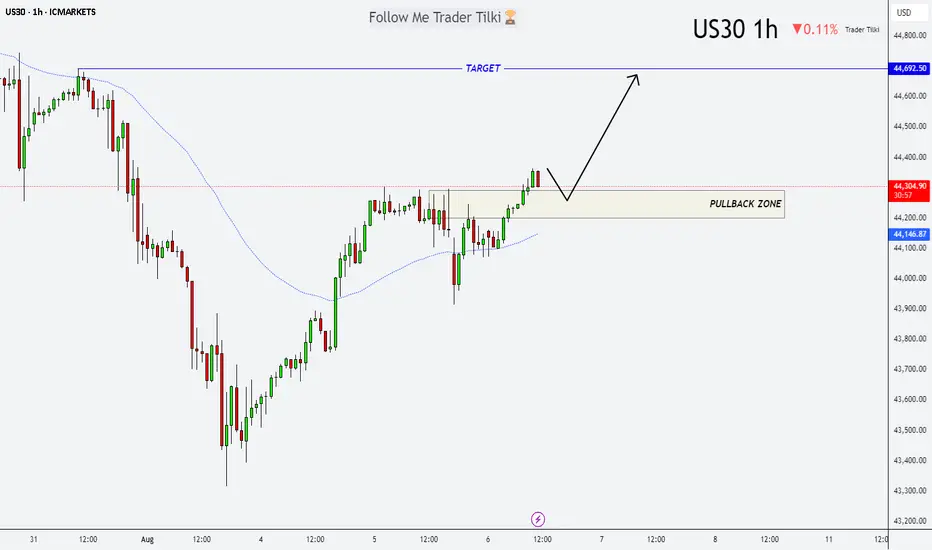
US30 at the Turn: Buy Setup from the Pullback ZoneHey friends 👋
Here’s my latest analysis on US30 (Dow Jones). I’m watching a potential pullback into the zone I marked: 44,292 – 44,190. I plan to open a buy position from that range, targeting 44,692 as my take-profit level.
Every single like you send is a huge source of motivation for me to keep sharing these insights. Big thanks to everyone supporting with a tap of appreciation 🙏
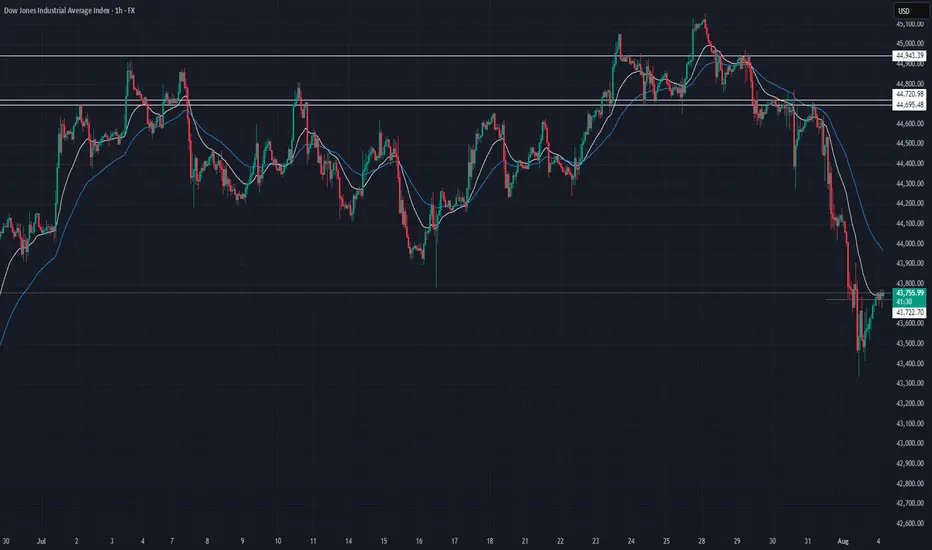
Dow Jones Industrial Average (DJIA) – 1H Chart Analysis | Aug 8,Current Structure:
Price is trading between 44,119 resistance and 43,816 support, consolidating after a sharp drop and partial recovery.
Resistance Zone:
The 44,119 level is acting as immediate intraday resistance; a clean breakout could push toward 44,514.
Support Zone:
43,816 remains a strong floor; below this, 43,524 is the key level where last strong bullish reversal started.
Momentum Outlook:
Recovery candles are showing smaller bodies with upper wicks, suggesting buyers are cautious and momentum is fading.
Trading Bias:
Bullish: Break above 44,119 → target 44,514.
Bearish: Break below 43,816 → retest of 43,524 likely.


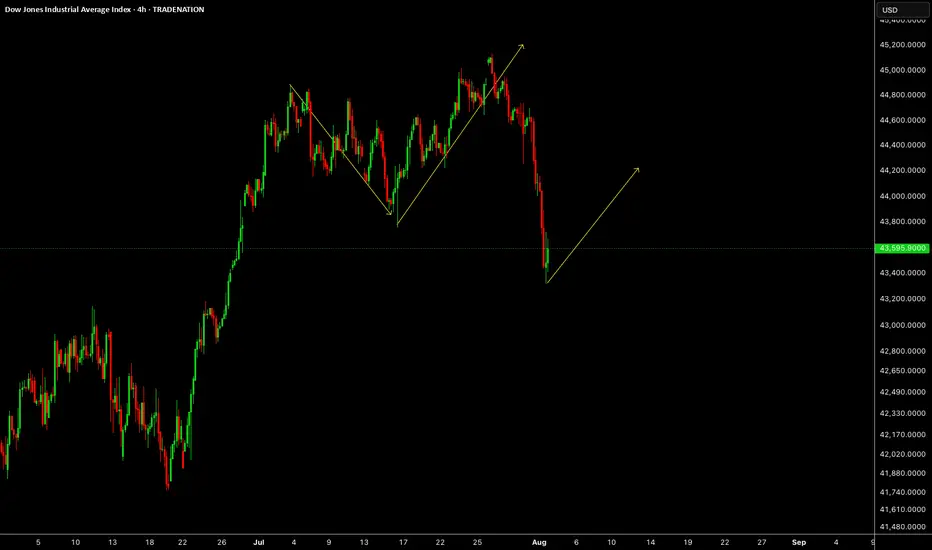
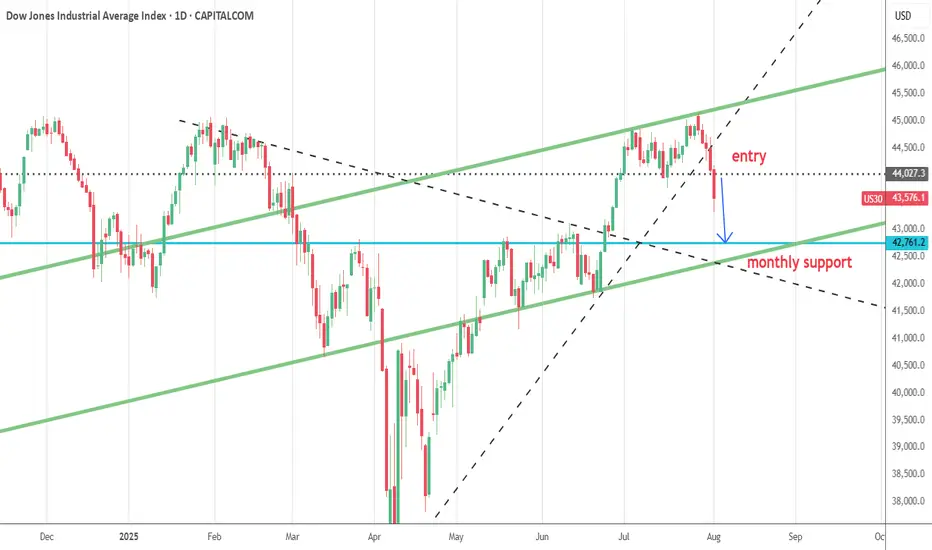
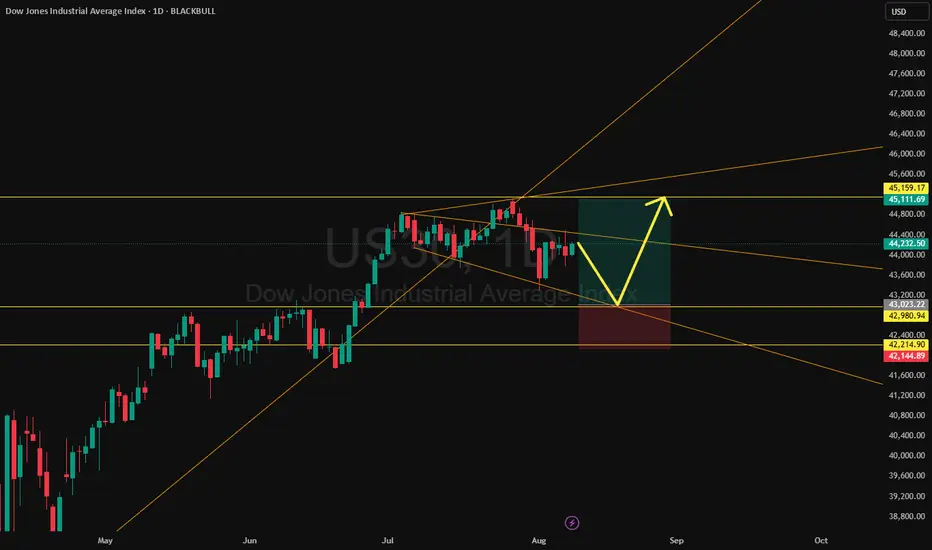
US30US30 needs some more correction downside short term before going up to take ATH.
Disclosure: We are part of Trade Nation's Influencer program and receive a monthly fee for using their TradingView charts in our analysis.

DowJones oversold bounce back supported at 44020Key Support and Resistance Levels
Resistance Level 1: 44708
Resistance Level 2: 44925
Resistance Level 3: 44128
Support Level 1: 44020
Support Level 2: 44760
Support Level 3: 43477
This communication is for informational purposes only and should not be viewed as any form of recommendation as to a particular course of action or as investment advice. It is not intended as an offer or solicitation for the purchase or sale of any financial instrument or as an official confirmation of any transaction. Opinions, estimates and assumptions expressed herein are made as of the date of this communication and are subject to change without notice. This communication has been prepared based upon information, including market prices, data and other information, believed to be reliable; however, Trade Nation does not warrant its completeness or accuracy. All market prices and market data contained in or attached to this communication are indicative and subject to change without notice.

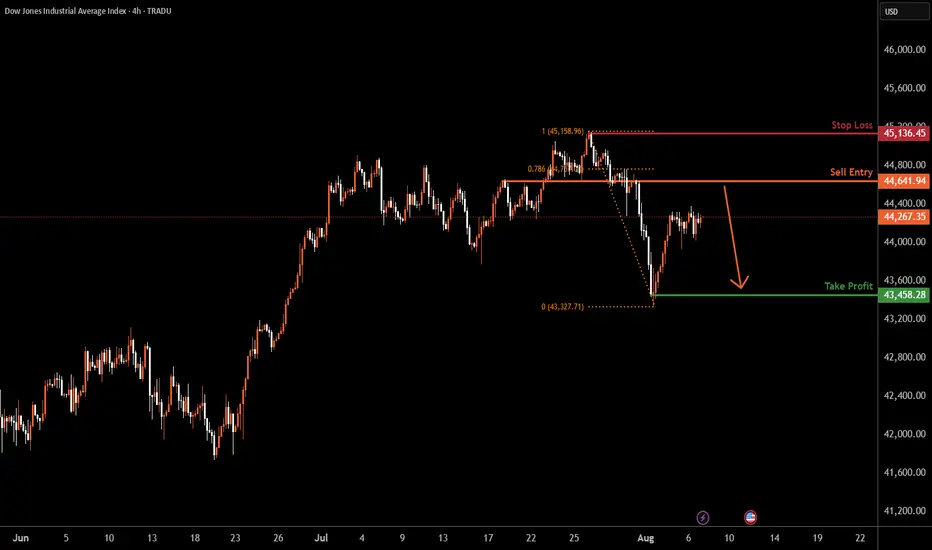
US30 H4 | Bearish reversalDow Jones (US30) is rising towards the sell entry which is an overlap resistance and could reverse to the downside.
Sell entry is at 44,641.94, which is an overlap resistance that is slightly below the 78.6% Fibonacci retracement.
Stop loss is at 45,136.45, which is a swing high resistance.
Take profit is at 43,458.28, which has been identified as a swing low support.
High Risk Investment Warning
Trading Forex/CFDs on margin carries a high level of risk and may not be suitable for all investors. Leverage can work against you.
Stratos Markets Limited (tradu.com ):
CFDs are complex instruments and come with a high risk of losing money rapidly due to leverage. 65% of retail investor accounts lose money when trading CFDs with this provider. You should consider whether you understand how CFDs work and whether you can afford to take the high risk of losing your money.
Stratos Europe Ltd (tradu.com ):
CFDs are complex instruments and come with a high risk of losing money rapidly due to leverage. 66% of retail investor accounts lose money when trading CFDs with this provider. You should consider whether you understand how CFDs work and whether you can afford to take the high risk of losing your money.
Stratos Global LLC (tradu.com ):
Losses can exceed deposits.
Please be advised that the information presented on TradingView is provided to Tradu (‘Company’, ‘we’) by a third-party provider (‘TFA Global Pte Ltd’). Please be reminded that you are solely responsible for the trading decisions on your account. There is a very high degree of risk involved in trading. Any information and/or content is intended entirely for research, educational and informational purposes only and does not constitute investment or consultation advice or investment strategy. The information is not tailored to the investment needs of any specific person and therefore does not involve a consideration of any of the investment objectives, financial situation or needs of any viewer that may receive it. Kindly also note that past performance is not a reliable indicator of future results. Actual results may differ materially from those anticipated in forward-looking or past performance statements. We assume no liability as to the accuracy or completeness of any of the information and/or content provided herein and the Company cannot be held responsible for any omission, mistake nor for any loss or damage including without limitation to any loss of profit which may arise from reliance on any information supplied by TFA Global Pte Ltd.
The speaker(s) is neither an employee, agent nor representative of Tradu and is therefore acting independently. The opinions given are their own, constitute general market commentary, and do not constitute the opinion or advice of Tradu or any form of personal or investment advice. Tradu neither endorses nor guarantees offerings of third-party speakers, nor is Tradu responsible for the content, veracity or opinions of third-party speakers, presenters or participants.
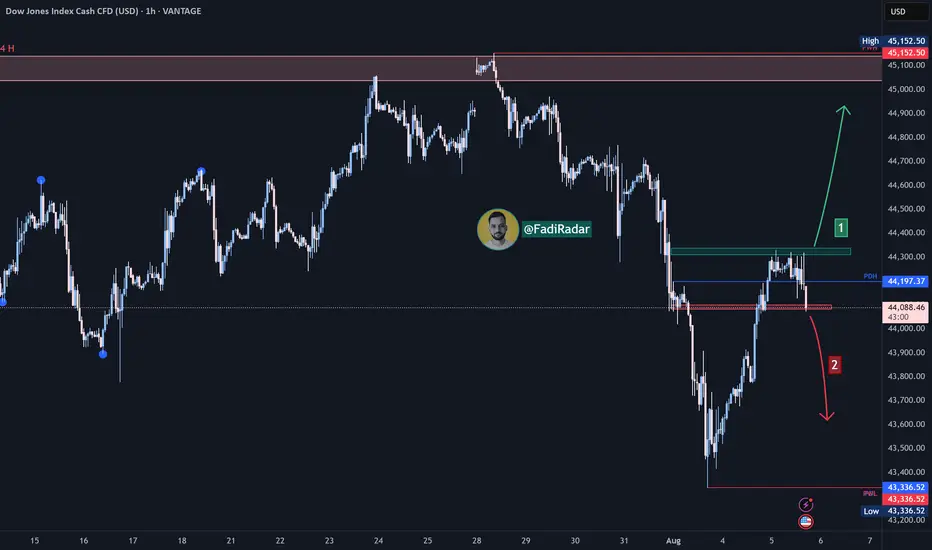
Dow Jones Index (US30) Technical Analysis:The Dow Jones is currently trading near $44,100, after a strong bullish move that failed to break through the $44,300 resistance zone.
🔹 Bearish Scenario:
If the price breaks below $44,000 and holds, it may head toward the $43,350 support level.
🔹 Bullish Scenario:
If bullish momentum returns and the price breaks above $44,300, the next target may be around $45,100.
⚠️ Disclaimer:
This analysis is not financial advice. It is recommended to monitor the markets and carefully analyze the data before making any investment decisions.
DowJones at pivotal zoneKey Support and Resistance Levels
Resistance Level 1: 44515
Resistance Level 2: 44710
Resistance Level 3: 45100
Support Level 1: 43945
Support Level 2: 43756
Support Level 3: 43482
This communication is for informational purposes only and should not be viewed as any form of recommendation as to a particular course of action or as investment advice. It is not intended as an offer or solicitation for the purchase or sale of any financial instrument or as an official confirmation of any transaction. Opinions, estimates and assumptions expressed herein are made as of the date of this communication and are subject to change without notice. This communication has been prepared based upon information, including market prices, data and other information, believed to be reliable; however, Trade Nation does not warrant its completeness or accuracy. All market prices and market data contained in or attached to this communication are indicative and subject to change without notice.

us30signal: sell (downtrend-H1)
setup: correction (wa to wb to wc)
confirmation:
1. fibo yes
2. snd yes
3. sbt yes
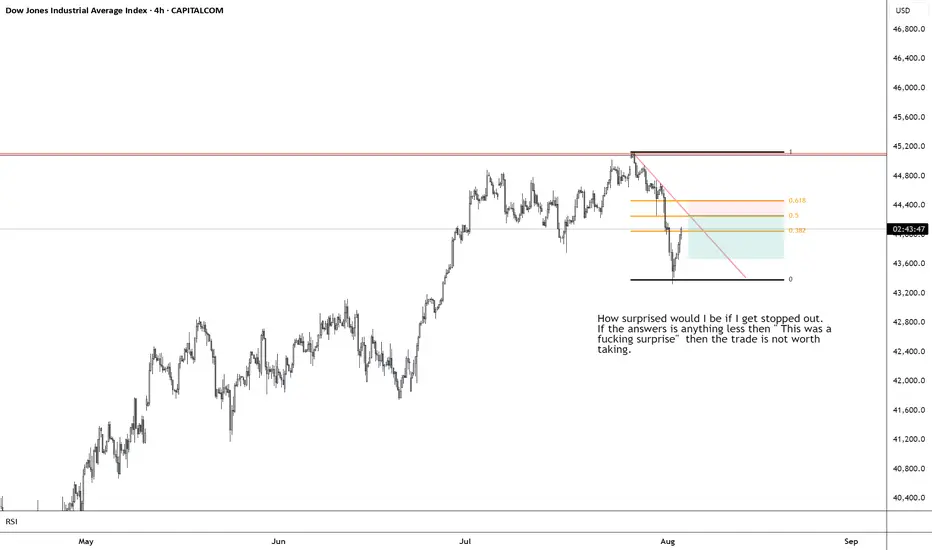
US30 – Expanding Wedge SetupPrice is pressing the upper edge of an expanding wedge pattern. Watching for a breakdown from the inner trend line toward the lower wedge boundary before a potential push to challenge all-time highs. Key zones mapped for both scenarios.
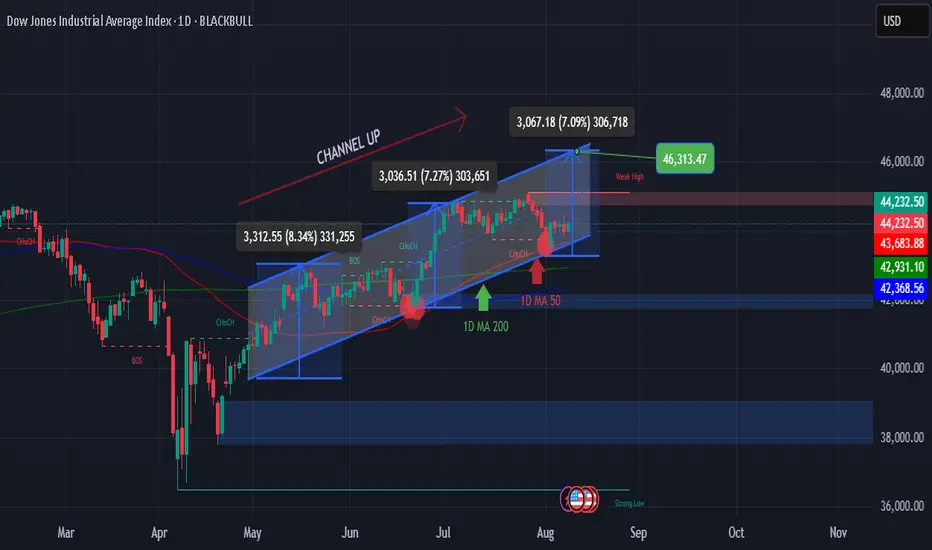
DOW JONES - STRONG SUPPORT BOUNCE INSIDE CHANNEL UP
The Dow Jones (DJI) has been moving inside a Channel Up since the April 25 low. Right now, price is consolidating after touching and bouncing from the 1D MA50 (blue line), which also aligns with the bottom of the Channel.
This area forms a Higher Low, which is one of the strongest technical supports.
The 1D RSI is also bouncing from the same level as the last Higher Low, increasing the chance of another bullish wave inside the Channel.
In the last two bullish legs, price gained at least +7%. Based on that, our short-term target is 46,350.
🟢 KAIZO US30 REPORT
🎯 Setup: BUY 📈
🔹 Entry: 44,000 – 44,200
🛑 Stop Loss: 42,930
✅ Take Profit: 46,313
📶 Confidence: High (85%)
💬 “Strong support means strong opportunities.”
#DJI #DowJones #StockMarket #ChannelUp #Kaizo
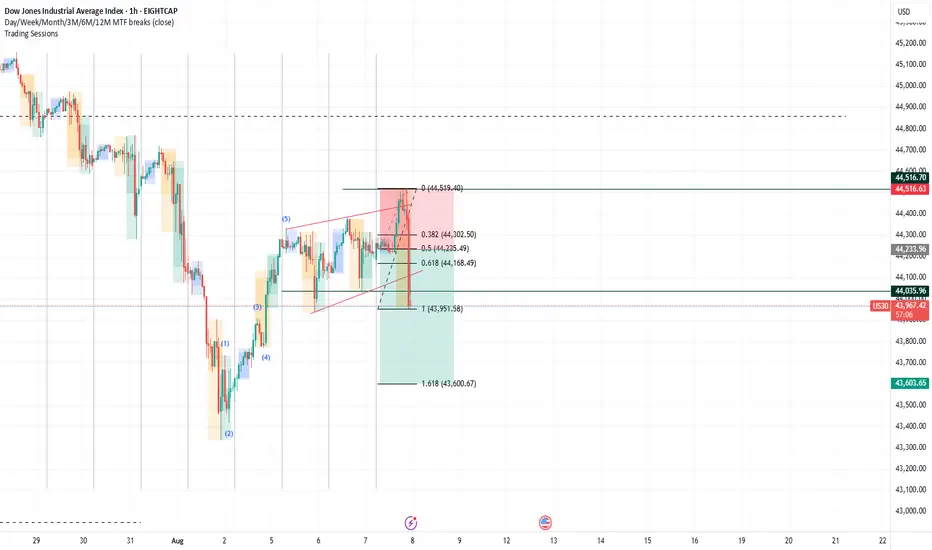
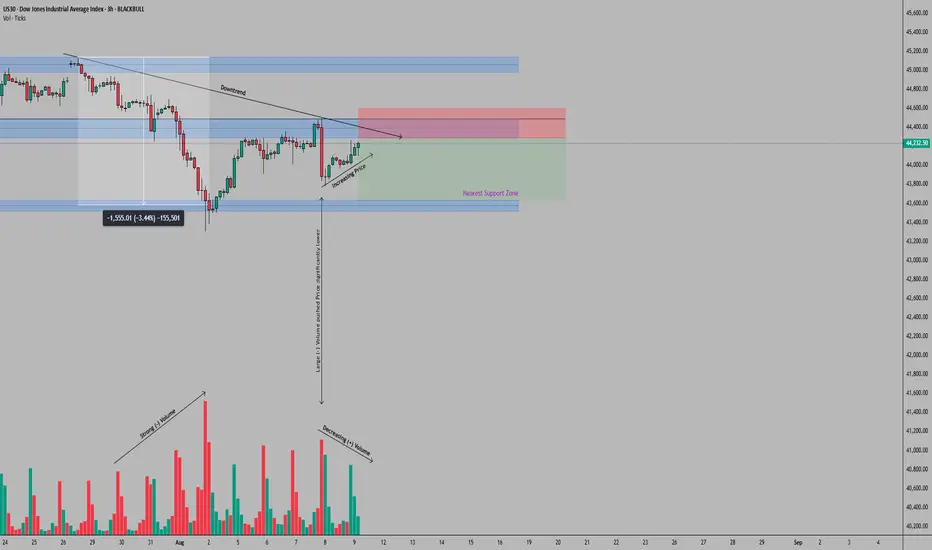
US30 (Dow Jones Industrial Index) Trade Setup – 3H TimeframeOn the 3-hour timeframe, US30 has established a clear bearish structure following its July 28, 2025 all-time high just above the 45,000 mark. The initial sharp decline from this level, characterized by strong negative volume, found support at 43,550 after a 3.44% correction. What's particularly noteworthy is the subsequent price action at the 44,400 level, which has transitioned from support to resistance, confirmed by a high-volume rejection on August 7.
The current market structure shows weakening momentum on recovery attempts, with declining positive volume as price tests the 44,400 barrier. This volume pattern, combined with the established downward trendline from the 45,126.50 ATH, suggests sellers remain in control of the short-term price action.
Illustrative Setup: A Sell Limit order at 44,290 aligns with the lower boundary of the resistance zone. The Stop Loss placement at 44,605 provides protection above both the 44,400 resistance and the descending trendline, offering clear invalidation if breached. The Take Profit target at 43,550 corresponds with the recent support level, where strong buying interest previously emerged, pushing price back up. This configuration yields a risk-reward ratio of 2.1:1, respecting the recent price action dynamics.
Key consideration: The high-volume rejection at 44,400 and subsequent declining volume on recovery attempts suggest institutional selling pressure remains dominant. However, traders should remain mindful that the broader market structure is still bullish despite this correction phase.
This analysis is provided solely for educational and entertainment purposes and does not constitute any form of financial or investment advice. Always manage your risk and trade responsibly.
US30 Technical Breakdown – 08/04/2025📍 US30 Technical Breakdown – 08/04/2025
US30 sold off sharply, breaking down from the 44,600–44,700 range and diving as low as 43,500. Price is currently bouncing near 43,750, but the trend remains weak with lower highs and a breakdown structure intact.
The market lost its key support zone and is now attempting a weak relief rally. Bulls must reclaim 44,000 to avoid further selling pressure.
📊 Current Market Behavior:
📉 Sharp downside momentum
🔄 Small bounce after aggressive breakdown
🧱 Old support at 44,600–44,700 now acting as resistance
⚠️ Bearish structure intact unless reclaimed
📌 Key Levels:
🔹 Resistance Zones:
43,950–44,000 → Minor intraday resistance
44,600–44,720 → Major breakdown zone
44,943 → Swing high before selloff
🔹 Support Zones:
43,600 → Intraday bounce zone
43,500 → Recent low
43,200 → Next potential demand area
🧠 Bias:
📉 Bearish Intraday
Market still under heavy pressure with no major reversal signals. Relief rallies likely to be sold until key levels are reclaimed.
US30 with A/J strategy Not saying that mach please keep in mind we have to protect the capital and follow the trend move please read the candles and follow the moves we have strong high on 1hr and 4hr also quick shift when you look down 15m S/Lows

US30US30 was expected to drop last week which is what market has done. This week we need upside correction or impulse.
Disclosure: We are part of Trade Nation's Influencer program and receive a monthly fee for using their TradingView charts in our analysis.