CGPTUSDT: Trend in 1 Hour time frame #CGPT
The price is moving within a descending channel on the 1-hour frame and is expected to break and continue upward.
We have a trend to stabilize above the 100 moving average once again.
We have a downtrend on the RSI indicator that supports the upward break.
We have a support area at the lower boundary of the channel at 0.0820, acting as strong support from which the price can rebound.
We have a major support area in green that pushed the price upward at 0.0785.
Entry price: 0.0841
First target: 0.0872
Second target: 0.0900
Third target: 0.0938
To manage risk, don't forget stop loss and capital management.
When you reach the first target, save some profits and then change the stop order to an entry order.
For inquiries, please comment.
Thank you.
CGPTUSDT trade ideas

CGPTUSDT 300% Summer?Elliot Impulse Wave 12345 has brought us up from the lows and the Correction Wave ABC potentially done. ATM the price is bouncing from the "golden pocket" area and the Cipher B is printing green on a Daily Time Frame providing confidence of reversal to the upside. There are some minor fvgs (Fair Value Gaps) to be filled beneath us around the fib 0.786 but if the Daily candle closes like this without any major wick I think we are clear. Potential short term upside target would be the important fib lines from the previous highs around 0.40$ and then re-evaluate. Mind also the development of BTC that leads the way.

CGPTUSDT: Trend in 4H time frameWe have two trends, be careful
The color levels are very accurate levels of support and resistance in different time frames, and we have to wait for their reaction in these areas.
So, Please pay special attention to the very accurate trend, colored levels, and you must know that SETUP is very sensitive.
Be careful
BEST
MT

#CGPTUSDTWe have a yellow pattern that is oscillating inside it.
When the task is determined by this pattern, the future direction can be understood.
A break of the top of the pattern from the red resistance band can cause it to jump, and
A break of the bottom of the pattern from the green support band can cause it to fall...
So for now we wait for a break of the top or bottom of the pattern.

CGPT/USDT – Breakout from Multi-Month Downtrend
Date: May 23, 2025
CGPT/USDT has officially broken out of a major downtrend line that has held since early 2025. The recent breakout is backed by increasing volume and bullish structure, showing clear signs of accumulation and trend reversal.
📊 Technical Overview:
Current Price: $0.1524
Breakout Zone: $0.145–$0.15 (now acting as support)
EMA Status: Price is trading above the 4EMA and 200EMA, indicating short and mid-term bullishness.
Volume: Strong surge on breakout — confirming interest and conviction from buyers.
📈 Entry Zones:
Retest Entry: $0.145–$0.15 (watch for a pullback into the blue zone).
Aggressive Entry: Immediate breakout continuation above current highs.
🧷 Validation:
As long as price remains above the breakout zone, the bullish setup remains intact.
A close below $0.14 would invalidate this momentum and suggest a potential fakeout.
🎯 Target Projections:
TP1: $0.1980 – First conservative target based on the width of the consolidation range.
TP2: $0.2240 – Next resistance zone from previous structural highs.
TP3: ~$0.29–$0.30 – Extended move potential if momentum continues and market conditions remain favorable.
📊 RSI Analysis:
RSI currently around 68 — bullish but not overbought.
RSI has made a series of higher lows, confirming the bullish price structure.
RSI breakout from its own downtrend earlier this month, reinforcing the momentum.
🧠 Final Thoughts:
CGPT/USDT is showing a clean breakout above months of resistance. With increasing volume and bullish RSI, the momentum looks strong. This could be the beginning of a larger trend reversal if key levels hold.
Good trading!!!

ALTCOIN BOOM FORCGPT (ChainGPT) 2025-2026 PROPOSALWhy This Asset?
Core Info: ChainGPT is an AI-driven blockchain project focused on democratizing access to AI tools for crypto users. Its offerings include AI-generated smart contracts, risk management analytics, and trading bots. Think of it as "ChatGPT for crypto" but with blockchain-specific utility.
Recent News:
Launched Beta version of AI NFT Generator, allowing users to mint NFTs via text prompts.
Partnered with OKX to integrate ChainGPT’s AI trading bot into the exchange’s interface.
CGPT listed on Bitget and MEXC, boosting liquidity and accessibility.
Deep Dive:
ChainGPT is tapping into two explosive trends:
AI x Crypto Narrative: Hype around AI tokens (FET, AGIX) has spilled into CGPT, which positions itself as a niche player for crypto-specific AI tools.
Retail Accessibility: Tools like no-code smart contracts and AI trading bots target newcomers overwhelmed by crypto’s complexity.
Latest Tech/Utility Update
Update: AI NFT Generator Beta launch + expanded staking pools with 25-30% APY.
Implications:
For Users: Simplifies NFT creation for non-technical users, competing with platforms like MidJourney but blockchain-native.
For Investors: High staking APY could attract short-term holders, but sustainability depends on actual product adoption.
Biggest Partner & Investment
Partner Spotlight: OKX (top-5 crypto exchange) integrated ChainGPT’s AI trading bot.
Deal: $1M investment over 12 months for exclusive early access to ChainGPT’s tools.
Impact: OKX’s 20M+ users gain exposure to CGPT, driving token demand. However, reliance on a single exchange partner poses concentration risk.
Most Recent Added Partner
New Collab: DexCheck (on-chain analytics platform) partnered to leverage ChainGPT’s AI for market insights.
Deal: $250k investment over 6 months.
Future Prospects: DexCheck’s user base (mostly degens and traders) aligns with CGPT’s target audience, but the partnership is small-scale. Needs more enterprise deals to justify valuation.
Tokenomics Update
Changes:
Total supply capped at 1B tokens, with 20% burned in Q2 2024.
Staking APY raised to 25-30% to incentivize holding.
Analysis: Burns reduce sell pressure, but ultra-high staking yields risk hyperinflation if demand doesn’t match token minting. Only 15% of supply is circulating, meaning massive unlocks could crash the price.
Overall Sentiment Analysis
Market Behavior: Mixed. CGPT surged 80% post-OKX news but corrected 20% this week. Retail traders are flipping the token, while whales accumulate.
Driving Forces:
Bullish: AI hype + OKX partnership FOMO.
Bearish: Concerns about product viability vs. competitors like Fetch.ai.
Insight: Sentiment is speculative. CGPT’s price action mirrors memecoins more than AI blue chips, suggesting it’s riding the narrative, not fundamentals.
Recent Popular Holders & Their Influence
Key Investors:
CryptoGodJohn (YouTube influencer) shilled CGPT to 500k followers, triggering a 30% pump.
TraderSZ (notorious altcoin flipper) bought $150k of CGPT last week.
Why Follow Them: Retail follows these figures blindly, but beware: Their pumps are often short-lived.
Summary & Final Verdict
Recap: ChainGPT merges AI and crypto in a retail-friendly package, but its success hinges on delivering unique tools (not just hype). OKX’s backing is a strong signal, but the project feels like a "right place, right time" play.
Verdict: CGPT is a high-risk, high-reward gamble. It could 5x if AI mania returns or when BTC hits 130K, but it’s a use-case tourist compared to established AI tokens. Only allocate speculative capital. 5% of your powder should be good.
Final Thought: If you’re comfortable trading hype cycles, CGPT is a candidate. If you prioritize fundamentals, wait for proof of adoption beyond influencer shills.

CGPTUSDT: Trend in daily time frameWe have two trends, be careful
The color levels are very accurate levels of support and resistance in different time frames, and we have to wait for their reaction in these areas.
So, Please pay special attention to the very accurate trend, colored levels, and you must know that SETUP is very sensitive.
Be careful
BEST
MT

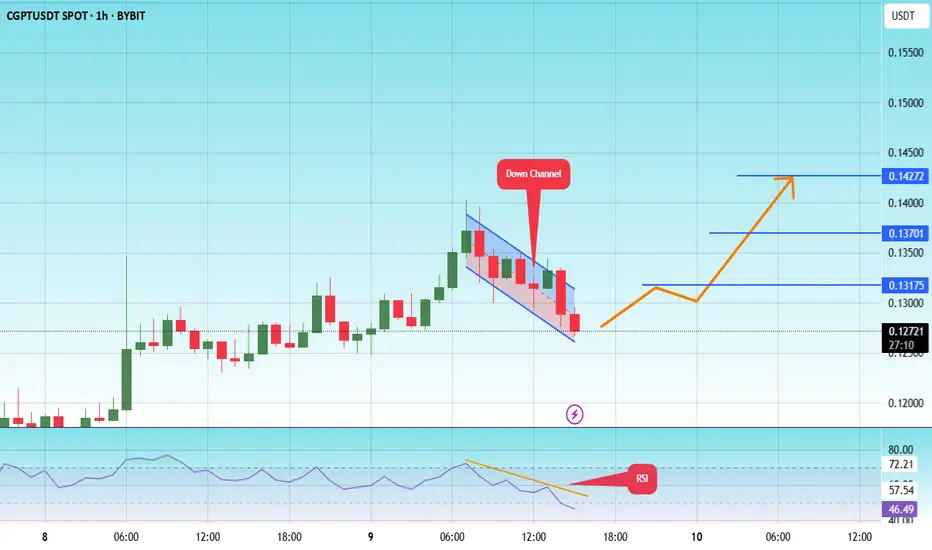
#CGPT/USDT Long#CGPT
The price is moving within a descending channel on the 1-hour frame and is expected to break and continue upward.
We have a trend to stabilize above the 100 moving average once again.
We have a downtrend on the RSI indicator that supports the upward move with a breakout.
We have a support area at the lower boundary of the channel at 0.12600, which acts as strong support from which the price can rebound.
Entry price: 0.12760
First target: 0.13175
Second target: 0.13700
Third target: 0.14272
Is the CGPT Retest a Setup-Are You Ready for It?Yello, Paradisers! Have you been watching CGPT closely? Because what we’re seeing now could be a textbook setup to liquidate early longs before a brutal downward move. This is the exact type of trap that punishes undisciplined traders and rewards those who wait.
💎After weeks of bullish momentum with clean higher highs and higher lows, #CGPTUSDT has now printed a clear change of character (CHoCH). The previous low was taken out, and now price has pulled back right into a high-probability resistance zone. This zone, between $0.115 and $0.118, aligns perfectly with a broken ascending trendline adding confluence that strengthens our bearish bias. Traders who aren't careful might interpret this retest as a sign of strength, but this could just be the market setting up its next liquidation wave.
💎Adding even more weight to this bearish thesis is the fact that #CGPT is currently trading below its 50 EMA on the 4H timeframe, showing clear weakness and confirming that the short-term momentum has already shifted in favor of sellers. This acts as dynamic resistance and makes it even harder for price to reclaim bullish control without a significant effort from buyers.
💎The structure is showing all signs of a classic trap. Price action is hesitant at resistance, and with momentum waning, a rejection from this level could spark a swift move down toward $0.09188, our first support zone. But that may not be the end of it. If selling accelerates, we are eyeing the $0.07133 area as a potential major demand zoneour strong support and where true smart money will likely accumulate. However, we must always remain tactical. If CGPTUSDT flips above $0.12526, this bearish scenario is invalidated and we would reassess for possible bullish continuation.
Discipline, patience, robust strategies, and trading tactics are the only ways you can make it long-term in this market.
MyCryptoParadise
iFeel the success🌴

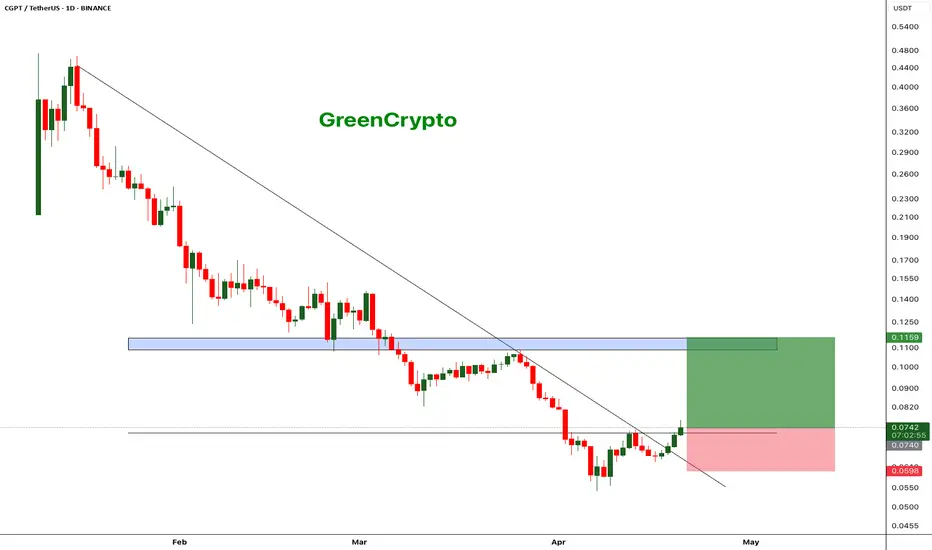
CGPT - Decent Swing Trade Opportunity $BINANCELCGPTUSDT (1D CHART) Technical Analysis Update
CGPT is currently trading at $0.0740 and successfully broke out from the local resistance and heading towards the next resistance. This gives a good opportunity for a quick swing trade with tight stoploss.
Entry level: $ 0.0740
Stop Loss Level: $ 0.0599
TakeProfit 1: $ 0.0818
TakeProfit 2: $ 0.0952
TakeProfit 3: $ 0.1114
Max Leverage: 2x
Position Size: 1% of capital
Remember to set your stop loss.
Follow our TradingView account for more technical analysis updates. | Like, share, and comment your thoughts.
Cheers
GreenCrypto
$CGPT Holding Strong — Another Move Coming?$CGPT is holding the uptrend well. 🚀
It bounced from the trendline and the 200 EMA, just like before.
The structure still looks strong with higher lows and steady volume.
This pullback could be the setup for another move up.
Watch this level closely.
Retweet if you are bullish!
DYOR, NFA
#Altseason2025

#CGPT/USDT#CGPT
The price is moving within a descending channel on the 1-hour frame, adhering well to it, and is heading for a strong breakout and retest.
We are seeing a bounce from the lower boundary of the descending channel, which is support at 0.0650.
We have a downtrend on the RSI indicator that is about to be broken and retested, supporting the upward trend.
We are looking for stability above the 100 moving average.
Entry price: 0.0666
First target: 0.0680
Second target: 0.0714
Third target: 0.0740

#CGPT/USDT#CGPT
The price is moving within a descending channel on the 1-hour frame, adhering well to it, and is on its way to breaking it strongly upwards and retesting it.
We are seeing a bounce from the lower boundary of the descending channel, which is support at 0.0650.
We have a downtrend on the RSI indicator that is about to break and retest, supporting the upward trend.
We are looking for stability above the 100 Moving Average.
Entry price: 0.0654
First target: 0.0678
Second target: 0.0692
Third target: 0.0721

CGPTUSDT: Trend in daily time frameThe color levels are very accurate levels of support and resistance in different time frames, and we have to wait for their reaction in these areas.
So, Please pay special attention to the very accurate trend, colored levels, and you must know that SETUP is very sensitive.
Be careful
BEST
MT

#CGPT/USDT#CGPT
The price is moving within a descending channel on the 1-hour frame and is expected to continue upward.
We have a trend to stabilize above the 100 moving average once again.
We have a downtrend on the RSI indicator that supports the upward move with a breakout.
We have a support area at the lower boundary of the channel at 0.0985.
Entry price: 0.1000
First target: 0.1029
Second target: 0.1055
Third target: 0.1083

#CGPT/USDT#CGPT
The price is moving within a descending channel on the 1-hour frame, adhering well to it, and is on its way to breaking it strongly upwards and retesting it.
We are seeing a bounce from the lower boundary of the descending channel, which is support at 0.0942.
We have a downtrend on the RSI indicator that is about to break and retest, supporting the upward trend.
We are looking for stability above the 100 Moving Average.
Entry price: 0.0964
First target: 0.0980
Second target: 0.1008
Third target: 0.1043

Just idea.... 300M$ left project from 0.47$ > 0.12$New ATH is possible on 0.85 in April.
Targets:
TP1: 0.24
TP2: 0.30
--------------------
If breaks 0.30:
TP1: 0.36
--------------------
If start forming on wide time frame CUP and Handle > NEW ATH>

1000% profit in a few daysIt has reached a critical point and should make a good jump from here to $2 or $3. Of course, this movement will be up and down, but it is certain. What is important is that this point, 20 cents, is the best entry price.

#CGPT (SPOT-1H) IN ( 0.2150- 0.2300)T.(0.4000) SL(0.2100)BINANCE:CGPTUSDT
( 1H time frame trade )
#CGPT / USDT
Entry( 0.2150- 0.2300)
SL 1H close below 0.2100
T1 0.2430
T2 0.2600
T3 0.2830
T4 0.3000
T5 0.3300
T6 0.3500
T7 0.4000
______________________________________________________________
Golden Advices.
********************
* collect the coin slowly in the entry range.
* Please calculate your losses before the entry.
* Do not enter any trade you find it not suitable for you.
* No FOMO - No Rush , it is a long journey.
Useful Tags.
****************
My total posts
www.tradingview.com
**********************************************************************************************
#Manta #OMNI #DYM #AI #IO #XAI #ACE #NFP #RAD #WLD #ORDI #BLUR #SUI #VOXEL #AEVO #VITE #APE #RDNT #FLUX #NMR #VANRY #TRB #HBAR #DGB #XEC #ERN #ALT #IO #ACA #HIVE #ASTR #ARDR #PIXEL #LTO #AERGO #SCRT #ATA #HOOK #FLOW #KSM #HFT #MINA #DATA #SC #JOE #RDNT #IQ #CFX #BICO #CTSI #KMD #FXS #DEGO #FORTH #AST #PORTAL #CYBER #RIF #ENJ #ZIL #APT #GALA #STEEM #ONE #LINK #NTRN #COTI #RENDER #ICX #IMX #ALICE #PYR #PORTAL #GRT #GMT #IDEX #NEAR #ICP #ETH #QTUM #VET #QNT #API3 #BURGER #MOVR #SKL #BAND #ETHFI #SAND #IOTX #T #GTC #PDA #GMX #REZ #DUSK #BNX #SPELL #POWR #JOE #TIA #TFUEL #HOT #AVAX #WAXP #OGN #AXS #GALA #ONE #SYS #SCRT #DGB #LIT #CGPT

Looks like we have been cheated? Let's short CGPT to deathLooks like we have been cheated? Let's short CGPT to death what do you think?

I expect 8-12$ peak before Jully 2025Really good project to buy, monitor team addresses just to safe if they are not selling.
Buy all dips!

CGPT): Bullish Cup & Handle Pattern
A potential Cup & Handle pattern forming within an ascending channel
This setup signals strong bullish potential with Fibonacci levels aligning perfectly for upside targets!
🎯 Target 1: $0.36028
🎯 Target 2: $0.48695
🎯 Target 3: $0.60095

Buy Position in CGPTIt is in an ascending channel that has been touched several times. Stop loss is activated when exiting the bottom of the channel.
