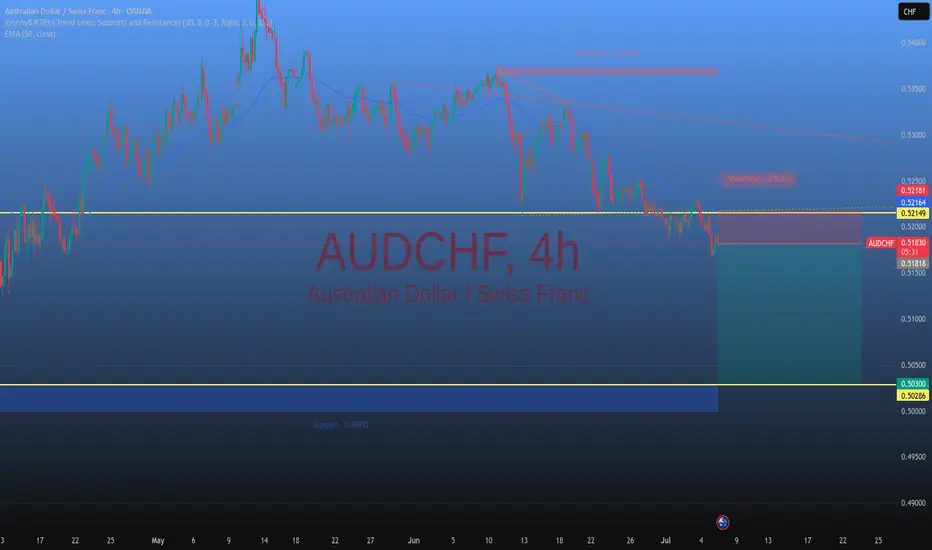
AUDCHF 4h analysis The market breaks out and going to retest that why we need to look out for bullish soon on audchf
CHFAUD trade ideas

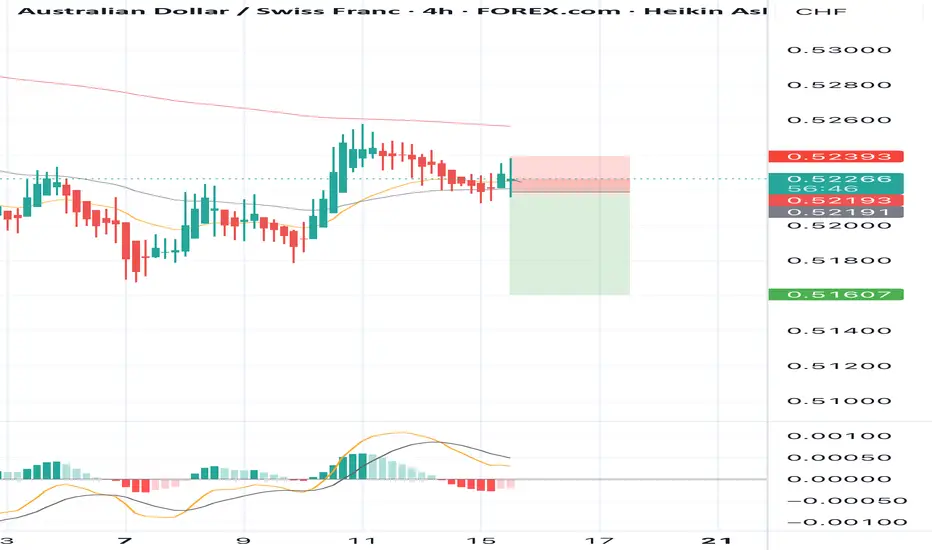
SELL AUDCHF now for a four hour time frame bearish trend contiSELL AUDCHF now for a four hour time frame bearish trend continuation..........
STOP LOSS: 0.5239
This sell trade setup is based on hidden bearish divergence trend continuation trading pattern...
Always remember, the trend is your friend, so whenever you can get a signal that the trend will continue, then good for you to be part of it
TAKE PROFIT : take profit will be when the trend comes to an end, feel from to send me a direct DM if you have any question about take profit or anything.
Remember to risk only what you are comfortable with….....trading with the trend, patient and good risk management is the key to success here
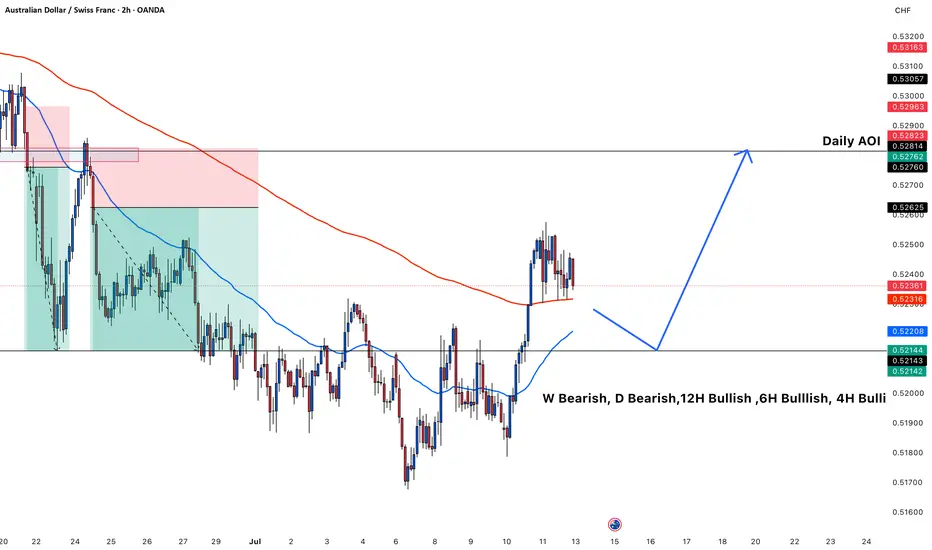
AUDCHF expecting bullish contianution
OANDA:AUDCHF interesting structure, trend based analysis, here exepcting bullish continuation.
SUP zone: 0.52200
RES zone: 0.52900, 0.53200

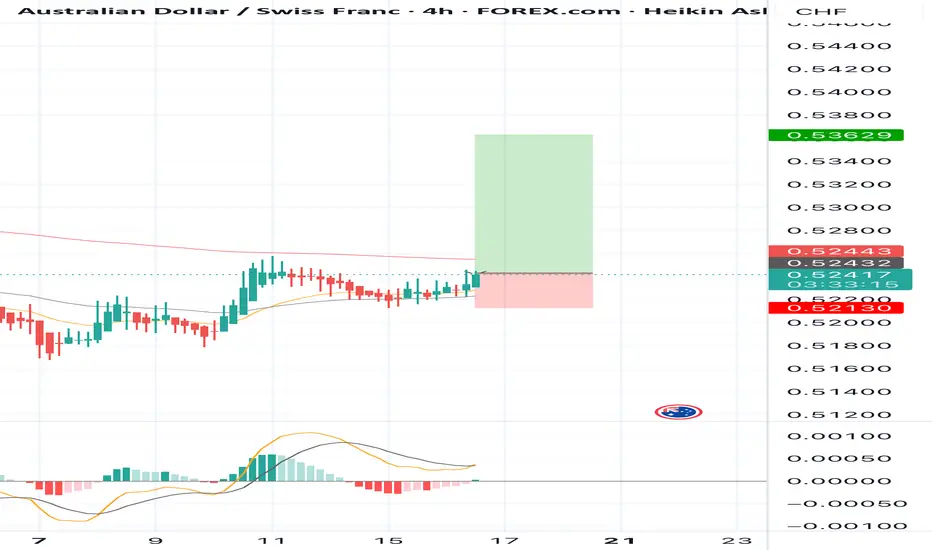
BUY AUDCHF for divergence bearish trend reversal STOP LOSS: 0.5BUY AUDCHF for divergence bearish trend reversal STOP LOSS: 0.52130
Regular Bullish Divergence
In case of Regular Bullish Divergence:
* The Indicator shows Higher Lows
* Actual Market Price shows Lower Lows
We can see a strong divergence on the MACD already and There is a strong trend reversal on the daily time frame chart.....
The daily time frame is showing strength of trend reversal from this strong level of Support so we are looking for the trend reversal and correction push from here.....
TAKE PROFIT : take profit will be when the trend comes to an end, feel from to send me a direct DM if you have any question about take profit or anything...
Remember to risk only what you are comfortable with... trading with the trend, patient and good risk management is the key to success here
LONG in AUDCHFHello fellow traders,
We've been seeing quite a bit of volatility in gold prices lately. Despite ongoing uncertainties—including tariffs and geopolitical tensions—I've decided to open a long position based on my technical analysis and a favorable risk-to-reward ratio.
Wishing everyone the best of luck and successful trades!

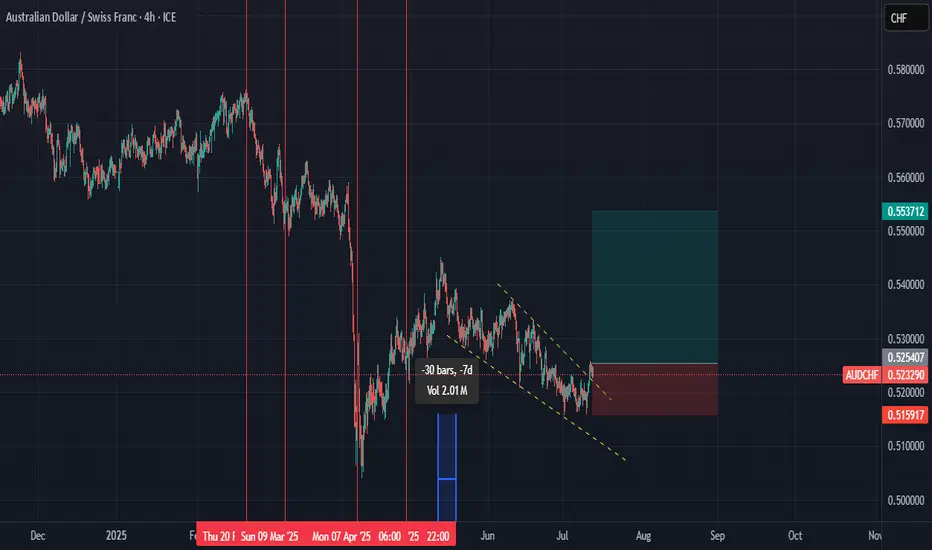
long AUDCHF with 90pips sl for 270pips tpprice appears to have broken out from the falling wedge and weekly candle looks prime for a continuation
AUDCHF Will Go Higher From Support! Long!
Take a look at our analysis for AUDCHF.
Time Frame: 1D
Current Trend: Bullish
Sentiment: Oversold (based on 7-period RSI)
Forecast: Bullish
The market is testing a major horizontal structure 0.522.
Taking into consideration the structure & trend analysis, I believe that the market will reach 0.533 level soon.
P.S
We determine oversold/overbought condition with RSI indicator.
When it drops below 30 - the market is considered to be oversold.
When it bounces above 70 - the market is considered to be overbought.
Disclosure: I am part of Trade Nation's Influencer program and receive a monthly fee for using their TradingView charts in my analysis.
Like and subscribe and comment my ideas if you enjoy them!

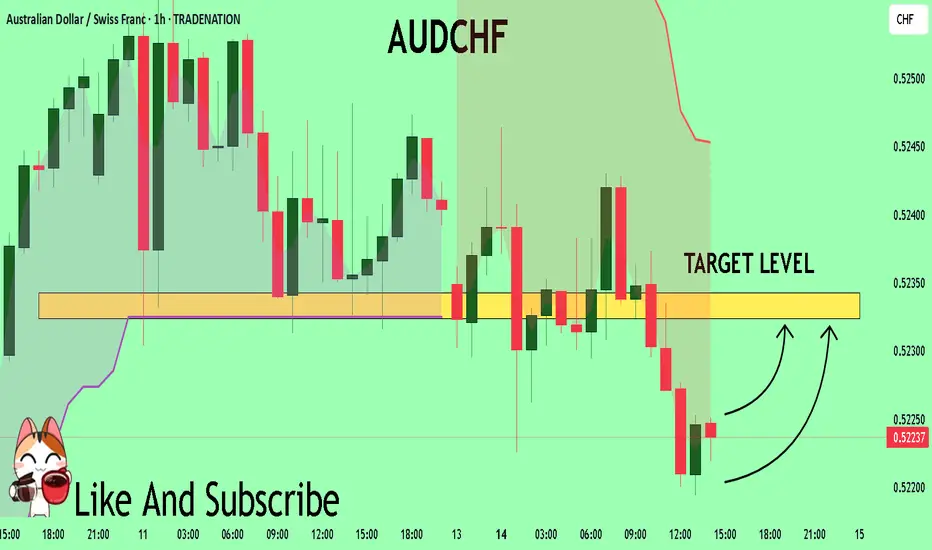
AUDCHF Expected Growth! BUY!
My dear friends,
AUDCHF looks like it will make a good move, and here are the details:
The market is trading on 0.5224 pivot level.
Bias - Bullish
Technical Indicators: Supper Trend generates a clear long signal while Pivot Point HL is currently determining the overall Bullish trend of the market.
Goal - 0.5232
About Used Indicators:
Pivot points are a great way to identify areas of support and resistance, but they work best when combined with other kinds of technical analysis
Disclosure: I am part of Trade Nation's Influencer program and receive a monthly fee for using their TradingView charts in my analysis.
———————————
WISH YOU ALL LUCK
AUDCHF Trade idea for 14th - 18th July 2025Enter trade at market open following CISD at 0.52316 with stop loss at 0.52561 and target at 0.49968. Cascade position with FVGs on 4HR and entry strategy on 1HR.

AUDCHF will continue its Bullish BiasIt has accumulated well AUDCHF already broke the structure.
I am just waiting for the Retest of the level.
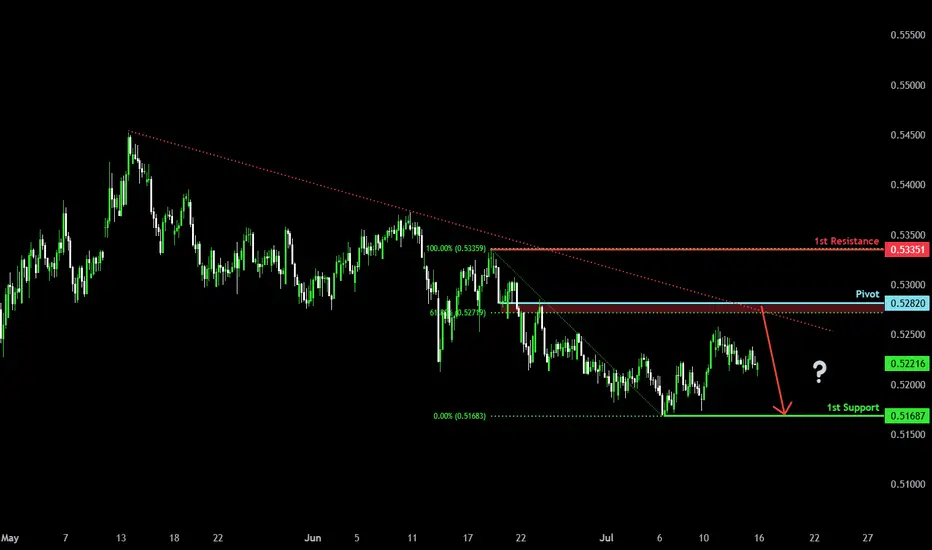
Bearish reversal?AUD/CHF is rising towards the pivot, which is a pullback resistance and could reverse to the 1st support.
Pivot: 0.52820
1st Support: 0.51687
1st Resistance: 0.53351
Risk Warning:
Trading Forex and CFDs carries a high level of risk to your capital and you should only trade with money you can afford to lose. Trading Forex and CFDs may not be suitable for all investors, so please ensure that you fully understand the risks involved and seek independent advice if necessary.
Disclaimer:
The above opinions given constitute general market commentary, and do not constitute the opinion or advice of IC Markets or any form of personal or investment advice.
Any opinions, news, research, analyses, prices, other information, or links to third-party sites contained on this website are provided on an "as-is" basis, are intended only to be informative, is not an advice nor a recommendation, nor research, or a record of our trading prices, or an offer of, or solicitation for a transaction in any financial instrument and thus should not be treated as such. The information provided does not involve any specific investment objectives, financial situation and needs of any specific person who may receive it. Please be aware, that past performance is not a reliable indicator of future performance and/or results. Past Performance or Forward-looking scenarios based upon the reasonable beliefs of the third-party provider are not a guarantee of future performance. Actual results may differ materially from those anticipated in forward-looking or past performance statements. IC Markets makes no representation or warranty and assumes no liability as to the accuracy or completeness of the information provided, nor any loss arising from any investment based on a recommendation, forecast or any information supplied by any third-party.

AUDCHF Buy PlanChatGPT said:
📈 AUDCHF Buy Plan
Bias: Bullish — Price tapped 4H demand zone (blue box).
Context: Liquidity swept below previous low. Price inside FVG zone.
Trigger: Wait for bullish confirmation from this zone (bullish candle or market structure shift).
Entry: Upon confirmation within context area.
Stop Loss: Below the recent swing low.
Target: H4 swing high or higher liquidity zone.
Risk: Adjust position size to maintain fixed % risk (as per your plan).
Note: Ignore past price action. Focus only if trade aligns with your system.
Let price breathe. Execute only when criteria match

AUDCHF BEARISH CONTINUATIONSell: $0.52816
Set up: Trendline break on daily and moving average price rejection
Sl: $0.53748
TP: 0.50830, 0.50067

AUDCHF; Heikin Ashi Trade IdeaOANDA:AUDCHF
In this video, I’ll be sharing my analysis of AUDCHF, using FXAN's proprietary algo indicators with my unique Heikin Ashi strategy. I’ll walk you through the reasoning behind my trade setup and highlight key areas where I’m anticipating potential opportunities.
I’m always happy to receive any feedback.
Like, share and comment! ❤️
Thank you for watching my videos! 🙏


AUD/CHF BEST PLACE TO SELL FROM|SHORT
AUD/CHF SIGNAL
Trade Direction: short
Entry Level: 0.524
Target Level: 0.520
Stop Loss: 0.526
RISK PROFILE
Risk level: medium
Suggested risk: 1%
Timeframe: 3h
Disclosure: I am part of Trade Nation's Influencer program and receive a monthly fee for using their TradingView charts in my analysis.
✅LIKE AND COMMENT MY IDEAS✅

AUDCHF Long Trade OANDA:AUDCHF Long trade, with my back testing of this strategy, it hits multiple possible take profits, manage your position accordingly.
This is good trade, don't overload your risk like greedy, be disciplined trader, this is good trade.
Use proper risk management
Looks like good trade.
Lets monitor.
Use proper risk management.
Disclaimer: only idea, not advice

Price action Audchf broke above second line and left liquidity the body of candle never closed below the break of structure created high took out all the early buyer target the high

AUDCHF: Pullback From Resistance 🇦🇺🇨🇭
AUDCHF is going to retrace from a key daily resistance.
As a confirmation, I spotted a double top pattern on 30 minutes time frame
and a very bearish reaction after CHF fundamental news releases an hour ago.
Goal - 0.5238
❤️Please, support my work with like, thank you!❤️
I am part of Trade Nation's Influencer program and receive a monthly fee for using their TradingView charts in my analysis.

BUY AUDCHF for divergence bearish trend reversal STOP LOSS: 0.52BUY AUDCHF for divergence bearish trend reversal STOP LOSS: 0.52099
Regular Bullish Divergence
In case of Regular Bullish Divergence:
* The Indicator shows Higher Lows
* Actual Market Price shows Lower Lows
We can see a strong divergence on the MACD already and There is a strong trend reversal on the daily time frame chart.....
The daily time frame is showing strength of trend reversal from this strong level of Support so we are looking for the trend reversal and correction push from here.....
TAKE PROFIT : take profit will be when the trend comes to an end, feel from to send me a direct DM if you have any question about take profit or anything...
Remember to risk only what you are comfortable with... trading with the trend, patient and good risk management is the key to success here

AUD-CHF Rebound Ahead! Buy!
Hello,Traders!
AUD-CHF keeps falling but
A horizontal support level
Is ahead around 0.5160
And as the pair is locally
Oversold we will be expecting
A local bullish rebound
Buy!
Comment and subscribe to help us grow!
Check out other forecasts below too!
Disclosure: I am part of Trade Nation's Influencer program and receive a monthly fee for using their TradingView charts in my analysis.
