CHFAUD trade ideas

AUDCHF Bullish BiasPrice continued to make lower lows and lower highs, clearly showing a downtrend. After price made an accumulation schematic 2 set-up, it entered in a mark-up phase. Now, price is forming another accumulation again before heading bullish.

Audchf Am looking to take this trade I had de first entry last week but price didn't respect the zone I got in so early so am expecting a pull back to the zone den a reversal candle stick then i take the trade

AUDCHF Will Grow! Buy!
Take a look at our analysis for AUDCHF.
Time Frame: 1D
Current Trend: Bullish
Sentiment: Oversold (based on 7-period RSI)
Forecast: Bullish
The market is on a crucial zone of demand 0.519.
The oversold market condition in a combination with key structure gives us a relatively strong bullish signal with goal 0.534 level.
P.S
The term oversold refers to a condition where an asset has traded lower in price and has the potential for a price bounce.
Overbought refers to market scenarios where the instrument is traded considerably higher than its fair value. Overvaluation is caused by market sentiments when there is positive news.
Disclosure: I am part of Trade Nation's Influencer program and receive a monthly fee for using their TradingView charts in my analysis.
Like and subscribe and comment my ideas if you enjoy them!

IS PRICE REVERSAL AROUND THE CORNER IN AUDCHF?- H4 Outlook! AUDCHF has been trending bearish for a long period of time in H4 timeframe and also on daily timeframe. Recently, we saw a bullish breakout couple of days ago and we’re yet to ascertain the next possible move in this pair.
Technically, if we get a break above 0.52522 I’d be anticipating more bullish price action to develop.

Long Market currently is on a downtrend and it's retracing on the daily timeframe to the round l@0.53000 creating a chart pattern on the 4hrs timeframe , currently having a pull back to the neck line at a physiological @0.52200 at my AOI where I will be taking a buy , it's a counter trend but sure worth it

Long Market is retracing on the daily to the round physiological level @0.53000 , therefore creating a chart pattern and currently having a pull back to the neck line at a physiological zone @0.52200 with is my AOI where I would take my buy trade

Potential Long Opportunity on AUDCHFReasons I think this pair will rise:
- Confirmed trend line which means harder break out.
- Price printed a higher low recently which may suggest a break out is about to happen
- RSI was oversold on Daily chart
What do you think?

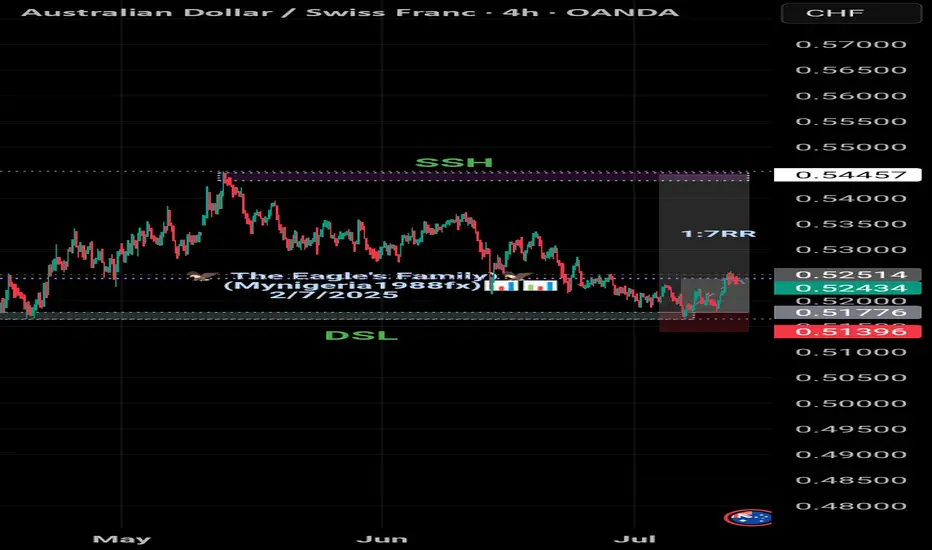
AUDCHF "LONG"This AUDCHF has been on a fall for a long time.
But right now,we look forward for a buy since the failed demand zone has been spotted out.
The market has been on a buy for days,you can still come in for a buy on the 3rd zone.
Massively A Buy Market as has been Analysed by Mynigeria1988fx📊📊
AUD-CHF Local Long! Buy!
Hello,Traders!
AUD-CHF made a bullish
Breakout of the key horizontal
Level of 0.5221 which is now a
Support and the pair is going down
To retest the level from where
We will be expecting a
Further bullish move up
Buy!
Comment and subscribe to help us grow!
Check out other forecasts below too!
Disclosure: I am part of Trade Nation's Influencer program and receive a monthly fee for using their TradingView charts in my analysis.

Bullish Look for potential Reversal bullish candlestick formation upon the retest of daily and 4 hours demand zone

AUDCHF LongAUDCHF is not net long on the regression break.
I am consider all CHF pairs this morning.
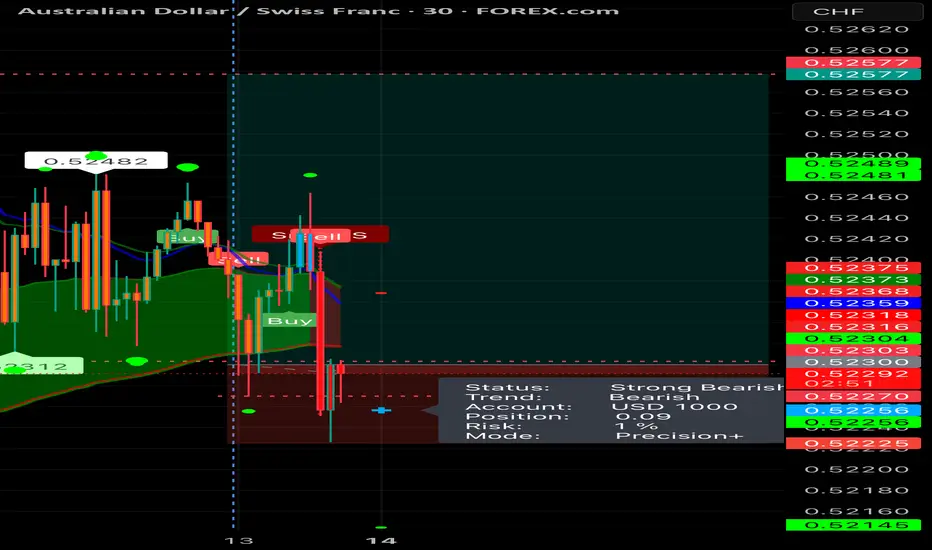
AUDCHF Technical Analysis! SELL!
My dear subscribers,
My technical analysis for AUDCHF is below:
The price is coiling around a solid key level - 0.5226
Bias - Bearish
Technical Indicators: Pivot Points Low anticipates a potential price reversal.
Super trend shows a clear sell, giving a perfect indicators' convergence.
Goal - 0.5205
About Used Indicators:
By the very nature of the supertrend indicator, it offers firm support and resistance levels for traders to enter and exit trades. Additionally, it also provides signals for setting stop losses
Disclosure: I am part of Trade Nation's Influencer program and receive a monthly fee for using their TradingView charts in my analysis.
———————————
WISH YOU ALL LUCK

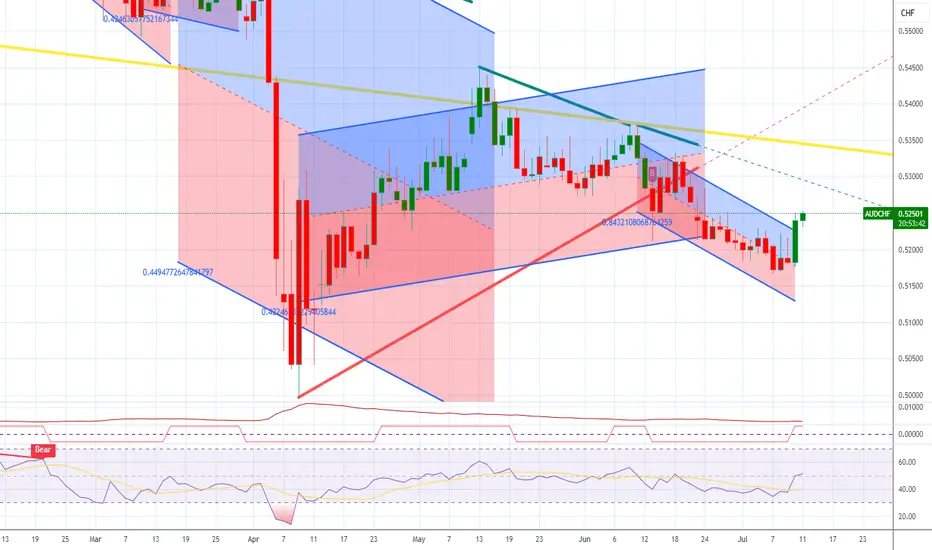
AUDCHF: Buy ideaBuy idea on AUDCHF as you can see on the chart because we have the breakout with force the vwap and the Belkhayate Iceberg and also the resistance line by the buyers.

AUDCHF Trade UpdateAUDCHF is sliding smooth — lower highs holding, candles picking up pace, volume staying calm but steady. Structure’s intact, momentum’s leaning down.
Looks like sellers are in control, no panic from buyers yet 🚪
I’m still in. Letting it breathe.
⚡
AUDCHF short from last week’s plan — trade doing its job.

Buy opportunity in descending pattern-Forex BDA descending channel pattern has formed in the AUDCHF H-4 market. The price is now moving downwards. It is expected that the price will move upwards from the trend line.
⭕️Risk Warning : Trading on financial markets carries risks!
©FXBD Official Team

Upward move is waiting from support level - Forex BDAUDCHF is near the price support level on the H-4 timeframe and the price is likely to pull back from this level and enter an uptrend.
©FXBD Official Team

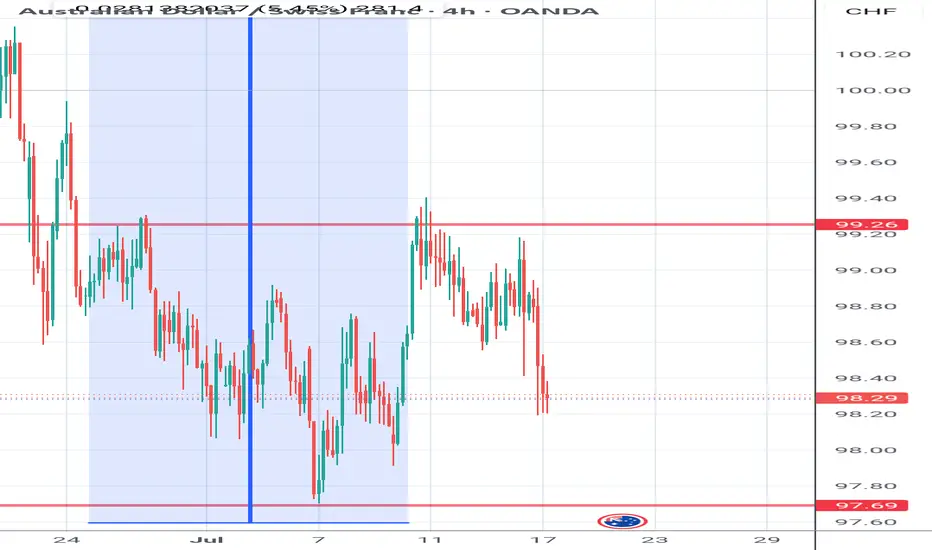
AUDCHF AUDCHF is preparing to break through support and fallWeak market structure. Gradually declining lows and no reaction to support at 0.5211. Buyers are trying to keep the price above 0.5211, but under market pressure their strength is weakening.
Relative to 0.5211, we see the formation of consolidation, which is of a “pre-breakdown” nature.
Accordingly, a break below the 0.5211 support level could trigger the activation of buyers' SL orders, leading to liquidation and a downward price distribution.
Potential targets include 0.518 and 0.5164.


AUD_CHF BEARISH BREAKOUT|SHORT|
✅AUD_CHF is going down currently
As the pair broke the key structure level of 0.5240
Which is now a resistance, and after the pullback
And retest, I think the price will go further down
SHORT🔥
✅Like and subscribe to never miss a new idea!✅
Disclosure: I am part of Trade Nation's Influencer program and receive a monthly fee for using their TradingView charts in my analysis.

AUDCHF: Bullish Flag from PRZ — Rally to 0.54444?AUDCHF ( OANDA:AUDCHF ) bounced from the Potential Reversal Zone (PRZ) , which aligns with the Yearly Support(1) and the 50% Fibonacci level of the previous bullish impulse.
From a Classic Technical Analysis perspective , AUDCHF appears to be breaking out of a Bullish Flag Pattern , which may suggest the continuation of the previous uptrend .
This bullish reaction also confirms the importance of the Support zone(0.51166 CHF-0.49773 CHF) , where buyers stepped in aggressively.
In terms of Elliott Wave theory , it seems that AUDCHF has completed the bearish waves and we should wait for the bullish waves .
I expect AUDCHF to continue rising after a successful breakout from the flag’s upper boundary . If momentum sustains, the target could be around 0.54444 CHF .
Note: Stop Loss (SL) = 0.51972 CHF
Australian Dollar/ Swiss Franc Analyze (4-hour time frame).
Be sure to follow the updated ideas.
Do not forget to put a Stop loss for your positions (For every position you want to open).
Please follow your strategy; this is just my idea, and I will gladly see your ideas in this post.
Please do not forget the ✅ ' like ' ✅ button 🙏😊 & Share it with your friends; thanks, and Trade safe.
