AUDCHFAUDCHF changed its Character created Liquidity with a Head n Shoulder Pattern below heading to the Supply Zone.
CHFAUD trade ideas

Bullish rise?AUD/CHF has reacted off the pivot which has been identified as a pullback support and could rise to the 1st resistance.
Pivot: 0.5735
1st Support: 0.57223
1st Resistance: 0.57786
Risk Warning:
Trading Forex and CFDs carries a high level of risk to your capital and you should only trade with money you can afford to lose. Trading Forex and CFDs may not be suitable for all investors, so please ensure that you fully understand the risks involved and seek independent advice if necessary.
Disclaimer:
The above opinions given constitute general market commentary, and do not constitute the opinion or advice of IC Markets or any form of personal or investment advice.
Any opinions, news, research, analyses, prices, other information, or links to third-party sites contained on this website are provided on an "as-is" basis, are intended only to be informative, is not an advice nor a recommendation, nor research, or a record of our trading prices, or an offer of, or solicitation for a transaction in any financial instrument and thus should not be treated as such. The information provided does not involve any specific investment objectives, financial situation and needs of any specific person who may receive it. Please be aware, that past performance is not a reliable indicator of future performance and/or results. Past Performance or Forward-looking scenarios based upon the reasonable beliefs of the third-party provider are not a guarantee of future performance. Actual results may differ materially from those anticipated in forward-looking or past performance statements. IC Markets makes no representation or warranty and assumes no liability as to the accuracy or completeness of the information provided, nor any loss arising from any investment based on a recommendation, forecast or any information supplied by any third-party.

Buy audchfMore buy expected wait for some.down side then enter into buy again
Just remember our target

AUD/CHF Swing long position.Weekly TF, Bulls rejected to bring the price down. And it also failed to sweep the PDL.
On weekly chart there is also a FVG. I think price will mitigate the FVG, But be aware of Strong SnR (red flag).
On 15m to 1H TF, You will see a market shift structure.
My entry is the pullback in FVG. I also use the fib, the FVG is in the zone of Fib discount.

AUDCHF - DOUBLE BOTTOMHello Traders !
The AUDCHF failed to create a new lower low !
The price formed a double bottom.
Currently, The neckline is broken !
So, I expect a bullish move🚀
______________
TARGET: 0.57960🎯

What if"If the price rises to the green zone, I expect the trend to reverse because it is a seller's zone in the QM area. It will likely drop to the second QM area, which is the buyer's zone, before moving up slightly and choosing its next direction."

Bearish reversal?AUD/CHF is rising towards the resistance level which is a pullback resistance that lines up with the 61.8% Fibonacci retracement and could reverse from this level to our take profit.
Entry: 0.58172
Why we like it:
There is a pullback resistance level that lines up with the 61.8% Fibonacci retracement.
Stop loss: 0.58981
Why we like it:
There is a pullback resistance level that is slightly below the 78.6% Fibonacci retracement.
Take profit: 0.56944
Why we like it:
There is a pullback support level .
Please be advised that the information presented on TradingView is provided to Vantage (‘Vantage Global Limited’, ‘we’) by a third-party provider (‘Everest Fortune Group’). Please be reminded that you are solely responsible for the trading decisions on your account. There is a very high degree of risk involved in trading. Any information and/or content is intended entirely for research, educational and informational purposes only and does not constitute investment or consultation advice or investment strategy. The information is not tailored to the investment needs of any specific person and therefore does not involve a consideration of any of the investment objectives, financial situation or needs of any viewer that may receive it. Kindly also note that past performance is not a reliable indicator of future results. Actual results may differ materially from those anticipated in forward-looking or past performance statements. We assume no liability as to the accuracy or completeness of any of the information and/or content provided herein and the Company cannot be held responsible for any omission, mistake nor for any loss or damage including without limitation to any loss of profit which may arise from reliance on any information supplied by Everest Fortune Group.

what if"If the price breaks through the green zone, which acts as a liquidity area (OB), I expect it to rise. The green zone will then turn into a support, and the price is likely to move towards the inefficiency zone to restore market balance."

AUDCHF SHORTI am taking shorts on AUDCHF.
The weekly timeframe is bearish and the pullback on the weekly seems to be ending and starting to reverse to the downside.
And this can be clearly seen on the daily timeframe below.
And the 12hr timeframe bellow:

Potential bullish rise?AUD/CHF is reacting off the support level which is a pullback support that aligns with the 23.6% Fibonacci retracement and could rise from this level to our take profit.
Entry: 0.56953
Why we like it:
There is a pullback support level which aligns with the 23.6% Fibonacci retracement.
Stop loss: 0.56538
Why we like it:
There is a pullback support level which is slightly above the 38.2% Fibonacci retracement.
Take profit: 0.58174
Why we like it:
There is a pullback resistance level.
Please be advised that the information presented on TradingView is provided to Vantage (‘Vantage Global Limited’, ‘we’) by a third-party provider (‘Everest Fortune Group’). Please be reminded that you are solely responsible for the trading decisions on your account. There is a very high degree of risk involved in trading. Any information and/or content is intended entirely for research, educational and informational purposes only and does not constitute investment or consultation advice or investment strategy. The information is not tailored to the investment needs of any specific person and therefore does not involve a consideration of any of the investment objectives, financial situation or needs of any viewer that may receive it. Kindly also note that past performance is not a reliable indicator of future results. Actual results may differ materially from those anticipated in forward-looking or past performance statements. We assume no liability as to the accuracy or completeness of any of the information and/or content provided herein and the Company cannot be held responsible for any omission, mistake nor for any loss or damage including without limitation to any loss of profit which may arise from reliance on any information supplied by Everest Fortune Group.

AUDCHF LONG As usual, check high time frame for Zone of interest, then I scroll down to H1 for liquidity sweep. The most important thing is not liquidity sweep, it’s finding a zone of interest.
I don’t use liquidity in finding my zone of interest; liquidity only helps me in finding suitable entry and minimal stop loss and also it helps to know when there is high volume

AUD/CHF Bearish Continuation with Triangle PatternThe AUD/CHF 15-minute chart reveals a potential pullback within a descending triangle pattern. The price action suggests that after the current pullback, the pair may continue its bearish trend, with the target set at the 0.57100 level.
The descending triangle pattern indicates a consolidation phase, which often precedes a continuation of the prevailing trend. In this case, the bearish momentum is expected to resume, aiming for the identified target. Traders should monitor this pattern closely for any signs of breakout or further downside movement.
Disclaimer: This analysis is provided for educational purposes only and should not be construed as financial advice. Trading involves significant risk, and it's important to conduct your own research before making any trading decisions.

Potential bulllish bounce?AUD/CHF is falling towards the pivot and could potentially bounce to the 1st resistance which acts as a pullback resistance.
Pivot: 0.56955
1st Support: 0.55933
1st Resistance: 0.58147
Risk Warning:
Trading Forex and CFDs carries a high level of risk to your capital and you should only trade with money you can afford to lose. Trading Forex and CFDs may not be suitable for all investors, so please ensure that you fully understand the risks involved and seek independent advice if necessary.
Disclaimer:
The above opinions given constitute general market commentary, and do not constitute the opinion or advice of IC Markets or any form of personal or investment advice.
Any opinions, news, research, analyses, prices, other information, or links to third-party sites contained on this website are provided on an "as-is" basis, are intended only to be informative, is not an advice nor a recommendation, nor research, or a record of our trading prices, or an offer of, or solicitation for a transaction in any financial instrument and thus should not be treated as such. The information provided does not involve any specific investment objectives, financial situation and needs of any specific person who may receive it. Please be aware, that past performance is not a reliable indicator of future performance and/or results. Past Performance or Forward-looking scenarios based upon the reasonable beliefs of the third-party provider are not a guarantee of future performance. Actual results may differ materially from those anticipated in forward-looking or past performance statements. IC Markets makes no representation or warranty and assumes no liability as to the accuracy or completeness of the information provided, nor any loss arising from any investment based on a recommendation, forecast or any information supplied by any third-party.

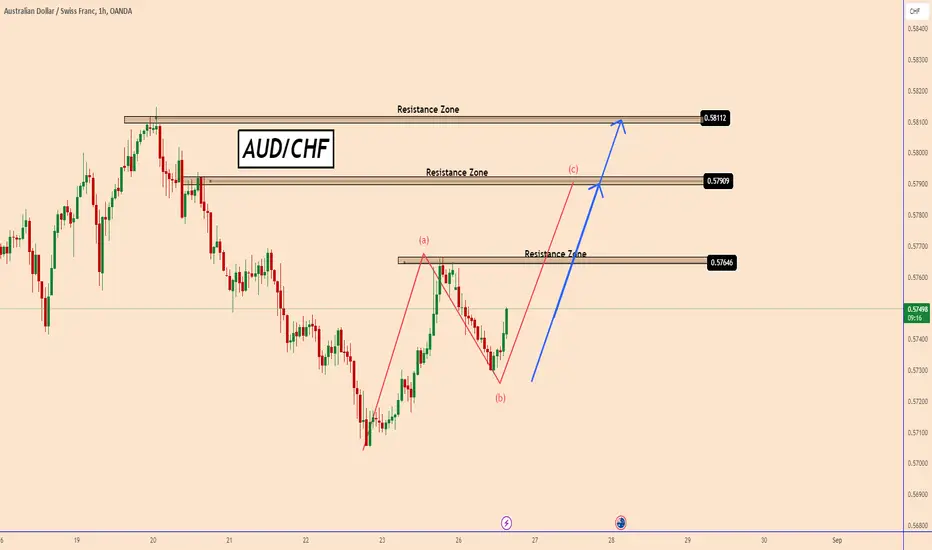
AUDCHF: ABC Price DevelopmentAUDCHF: ABC Price Development
On the 60 min chart near 0.5705 the price began with the leg of the A wave and it was completed near 0.5765.
During these days the price completed the B corrective wave and it is likely that the price already began the C that may reach 0.5790 but it may also extend up to the top of the structure near 0.5800
You may find more details in the chart!
Thank you and Good Luck!
❤️PS: Please support with a like or comment if you find this analysis useful for your trading day❤️
AUDCHFThis Weekly FORECAST
Opportunity for AUDCHF. This setup is my trading idea/plan, if you want to follow: trade at your own risk (TAYOR).
Risk Factors:
1. Market conditions, unexpected news, or external events could impact the trade.
2. Always use risk management strategies to protect your capital.

Bullish momentum to extend?AUD/CHF is falling towards the support level which is a pullback support that is slightly below the 23.6% Fibonacci retracement and could bounce from this level to our take profit.
Entry: 0.56953
Why we like it:
There is a pullback support level which is slightly below the 23.6% Fibonacci retracement.
Stop loss: 0.55872
Why we like it:
There is an overlap support level which lines up with the 50% Fibonacci retracement.
Take profit: 0.58174
Why we like it:
There is a pullback resistance level.
Please be advised that the information presented on TradingView is provided to Vantage (‘Vantage Global Limited’, ‘we’) by a third-party provider (‘Everest Fortune Group’). Please be reminded that you are solely responsible for the trading decisions on your account. There is a very high degree of risk involved in trading. Any information and/or content is intended entirely for research, educational and informational purposes only and does not constitute investment or consultation advice or investment strategy. The information is not tailored to the investment needs of any specific person and therefore does not involve a consideration of any of the investment objectives, financial situation or needs of any viewer that may receive it. Kindly also note that past performance is not a reliable indicator of future results. Actual results may differ materially from those anticipated in forward-looking or past performance statements. We assume no liability as to the accuracy or completeness of any of the information and/or content provided herein and the Company cannot be held responsible for any omission, mistake nor for any loss or damage including without limitation to any loss of profit which may arise from reliance on any information supplied by Everest Fortune Group.

AUDCHF Short trade EntryMarket as been on downtrend coming from the weekly timeframe.
On same weekly market forms a double top, broke the neckline and also breaking the previous support, then we got a pull back to a supply zone on daily time frame at 0.382 fib level.
Market was rejected with a daily bearish engulfing candle, and closed with a doji on weekly time frame.
On 4hr market broke a counter trendline now there is a pull back which is a good way to enter the trade if you didnt enter with the bearish engulfing candle.
Like always WAIT FOR A BEARISH CANDLE STICK PARTTERN

AUD/CHF Swing Long PositionMarket creating HHs and HLs.
Also failed to close at PDL.
Respected the trend line.
I anticipate the market to continue go up.
Wait for pullback and to enter.
I also use the Fib on daily TF, placed it from swing high to swing low. After the price touched the 61.8, it pulled back to 50%. (A buy opportunity.)
You can see on Daily TF, the imbalances happened. The market is slowly closing those imbalances.

AUD-----CHF___short over all trend is bearish and trend is take retracement now came to fib 0.6 level its shows some reversal

AUDCHF A Fall Expected! SELL!
My dear friends,
Please, find my technical outlook for AUDCHF below:
The price is coiling around a solid key level - 0.5741
Bias - Bearish
Technical Indicators: Pivot Points Low anticipates a potential price reversal.
Super trend shows a clear sell, giving a perfect indicators' convergence.
Goal - 0.5723
About Used Indicators:
The pivot point itself is simply the average of the high, low and closing prices from the previous trading day.
———————————
WISH YOU ALL LUCK

Trade idea - AUDCHF Long4H
Corrective approach towards entry zone.
-27 Fibonacci completion aligning with entry zone.
= Instant market execution Buy.
1% risk.
Aiming to take full profit at Daily TP.

AUDCHF making a double top at Resistance areaAUDCHF has successfully broken out of the range zone and formed a double top at the resistance level. On the daily timeframe, the market is clearly in a bearish trend, having retraced around 50%. The price is now heading toward the support level and could continue lower, potentially breaking through the upward channel on the 1H timeframe. A further decline is possible, with at least a retest of last week's high. The target is the support level at 0.57130.

Bullish bounce?AUD/CHF is falling towards the pivot which has been identified as a pullback support and could rise from this level to the 1st resistance which acts as a pullback resistance.
Pivot: 0.56955
1st Support: 0.55933
1st Resistance: 0.58147
Risk Warning:
Trading Forex and CFDs carries a high level of risk to your capital and you should only trade with money you can afford to lose. Trading Forex and CFDs may not be suitable for all investors, so please ensure that you fully understand the risks involved and seek independent advice if necessary.
Disclaimer:
The above opinions given constitute general market commentary, and do not constitute the opinion or advice of IC Markets or any form of personal or investment advice.
Any opinions, news, research, analyses, prices, other information, or links to third-party sites contained on this website are provided on an "as-is" basis, are intended only to be informative, is not an advice nor a recommendation, nor research, or a record of our trading prices, or an offer of, or solicitation for a transaction in any financial instrument and thus should not be treated as such. The information provided does not involve any specific investment objectives, financial situation and needs of any specific person who may receive it. Please be aware, that past performance is not a reliable indicator of future performance and/or results. Past Performance or Forward-looking scenarios based upon the reasonable beliefs of the third-party provider are not a guarantee of future performance. Actual results may differ materially from those anticipated in forward-looking or past performance statements. IC Markets makes no representation or warranty and assumes no liability as to the accuracy or completeness of the information provided, nor any loss arising from any investment based on a recommendation, forecast or any information supplied by any third-party.
