AUDCHF - Wait For it!Hello TradingView Family / Fellow Traders. This is Richard, also known as theSignalyst.
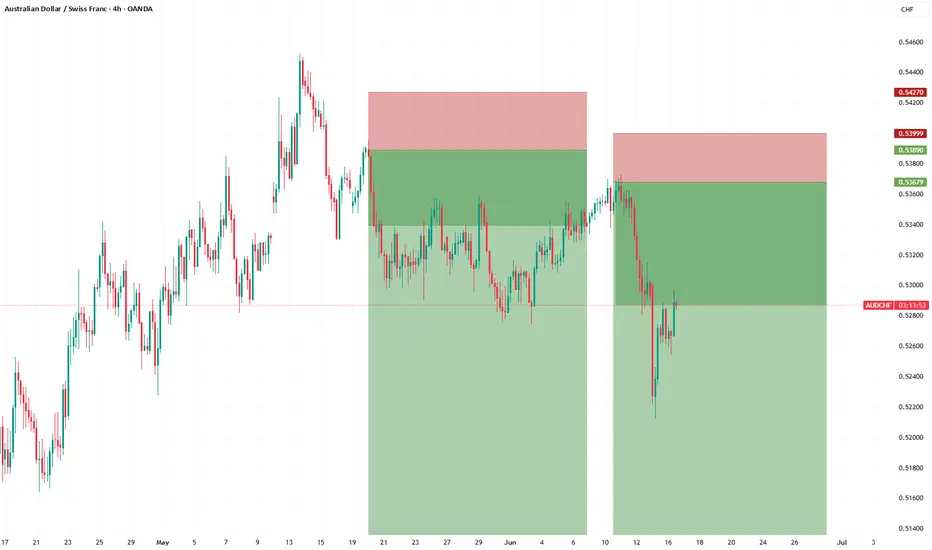
📈AUDCHF has been overall bearish trading within the flat falling broadening wedge pattern marked in red.
Moreover, the green zone is a supply.
🏹 Thus, the highlighted red circle is a strong area to look for sell setups as it is the intersection of the upper red trendline and supply.
📚 As per my trading style:
As #AUDCHF approaches the red circle zone, I will be looking for bearish reversal setups (like a double top pattern, trendline break , and so on...)
📚 Always follow your trading plan regarding entry, risk management, and trade management.
Good luck!
All Strategies Are Good; If Managed Properly!
~Rich
Disclosure: I am part of Trade Nation's Influencer program and receive a monthly fee for using their TradingView charts in my analysis.
CHFAUD trade ideas

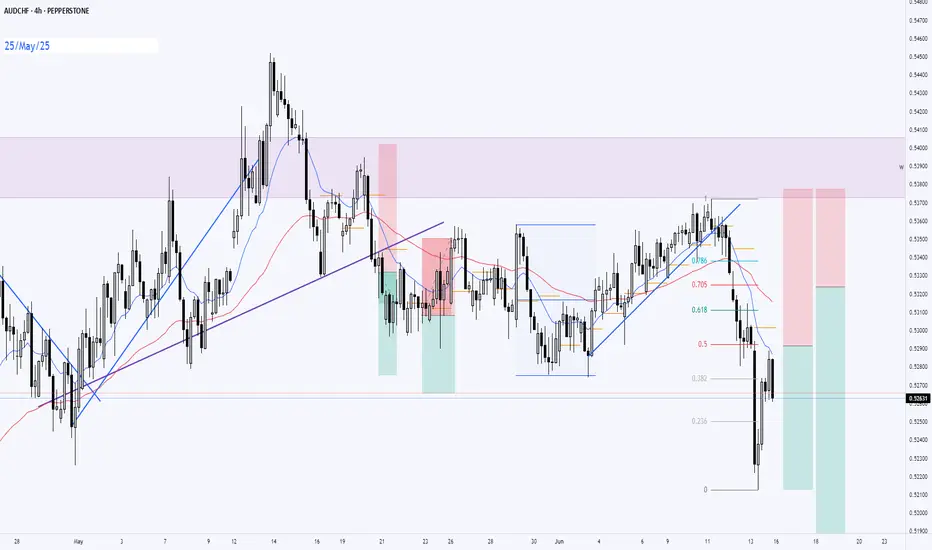
AUDCHF Bearish bias as M, W, D, 4H are bearish! Overall down trend on daily
current 4H up trend
4H trend line break
50 ema above price
Bearish engulfing candle breaking support level
For trade entry,
- wait for a pull back to the 50% Fib level
- look for bearish price action e.g price rejecting 50 ema

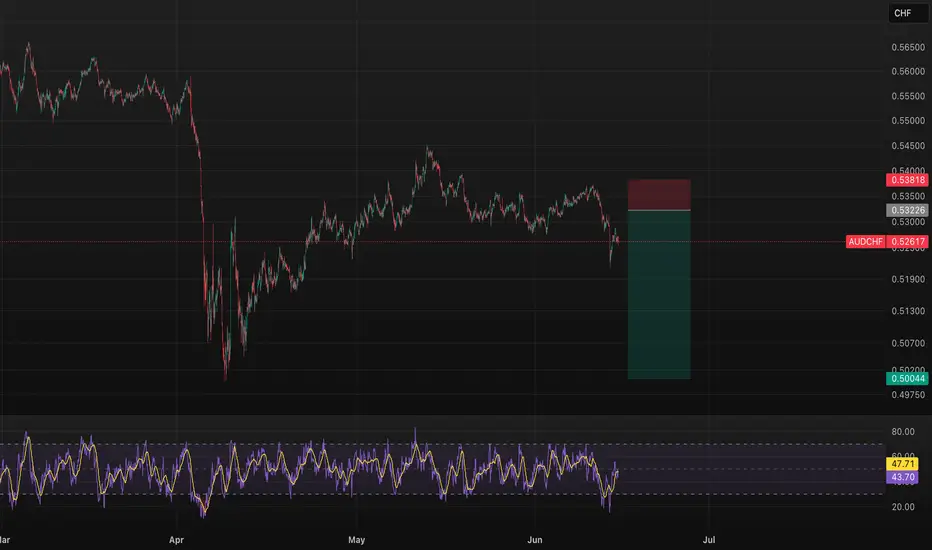
AUDCHF BEARISH SETUPAUDCHF looks like bearish setup.
Trend has been a bullish but at RSI is a formed bearish divergence.
And also reversal pattern rising wedge formed.
I took a trade with sell stop order after breaking a HL.
Manage your trade accordingly.


AUDCHFToday, after seeing the close of 4H candle above 4H SIBI FVG i change my bias to bullish
After engagement on 4H FVG i take my entry

AUD-CHF Bullish Bias! Buy!
Hello,Traders!
AUD-CHF is trading in an
Uptrend and the pair made
A bullish breakout of the
Key horizontal level of 0.5280
Which is now a support and
Went up sharply then made a
Retest of the new support level
And we are already seeing a
Bullish rebound so we are
Bullish biased and we wil
Be expecting a further
Bullish move up
Buy!
Comment and subscribe to help us grow!
Check out other forecasts below too!
Disclosure: I am part of Trade Nation's Influencer program and receive a monthly fee for using their TradingView charts in my analysis.

SWING SHORT AUDCHFon weekly price back to weekly OB and last weekly candl was bearish
On Daily price engage in Daily SIBI but failed to give as reaction and last day
Price take PCH as liquidity after no reaction from Daily FVG
Last day was respected candle to downsides > that lead me to bearish BIAS
so in 4H was my entry point from 4H FVG
My SL above SWING HIGH


AUDCHF BearishTechnically:
AUDCHF printed LL
AUDCHF retrace and printed LH
AUDCHF retrace from fib level 0.61 to 0.78
AUDCHF at resistance which is previous support.

AUDCHF Trend IdeaBearish Channel on the 4Hr timeframe, retracing to the AOI zone @0.5300, possible of testing the Fair Value Gap (liquidity grab) before it continue to the downtrend.
Let's see in the NY session what will happen!
Good Luck

AUDCHF: Pullback From Resistance 🇦🇺🇨🇭
There is a high chance that AUDCHF will retrace from a key daily resistance.
As a confirmation, I see a strong rejection on an hourly time frame.
Goal - 0.5267
❤️Please, support my work with like, thank you!❤️
I am part of Trade Nation's Influencer program and receive a monthly fee for using their TradingView charts in my analysis.

AUD/CHF SENDS CLEAR BEARISH SIGNALS|SHORT
AUD/CHF SIGNAL
Trade Direction: short
Entry Level: 0.528
Target Level: 0.525
Stop Loss: 0.530
RISK PROFILE
Risk level: medium
Suggested risk: 1%
Timeframe: 1h
Disclosure: I am part of Trade Nation's Influencer program and receive a monthly fee for using their TradingView charts in my analysis.
✅LIKE AND COMMENT MY IDEAS✅

AUD/CHF Sell Trade Idea 🧠 Why Sell AUD/CHF?
* **Australia (AUD)**:
* Economic growth is slowing.
* Consumer and business confidence are falling.
* The Reserve Bank may cut interest rates soon.
* Australia’s economy depends heavily on China and commodities — both are under pressure.
* **Switzerland (CHF)**:
* Safe-haven currency — gets stronger when the world is uncertain.
* Low inflation and strong exports make CHF attractive.
* Even though the Swiss central bank cut rates, demand for CHF remains high due to global risks.
---
### ⏳ **What to Watch For**
* RBA (Australia’s central bank) possibly cutting rates in August
* Weak data from China hurting AUD further
* Ongoing wars or trade issues making CHF stronger
---
AUD/CHF – Macro Sell Outlook Based on News & Calendar
This week, the macroeconomic calendar is notably quiet for both the Australian dollar and the Swiss franc, with no high-impact events scheduled for either currency. In such a news-light environment, currency markets tend to default to broader macro themes, risk sentiment, and the underlying characteristics of each currency.
The Swiss franc (CHF) is widely regarded as a classic safe-haven currency, attracting demand during periods of uncertainty or when global markets lack direction. Conversely, the Australian dollar (AUD) is considered a risk-sensitive, growth-oriented currency that often underperforms when there is little optimism or momentum in the global economy.
With China-related concerns still hanging over the Australian economy and no domestic news or catalysts expected to boost AUD this week, the backdrop remains unfavorable for the Australian dollar. The absence of positive drivers for AUD, combined with the CHF’s defensive nature, creates a natural bias in favor of the Swiss franc.
**In summary:**
For the week ahead, AUD/CHF is fundamentally skewed toward the downside. With no news-based reasons to buy AUD, and with CHF likely to benefit from a stable, risk-averse environment, the pair favors a sell (short) bias on macroeconomic and news calendar grounds.
AUD/CHF – Smart Money Swing Setup🔍 **AUD/CHF – Smart Money Swing Setup**
Price continues its bearish structure on H4, with lower highs and lower lows aligning with institutional order flow. M15 confirmed a bearish CHoCH and BOS with liquidity above equal highs, offering a clean Sell Limit opportunity.
We have identified a high-probability target near 0.51500 — a strong H4 demand zone aligned with previous lows and an unmitigated order block.
🎯 Risk-Reward ~1:5
No major macro news this week for AUD or CHF, providing a clean environment for price action to unfold. Wait for mitigation and confirmation before entry.

AUD/CHF:Bearish Momentum Strengthens with 3 Key Technical SignalThe AUD/CHF currency pair has recently displayed compelling bearish characteristics across both the daily and weekly timeframes, reinforcing the current downtrend and presenting a potential continuation opportunity for trend-following traders.
Technical Breakdown:
1. Daily Chart – Bearish "Falling Three Soldiers"
On the daily chart, AUD/CHF has formed a textbook "falling three soldiers" candlestick pattern. This formation consists of three consecutive bearish candles following a temporary bullish retracement, signaling strong selling pressure and a likely continuation of the prior downtrend. This pattern typically reflects increasing control by sellers and a lack of significant bullish response.
2. Weekly Chart – Bearish Engulfing Pattern
Zooming out to the weekly timeframe, the pair recently printed a bearish engulfing candle , a classic reversal signal. The bearish engulfing fully overshadows the prior bullish candle, signaling a strong shift in momentum in favor of the bears. When found at a swing high or resistance area, this pattern adds significant weight to a bearish bias.
3. Price Below 50 EMA and 200 EMA
Further confirmation comes from the moving average setup. AUD/CHF is currently trading below both the 50-day and 200-day exponential moving averages (EMAs) . This alignment reinforces the downtrend, with the 50 EMA acting as a dynamic resistance level. The gap between price and the EMAs suggests sustained bearish pressure and little sign of bullish recovery in the near term.
---
Market Sentiment and Outlook:
From a broader perspective, the Swiss Franc (CHF) often benefits from risk-off sentiment due to its status as a safe haven, while the Australian Dollar (AUD) is considered more risk-sensitive. With global risk sentiment facing headwinds from inflationary pressures, central bank uncertainty, and geopolitical tensions, AUD may remain under pressure against CHF.
Traders could look for pullbacks into resistance — such as the 50 EMA or previous support-turned-resistance levels — to consider short entries with confirmation , ideally supported by bearish candlestick patterns or momentum indicators.
---
Conclusion:
With multiple layers of bearish confluence — the falling three soldiers on the daily chart, the bearish engulfing pattern on the weekly, and price action firmly below the 50 and 200 EMAs — the technical bias for AUD/CHF remains strongly bearish . Until the pair reclaims key moving averages or prints a reversal structure, the path of least resistance continues to point downward.
---
Rocket boost this content to learn more.
Disclaimer:Trading is risky please use a simulation
trading account before you trade with real money.
Do not use margin.
Learn risk management and profit taking strategies.

AUD-CHF Pullback Ahead! Sell!
Hello,Traders!
AUD-CHF made a retest
Of the strong wide horizontal
Resistance around 0.5289
And we are already seeing a
Local pullback so we are
Locally bearish biased and
We will be expecting a
Further bearish move down
On Monday
Sell!
Comment and subscribe to help us grow!
Check out other forecasts below too!
Disclosure: I am part of Trade Nation's Influencer program and receive a monthly fee for using their TradingView charts in my analysis.

AUDCHF Sell Opportunity - Structure Broken, Bears in Control📉 Overview from Weekly Time Frame
AUDCHF has been held under the 14EMA and a significant weekly resistance zone for multiple weeks, mirroring the bearish control seen in NZDCHF. Sellers have maintained dominance without a successful bullish close above the EMA, reinforcing a bearish long-term bias.
📆 Daily Chart Explanation
The daily timeframe shows a clear internal structure break to the downside. Price has decisively dropped below both the 14EMA and 50EMA, confirming bearish momentum and trend shift. This setup adds confidence to look for sell continuation setups.
⏱ 4H Chart Explanation
4H chart aligns with the higher timeframes. A bearish trendline has been broken and structure has shifted lower, with price making lower highs and lower lows. Momentum is clearly favoring sellers, especially after the EMA50 breakdown.
🧭 Plan
Bias: Bearish
Entry: Wait for price to pull back into the discounted zone near broken structure or EMA confluence on 4H, with bearish confirmation
Targets:
• TP1 – Recent low
• TP2 – Next key support level on daily timeframe
Invalidation: A break and close above the 4H structure high or 50EMA would invalidate the setup


AUDCHF Will Go Down! Short!
Take a look at our analysis for AUDCHF.
Time Frame: 15m
Current Trend: Bearish
Sentiment: Overbought (based on 7-period RSI)
Forecast: Bearish
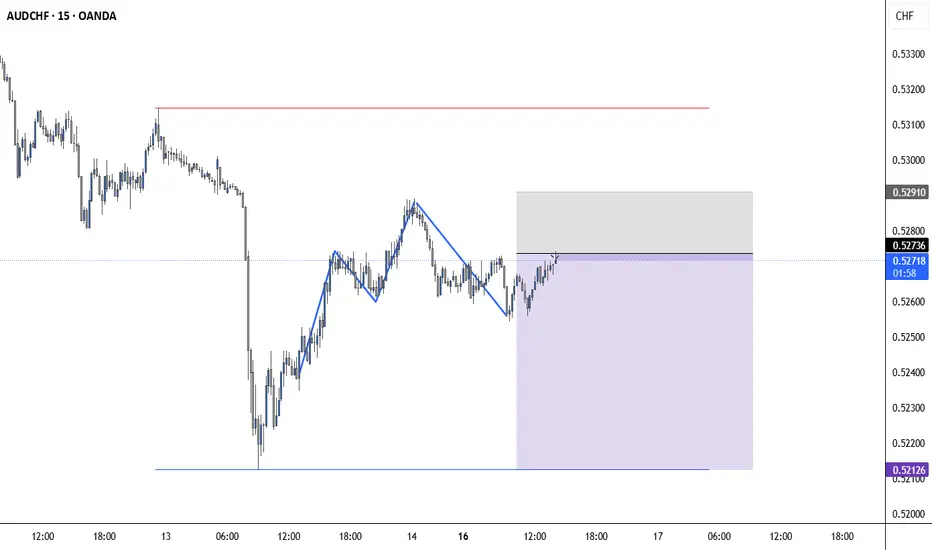
The market is testing a major horizontal structure 0.526.
Taking into consideration the structure & trend analysis, I believe that the market will reach 0.524 level soon.
P.S
Overbought describes a period of time where there has been a significant and consistent upward move in price over a period of time without much pullback.
Disclosure: I am part of Trade Nation's Influencer program and receive a monthly fee for using their TradingView charts in my analysis.
Like and subscribe and comment my ideas if you enjoy them!

AUD_CHF LOCAL SHORT|
✅AUD_CHF has retested a resistance level of 0.5290
And we are seeing a bearish reaction
With the price going down but we need
To wait for a confirmation
Before entering the trade, so that we
Get a higher success probability of the trade
SHORT🔥
✅Like and subscribe to never miss a new idea!✅
Disclosure: I am part of Trade Nation's Influencer program and receive a monthly fee for using their TradingView charts in my analysis.
