AUD-CHF Free Signal! Buy!
Hello,Traders!
AUD-CHF fell down sharply
But the pair will soon hit a
Horizontal support level
Of 0.5281 from where we
Can go long with the
Take Profit of 0.5312
And the Stop Loss of 0.5273
Buy!
Comment and subscribe to help us grow!
Check out other forecasts below too!
Disclosure: I am part of Trade Nation's Influencer program and receive a monthly fee for using their TradingView charts in my analysis.
CHFAUD trade ideas

AUD/CHF | Potential Downward Movement
💡 Sell Market Order @ 0.53495
🎯 Target Profit 0.52733
🛑 Stop Loss 0.53728
❌ Do not risk more than 1% of your account on each trade
Description:
Price has reacted to a 4 Hr FVG after a liquidity sweep of a major swing high. The price is moving lower now after testing a bearish order block. We are expecting a continuation to the downside toward the relative equal lows at 0.52733 mark.
-------------------------------------------------------------------------------------
Please press “Like” if you appreciate the trading idea 👍
“Follow” for more trading ideas in the future 👀
“Comment” below to share your thoughts with us and other traders 👥
-------------------------------------------------------------------------------------
Risk Disclaimer: All trading ideas published by “PriceActionDesk” are for educational purposes only. These posts can help you to enhance your trading skills, but please do your own research before opening any trading position. ⚠️
-------------------------------------------------------------------------------------
🙂 Good Luck!

AUDCHF The Target Is UP! BUY!
My dear friends,
Please, find my technical outlook for AUDCHF below:
The price is coiling around a solid key level - 0.5349
Bias - Bullish
Technical Indicators: Pivot Points Low anticipates a potential price reversal.
Super trend shows a clear buy, giving a perfect indicators' convergence.
Goal - 0.5357
About Used Indicators:
The pivot point itself is simply the average of the high, low and closing prices from the previous trading day.
Disclosure: I am part of Trade Nation's Influencer program and receive a monthly fee for using their TradingView charts in my analysis.
———————————
WISH YOU ALL LUCK

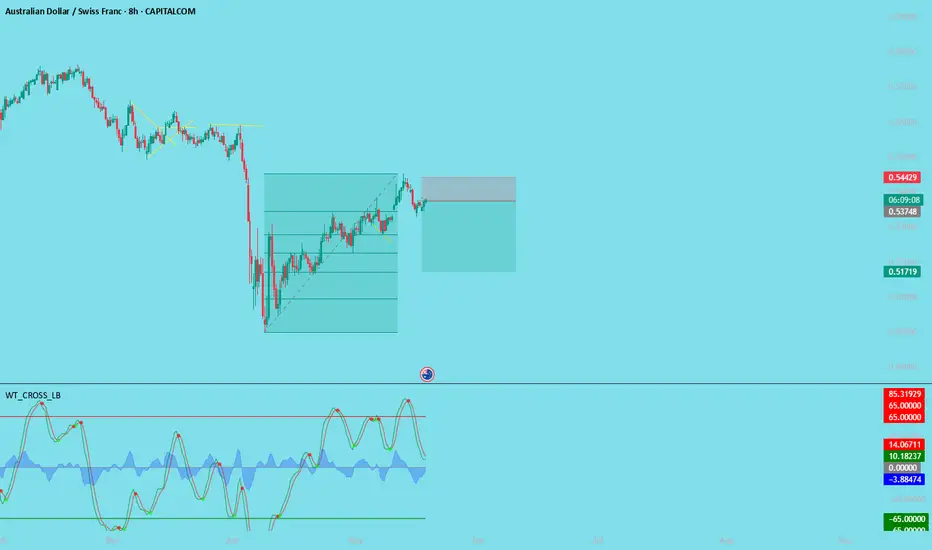
SHORT AUD CHF Investment OpportunityDear traders, I am Andrea Russo, a Forex expert and market analyst. Today I want to share with you a short opportunity on the AUDCHF pair, based on solid technical analysis and current market dynamics.
📌 Entry level: 0.5374 🎯 Take Profit (TP): 0.5173 🛑 Stop Loss (SL): 0.5440
The AUDCHF has shown signs of weakness after a consolidation phase. The bearish pressure, fueled by the strength of the Swiss franc and a climate of risk aversion, could favor a decline towards the indicated target levels.
Technical indicators confirm the strategy: 🔹 Key resistance near 0.5440, invalidation level of the position. 🔹 Bearish momentum with decreasing volumes on bullish pressures. 🔹 Short-term moving average suggesting a possible continuation of the decline.
📊 We will monitor the market to confirm the movement. Always remember to apply proper risk management!
AUD/CHF bearish correction formingHi Traders.
We see after the MTF Ascending channel breakout.
LTF Correctional Structures are forming.
Right now we see a LTF Ascending Channel.
Wait for a clear breakout and LTF Correction to enter this sell

AUDCHF: Growth & Bullish Forecast
Balance of buyers and sellers on the AUDCHF pair, that is best felt when all the timeframes are analyzed properly is shifting in favor of the buyers, therefore is it only natural that we go long on the pair.
Disclosure: I am part of Trade Nation's Influencer program and receive a monthly fee for using their TradingView charts in my analysis.
❤️ Please, support our work with like & comment! ❤️

AUDCHF: A FINE SELL TRADE AT CURRENT MARKET PRICEI'm shorting AUDCHF at the current Market price targeting the 0.52638 price level with my stops at 0.54007.

AUDCHF SHORT TP HITPosted days ago that the #audchf was going to melt as price was in the premium zone and we follow the over all trend which was bearish.. cheers to those who took it✅✅😎😎.

AUDCHFAUDCHF
This is my ORB strategy,
Been testing it out for a while and I like to think I do it different to others
All I’m waiting for is for price to come back to retest this area
And target lows of last week.
I still think I have more work to do with this but progressing really well.
Let me know what you think

AUDCHF: Completed Consolidation 🇦🇺🇨🇭
AUDCHF completed a consolidation within a horizontal range
on a daily, breaking and closing above its resistance.
I believe that the pair may rise more and reach a historically
significant falling trend line.
Goal - 0.5386
❤️Please, support my work with like, thank you!❤️
I am part of Trade Nation's Influencer program and receive a monthly fee for using their TradingView charts in my analysis.

AUDCHF SELL TRADE IDEAAfter price sweep liquidity on the 2hrs time frame and then broke structure to the downside. I will be looking at shorting #AUDCHF when price enters into 0.536090.

AUD/CHF BEARS ARE GAINING STRENGTH|SHORT
AUD/CHF SIGNAL
Trade Direction: short
Entry Level: 0.535
Target Level: 0.531
Stop Loss: 0.538
RISK PROFILE
Risk level: medium
Suggested risk: 1%
Timeframe: 6h
Disclosure: I am part of Trade Nation's Influencer program and receive a monthly fee for using their TradingView charts in my analysis.
✅LIKE AND COMMENT MY IDEAS✅

AUD-CHF Move Down Ahead! Sell!
Hello,Traders!
AUD-CHF made a retest of
The horizontal resistance
Of 0.5355 from where
We are already seeing a
Bearish pullback so we
Are locally bearish biased
And we will be expecting a
Further bearish move down
Sell!
Comment and subscribe to help us grow!
Check out other forecasts below too!
Disclosure: I am part of Trade Nation's Influencer program and receive a monthly fee for using their TradingView charts in my analysis.

AUDCHF short movePrice raised to our supply zone reacted bearish and hence i expect price to continue pushing downward.

AUD_CHF ELEGANT SHORT|
✅AUD_CHF went up to retest
A horizontal resistance level of 0.5358
Which makes me locally bearish biased
And I think that a move down
From the level is to be expected
Towards the target below at 0.5330
SHORT🔥
✅Like and subscribe to never miss a new idea!✅
Disclosure: I am part of Trade Nation's Influencer program and receive a monthly fee for using their TradingView charts in my analysis.

audchf bullish this based on the head and shoulder pattern. AUD projects a very strong week ahead so look for buy opyions

AUDCHFThe AUD/CHF pair is currently showing bearish tendencies despite Australia having higher interest rates than Switzerland due to several key factors beyond just the nominal interest rate differential:
1. Monetary Policy Outlook and Rate Expectations
The Reserve Bank of Australia (RBA) has recently cut rates with expectations of further cuts, signaling a dovish stance going forward. This diminishes the appeal of the AUD despite its current higher rates.
In contrast, the Swiss National Bank (SNB) has a very low policy rate (~0.25%) but is expected to keep rates on hold, providing stability to the CHF. The market perceives the SNB’s policy as more stable relative to the RBA’s easing path, which weighs on AUD/CHF.
2. Economic Fundamentals and Growth Prospects
Australia’s economy is facing headwinds such as slower GDP growth, weaker commodity demand, and cautious consumer sentiment, which dampens AUD strength.
Switzerland benefits from its safe-haven status and stable economic conditions, which attract investors during global uncertainty, supporting CHF demand.
3. Risk Sentiment and Safe-Haven Flows
The Swiss Franc is traditionally a safe-haven currency. In times of global risk aversion or geopolitical uncertainty, investors flock to CHF, pushing AUD/CHF lower even if Australia offers higher yields.
Current market sentiment is neutral to slightly bearish on AUD/CHF, with technical indicators showing limited momentum and a potential for bearish pressure.
4. Technical and Market Sentiment Factors
Technical analysis shows AUD/CHF trading in a narrow range with weak trend strength, limited volatility, and resistance near supplyroof . The RSI and MACD indicators suggest indecision but slight bearish momentum.
Market participants remain cautious, awaiting clearer economic data or policy signals before committing to AUD longs against CHF.
Summary Table
Factor Impact on AUD/CHF Explanation
RBA Rate Cuts & Dovish Outlook Bearish Expected further easing reduces AUD appeal
SNB Stable Policy Bullish for CHF Stability supports CHF demand
Economic Growth Weak for AUD Slower growth weighs on AUD
Safe-Haven Demand Supports CHF CHF strengthens in risk-off environments
Technical Indicators Neutral to Slightly Bearish Limited momentum, resistance near supplyroof
1. Current 10-Year Bond Yields
Australia 10-Year Bond Yield:
Approximately 4.34% to 4.53% as of early June 2025, with recent fluctuations around 4.3%–4.5% due to RBA rate cuts and global bond market moves.
Switzerland 10-Year Bond Yield:
Swiss 10-year government bond yields have been historically low or negative due to the Swiss National Bank’s (SNB) ultra-low or negative policy rates and safe-haven status. As of mid-2025, Swiss 10-year yields are near 0.5% or lower, often negative or close to zero given Switzerland’s monetary policy stance and low inflation environment (typical recent range: -0.3% to +0.5%, though exact current data not in search results but known from market context).
2. Interest Rate Differential
The 10-year bond yield differential (AUD – CHF) is roughly:
4.4%−0.5%≈+3.9%
This means Australian 10-year bonds offer a yield premium of nearly 4 percentage points over Swiss 10-year bonds.
3. Uncovered Interest Rate Parity (UIP)
UIP states that the expected change in the exchange rate equals the interest rate differential:3.9%i AUD −i CHF ≈3.9%.
Implication: The AUD should theoretically depreciate by about 3.9% annually against the CHF to offset the higher yield investors earn from holding AUD bonds. This means investors expect the AUD/CHF exchange rate to adjust so that the higher Australian yields do not translate into arbitrage profits without currency risk.
However, in practice, deviations from UIP occur due to risk premiums, capital controls, and market sentiment.
4. Carry Trade Advantage
The large positive yield differential makes the AUD attractive for carry trades against the CHF. Investors borrow in low-yielding CHF (funding currency) and invest in higher-yielding AUD assets to earn the interest rate spread.
Carry trade benefits:
Potentially higher returns from the interest rate spread (~3.9%)
AUD tends to be a commodity-linked currency with higher volatility and risk premium, which can amplify gains in risk-on environments.
Risks:
Currency risk if AUD depreciates sharply against CHF
Global risk-off events can trigger unwind of carry trades, causing AUD weakness
Summary Table
Metric Australia (AUD) Switzerland (CHF) Differential (AUD - CHF)
10-Year Government Bond Yield ~4.34% - 4.53% ~0.5% or lower +3.9%
Policy Rate 3.85% (RBA) ~0% or negative (SNB) ~3.85%
UIP Expected AUD Depreciation — — ~3.9% per annum
Carry Trade Advantage High yield, attractive Low yield, funding currency Significant carry trade incentive
The substantial yield advantage of Australian 10-year bonds over Swiss 10-year bonds (~3.9%) creates a strong carry trade incentive to buy AUD and fund in CHF. According to uncovered interest rate parity, this yield gap should be offset by an expected depreciation of the AUD versus CHF. However, in practice, carry trades persist due to risk appetite and market dynamics, making AUD/CHF sensitive to global risk sentiment and monetary policy shifts.
Conclusion
Despite Australia’s higher nominal interest rates, the bearish AUD/CHF trend is driven by the RBA’s dovish outlook, weaker Australian economic fundamentals, and the Swiss Franc’s safe-haven status. These factors outweigh the interest rate differential advantage, leading to AUD underperformance versus CHF in the current environment
#AUDCHF

Potential Long Opportunity on AUDCHFReasons I think this pair will rise:
- Confirmed trend line means harder potential breakout
- Price printed a higher low after reacting to the trend line which is a sign of momentum loss
What do you think?

AUDCHF Will Go Higher! Buy!
Here is our detailed technical review for AUDCHF.
Time Frame: 3h
Current Trend: Bullish
Sentiment: Oversold (based on 7-period RSI)
Forecast: Bullish
The market is approaching a significant support area 0.529.
The underlined horizontal cluster clearly indicates a highly probable bullish movement with target 0.532 level.
P.S
The term oversold refers to a condition where an asset has traded lower in price and has the potential for a price bounce.
Overbought refers to market scenarios where the instrument is traded considerably higher than its fair value. Overvaluation is caused by market sentiments when there is positive news.
Disclosure: I am part of Trade Nation's Influencer program and receive a monthly fee for using their TradingView charts in my analysis.
Like and subscribe and comment my ideas if you enjoy them!

AUD/CHF💰Symbol: { AUD/CHF }
🟩Price: { 0.53105 }
🟥Stop: { 0.52943 }
1️⃣profit: { 0.53378 }
2️⃣profit: { 0.53574 }
📊Check your chart before entering.
🚨Check before use to make sure there is no important news.🚨

AUDCHF Short Setup – Peak Formation Reset IdentifiedIf we examine the peak formation high, we can clearly observe that three distinct levels of drop have already formed. These levels are especially visible on the H4 and H1 timeframes, confirming that a cycle has completed.
As we know, the market is primarily driven by liquidity and before any major reversal, the market tends to hunt stop-losses above or below significant highs or lows. For this reason, it's crucial to wait patiently for price to interact with the liquidity zone (typically just beyond the last swing high of the third level).
Only after this liquidity sweep should we look for a confirmed sell entry.
Execution Steps:
Wait for Price to Hit the Liquidity Zone
Let the market tap into the stop-loss cluster (marked zone). This is often a signal that smart money is ready to reverse direction.
Confirm the Sell Trigger
Look for a clean candle pattern, bearish engulfing candle, or another reliable entry trigger.
Exit at Full Cycle Completion
Hold the trade until the full cycle plays out to the downside.
All Btmm Pro Signals that will come after this are valid entries and good to go

AUDCHF → Hunting for liquidity. Fall from resistanceFX:AUDCHF is emerging from local consolidation and entering a distribution phase. Potentially, against the backdrop of a downtrend, the market may be interested in the liquidity zone at 0.5356
Globally, we have a strong downtrend and a countertrend correction that is facing pressure in the 0.545 zone. The decline is resuming, but at some point the market formed an EQH liquidity pool at 0.5356, which is most likely acting as a magnet pulling the price towards it...
Based on the technical situation, we can conclude that if the price continues to form a distribution towards the target, the market is quite capable of stopping the price and returning to the downtrend phase.
Resistance levels: 0.535, 0.5356
Support levels: 0.5327, 0.5314
Thus, a breakout of the resistance level of 0.5356 without the possibility of continuing growth and a return of the price below the resistance level with subsequent price consolidation in the sales zone (below 0.5356) may trigger a resumption of the downward trend.
Best regards, R. Lind

AUDCHF BULLISH OR BEARISH DETAILED ANALYSISAUDCHF is currently breaking out of a textbook falling wedge pattern on the 4H chart, signaling a potential shift in momentum from bearish to bullish. Price action has been consolidating within this structure for several weeks, creating lower highs and lower lows, but with clear bullish divergence beginning to show up in recent sessions. The breakout around the 0.53300 zone marks a significant technical confirmation that bulls are taking control, with eyes now on the 0.54400 target.
From a fundamental standpoint, the Australian dollar is gaining strength backed by hawkish sentiment from the RBA. Despite global uncertainties, the RBA’s firm stance on managing inflation is keeping the Aussie resilient. On the flip side, the Swiss franc has been showing signs of relative weakness due to softer inflation readings and safe-haven outflows as global risk sentiment improves. This macro backdrop is creating favorable conditions for AUDCHF to rally.
Technically, this breakout aligns with strong market structure and volume support, making this a high-conviction bullish setup. The breakout candle is closing above resistance with momentum, and as long as price holds above the 0.53250–0.53000 zone, bulls are likely to maintain control. With the falling wedge breakout and favorable risk-reward setup, the upside move toward 0.54400 looks increasingly probable.
This is a clean price action play with fundamental alignment. The breakout not only confirms the end of the previous downtrend, but also opens up space for a bullish wave to unfold. Momentum traders and swing traders will want to watch this closely as AUDCHF transitions from accumulation to a potential bullish expansion phase.
