CADCHF 4H short trade planThe plan is based on ERL to IRL. After sweeping the liquidity and taping into D Fvg the price retraced perfectly 70.5% and on its way to its purported target.
CHFCAD trade ideas

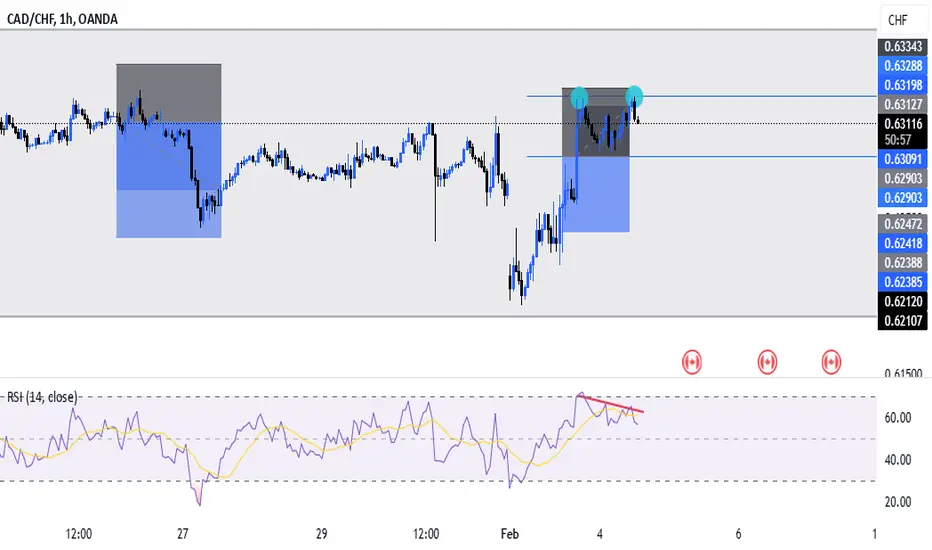
CADCHF Will Go Down! Short!
Please, check our technical outlook for CADCHF.
Time Frame: 1h
Current Trend: Bearish
Sentiment: Overbought (based on 7-period RSI)
Forecast: Bearish
The market is testing a major horizontal structure 0.631.
Taking into consideration the structure & trend analysis, I believe that the market will reach 0.627 level soon.
P.S
Overbought describes a period of time where there has been a significant and consistent upward move in price over a period of time without much pullback.
Like and subscribe and comment my ideas if you enjoy them!

cadchf new york trade idea set up form :
sweep sellside in 4h after 4h bisi failled to expande and run the sellside .i anticpate the price will bach to trade in the 4h bisi and it is my dol after makin a fva in 1h .
the only reason making me cancel this trade is price sweeping the 4h candle and make a displacment up.

CADCHF SHORT TERM REVERSALTechnically:
CADCHF printing double top.
CADCHF printing bullish divergence.
CADCHF "📉 CADCHF Trade: Missed Entry by Pips, Awaiting Re-Entry 🎯
Missed my initial entry on CADCHF by a few pips. Now patiently waiting for a re-entry opportunity at a favorable price point. Sticking to the plan and staying disciplined. Let's see how it unfolds. 🔄
#Forex #CADCHF #TradingPatience"
Sources

CADCHF: Intraday Bearish Movement 🇨🇦🇨🇭
CADCHF formed a liquidity grab after a test of a key intraday/daily
horizontal resistance.
A consequent bearish imbalance indicates a highly probable
bearish continuation lower.
Next support - 0.62855
❤️Please, support my work with like, thank you!❤️

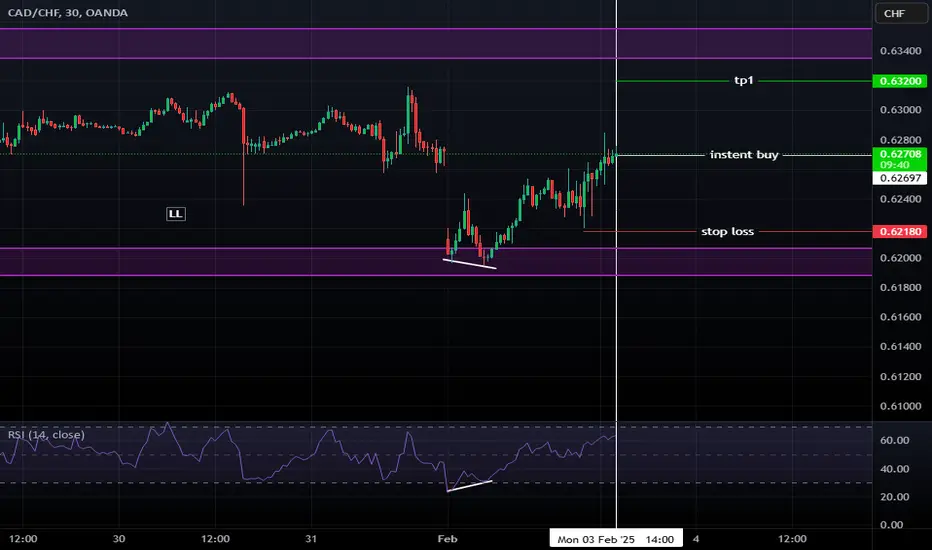
getting bulish accourding to my plantruning up from resistance and made clear diversion ON RSI and also making Higher High and Higher Lows, looks like its getting bulish

CAD-CHF Unexpected Gap! Buy!
Hello,Traders!
CAD-CHF made a sudden
Unexpected gap down at
The market open and the
Price has also reached a
Horizontal support level
Of 0.6185 from where
We will be expecting a
Bullish move up
Buy!
Comment and subscribe to help us grow!
Check out other forecasts below too!


CADCHF - 26 Jan 2025 SetupCADCHF Market structure are now creating first bearish run on H1 timeframe. and theres a chance to take a sell on spotted supply area today. ussually i used half risk for this kind of setups because its still bullish on higher timeframe like H2-H4.
Entry Position : Short
Profit Target : 1:3 Shown on the chart image (Green Line)
Stop Loss : Slightly above supply area (Red Line)
Follow me if u guys making any gains from this idea.
Thanks
Coffee Trade Team


CADCHF Pullback rejection towards the major trend.4H: Downside trend, with price rejected at 200 EMA;
1H: Countertrend, rejected at major trend’s trendline; Fib 61.8 rejection. VWAP rejection, OBV divergence, RSI OB;
15M: Rising wedge broken with volume.

Bearish drop off overlap resistance?CAD/CHF is reacting off the pivot and could drop to the 1st support which acts as a pullback support.
Pivot: 0.62938
1st Support: 0.62539
1st Resistance: 0.63319
Risk Warning:
Trading Forex and CFDs carries a high level of risk to your capital and you should only trade with money you can afford to lose. Trading Forex and CFDs may not be suitable for all investors, so please ensure that you fully understand the risks involved and seek independent advice if necessary.
Disclaimer:
The above opinions given constitute general market commentary, and do not constitute the opinion or advice of IC Markets or any form of personal or investment advice.
Any opinions, news, research, analyses, prices, other information, or links to third-party sites contained on this website are provided on an "as-is" basis, are intended only to be informative, is not an advice nor a recommendation, nor research, or a record of our trading prices, or an offer of, or solicitation for a transaction in any financial instrument and thus should not be treated as such. The information provided does not involve any specific investment objectives, financial situation and needs of any specific person who may receive it. Please be aware, that past performance is not a reliable indicator of future performance and/or results. Past Performance or Forward-looking scenarios based upon the reasonable beliefs of the third-party provider are not a guarantee of future performance. Actual results may differ materially from those anticipated in forward-looking or past performance statements. IC Markets makes no representation or warranty and assumes no liability as to the accuracy or completeness of the information provided, nor any loss arising from any investment based on a recommendation, forecast or any information supplied by any third-party.

Trends in trend The market will complete the curve whilst respecting the trend and the smaller trends are to confirm your entries during breakouts

FORECAST OVERNIGHT RATE FOR CAD LATERThis CAD FORECAST
Opportunity for CADCHF. This setup is my trading idea/plan, if you want to follow: trade at your own risk (TAYOR).
Risk Factors:
1. Market conditions, unexpected news, or external events could impact the trade.
2. Always use risk management strategies to protect your capital.

Bearish drop off pullback resistance?CAD/CHF has reacted off the pivot which has been identified as a pullback resistance and could drop to the 1st support.
Pivot: 0.62884
1st Support: 0.62445
1st Resistance: 0.63319
Risk Warning:
Trading Forex and CFDs carries a high level of risk to your capital and you should only trade with money you can afford to lose. Trading Forex and CFDs may not be suitable for all investors, so please ensure that you fully understand the risks involved and seek independent advice if necessary.
Disclaimer:
The above opinions given constitute general market commentary, and do not constitute the opinion or advice of IC Markets or any form of personal or investment advice.
Any opinions, news, research, analyses, prices, other information, or links to third-party sites contained on this website are provided on an "as-is" basis, are intended only to be informative, is not an advice nor a recommendation, nor research, or a record of our trading prices, or an offer of, or solicitation for a transaction in any financial instrument and thus should not be treated as such. The information provided does not involve any specific investment objectives, financial situation and needs of any specific person who may receive it. Please be aware, that past performance is not a reliable indicator of future performance and/or results. Past Performance or Forward-looking scenarios based upon the reasonable beliefs of the third-party provider are not a guarantee of future performance. Actual results may differ materially from those anticipated in forward-looking or past performance statements. IC Markets makes no representation or warranty and assumes no liability as to the accuracy or completeness of the information provided, nor any loss arising from any investment based on a recommendation, forecast or any information supplied by any third-party.

CADCHF LongI am looking for buying opportunities at key zone level. Comment what you think will happen

CADCHF Technical Analysis! BUY!
My dear followers,
This is my opinion on the CADCHF next move:
The asset is approaching an important pivot point 0.6248
Bias - Bullish
Safe Stop Loss - 0.6232
Technical Indicators: Supper Trend generates a clear long signal while Pivot Point HL is currently determining the overall Bullish trend of the market.
Goal -0.6284
About Used Indicators:
For more efficient signals, super-trend is used in combination with other indicators like Pivot Points.
———————————
WISH YOU ALL LUCK

CADCHF ShortBearish break of the market structure symbolizes bears still on the move to the downside. With prices ready for a retest before continuing.

CADCHF ALTERNATE BAT PATTERNHarmonic Pattern Trading Strategy:
1. Combine patterns with 2-3 confirmations (e.g., MA, BB, RSI, Stoch) for increased accuracy.
2. Implement proper risk management.
3. Limit exposure to 3% of capital per trade.
4. Exercise caution: Not every Harmonic Pattern presents a good trading opportunity.
5. Conduct thorough diligence and analysis before trading.
Disciplined approach = Enhanced edge.

CAD/CHF BEST PLACE TO BUY FROM|LONG
Hello, Friends!
CAD/CHF pair is trading in a local downtrend which we know by looking at the previous 1W candle which is red. On the 12H timeframe the pair is going down too. The pair is oversold because the price is close to the lower band of the BB indicator. So we are looking to buy the pair with the lower BB line acting as support. The next target is 0.636 area.
✅LIKE AND COMMENT MY IDEAS✅

CAD/CHF - Long: Market Order.Afternoon traders.
Im going long in a trade... let me break this down for you.
HTF all show bullish momentum, for more of a breakdown of this I have published a story on this Pair previously in the week.
LTF- We have made a few bounces of this HTF Mitigation Block, on smaller time frames price has made a few pushes off this Mitigation Block and on this particular pullback we can notice an Elliot's Wave "ABC" Pattern forming showing us the end of the consolidation phase. Im looking for price to break this Resistance zone as well as breaking this Liquidity Trend. Im targeting higher TF liquidity and I have my Stop Loss below the Higher TF Mitigation Block
Good Luck to all the Traders that decide to follow
