CAD/CHF BULLS WILL DOMINATE THE MARKET|LONG
Hello, Friends!
CAD/CHF downtrend evident from the last 1W red candle makes longs trades more risky, but the current set-up targeting 0.652 area still presents a good opportunity for us to buy the pair because the support line is nearby and the BB lower band is close which indicates the oversold state of the CAD/CHF pair.
✅LIKE AND COMMENT MY IDEAS✅
CHFCAD trade ideas

CAD/CHF BEARS ARE GAINING STRENGTH|SHORT
Hello,Friends!
We are now examining the CAD/CHF pair and we can see that the pair is going up locally while also being in a uptrend on the 1W TF. But there is also a powerful signal from the BB upper band being nearby, indicating that the pair is overbought so we can go short from the resistance line above and a target at 0.642 level.
✅LIKE AND COMMENT MY IDEAS✅

CADCHFThis pair has formed and Inverted CUP & HANDLE pattern.
In the context of a downtrend, it is continuation pattern.
To look at the projected target , consider the measured move.
Wait for confirmation of a downside break of the handle, before considering a short trade.

CADCHF MARKET CONDITION AHEAD OF BoC MONETARY POLICY REPORT!Price currently trade at 0.64608 level ahead of BoC monetary policy report coming up today by 2:30pm. A fall below 0.64354 could provide a buy opportunity at 0.63538

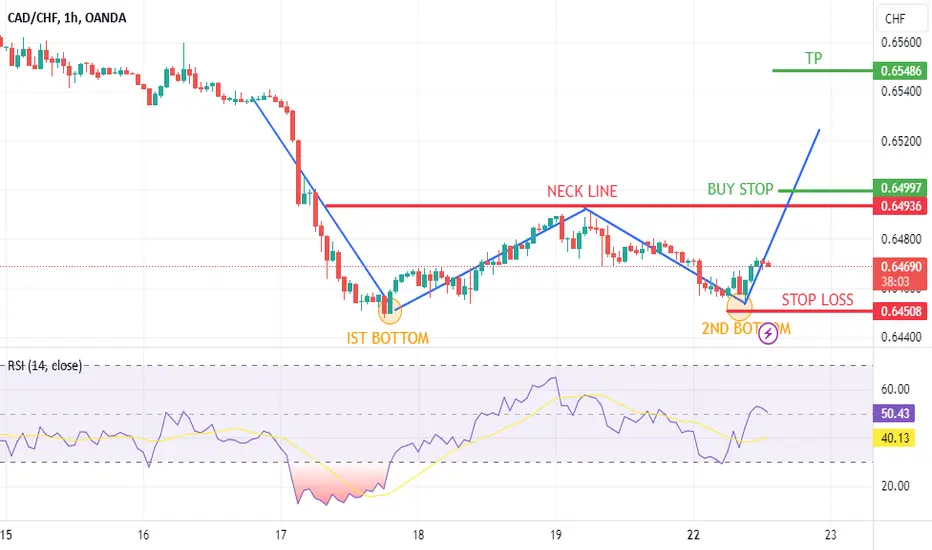
CADCHF DOUBLE BOOTOM REVERSAL PATTERNCADCHF was in downtrend on one hour time frame know the price has make double bottom pattern which is a reversal pattern buy stop order placed near neck line risk to reward ration is 1:1.
still sellDrawing the future path of this currency pair
The designated PRZ area is where I enter into buy

Trade idea - CADCHF Long4H
Bullish impulse / High: indication.
Bullish M pattern: confirmation.
Clear support & resistance zone is there.
Corrective approach towards entry zone.
-68 Fibonacci aligning with entry zone.
Ascending trend line is there.
= Buy limit.

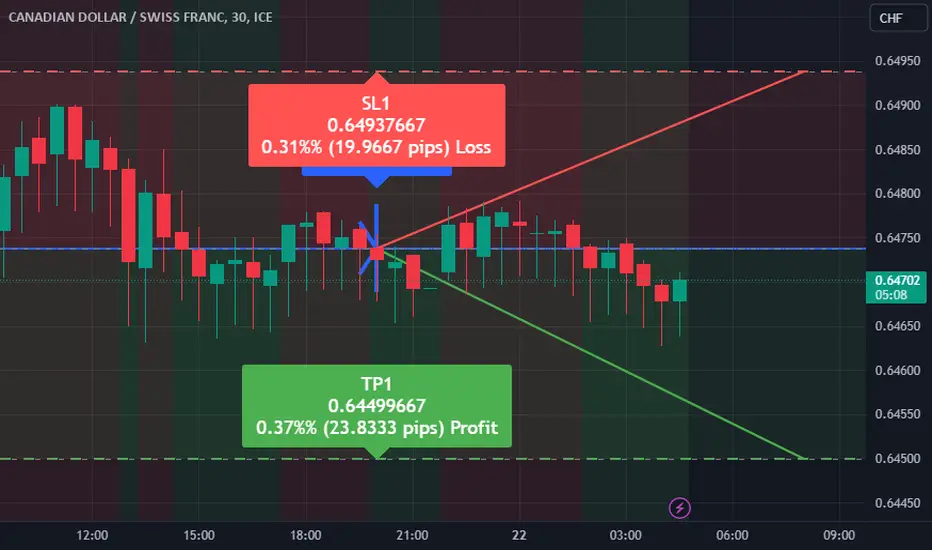
Trading Signal for CADCHF PairDirection: Sell
Enter Price: 0.64738
Take Profit: 0.64499667
Stop Loss: 0.64937667
Dear Traders,
We are issuing a Sell signal for the CADCHF currency pair based on our analysis using the EASY Quantum Ai strategy. Here are the specifics of the trade:
- Enter Price: 0.64738
- Take Profit: 0.64499667
- Stop Loss: 0.64937667
Our forecast indicates a likely downward movement for several reasons:
1. Technical Analysis: Recent technical indicators suggest that CADCHF is facing resistance around the 0.6490 level, indicating a potential reversal.
2. Trend Analysis: The pair has shown a downward trend over the past sessions, breaking through significant support levels.
3. Market Sentiment: Current market sentiment indicates a bearish outlook for CAD against CHF, primarily driven by weak economic data from Canada and a more stable Swiss economy.
4. Volume Analysis: Decreasing trading volumes in upward movements coupled with spikes in volumes during downward corrections indicate pressure from sellers.
This sell signal is expected to align with the market movement within the timeframe of the provided levels. Please ensure that you follow risk management practices while executing this trade.
Happy Trading!
Disclaimer: The above information is for educational purposes only and should not be taken as financial advice. Always conduct your own analysis before making any trading decisions.
CADCHFThis Weekly FORECAST
Opportunity for CADCHF. This setup trading idea is for intraday. >> TAYOR
Risk Factors:
1. Market conditions, unexpected news, or external events could impact the trade.
2. Always use risk management strategies to protect your capital.

Will CADCHF Reverse?The recent rejection at the previous support level suggests a potential price reversal.
TP: 0.65380 (+2)
SL: 0.64480 (30 pips)

buy on CADCHFwe have a bullish arche flag forming on the structure of the pair and a double bottom forming on resistance with smaller continuation patterns forming to confirm the upwards movement

CAD/CHF SENDS CLEAR BEARISH SIGNALS|SHORT
Hello, Friends!
We are going short on the CAD/CHF with the target of 0.645 level, because the pair is overbought and will soon hit the resistance line above. We deduced the overbought condition from the price being near to the upper BB band.However, we should use low risk here because the 1W TF is green and gives us a counter-signal.
✅LIKE AND COMMENT MY IDEAS✅

CADCHF POTENTIAL SHORT OPPORTUNITYHello Everyone!
How are you all?
CadChf is a pair to watch this week, because it is shaping up very nicely for a bearish trend continuation that we can capitalize on.
So, I will be looking for a bearish continuation because of the following reasons:
1. The trend is bearish.
2. The price has formed a continuation structure and it has approached the value area correctively.
3. There is a sell impulse out of the reversal structure
Game Plan:
If the price forms a 15mins flag with two highs and lows,
Entry : will look for a risk sell entry within the flag or a reduced risk entry on the breakout of the flag.

CADCHF Trade Alert: Buy SignalDear Traders,
We have identified a profitable trading opportunity for the CADCHF currency pair. Based on our analysis using the EASY Quantum Ai strategy, we recommend the following trade parameters:
Direction: Buy
Enter Price: 0.6474
Take Profit: 0.64882333
Stop Loss: 0.64494333
Rationale:
1. The Canadian Dollar (CAD) has shown signs of strengthening against the Swiss Franc (CHF) due to recent economic data releases indicating robust growth in Canada's economy.
2. Easy Quantum Ai strategy has detected a strong bullish signal on the technical charts, with key indicators such as RSI and MACD supporting a potential upward movement.
3. Market sentiment analysis reveals positive momentum for CAD backed by improved commodity prices, particularly oil, which correlates with the strength of the Canadian economy.
4. The Swiss Franc has been exhibiting weakness amid global risk-on sentiment, pushing investors to seek higher-yielding assets.
This setup provides a good risk-to-reward ratio, and our analysis suggests that the market is poised to hit the take profit target of 0.64882333 while controlling risk with a stop loss at 0.64494333.
Stay vigilant and happy trading!
Best Regards,

BUY CADCHFShort Buy on the CADCHF, Price has hit a strong resistance and also a "W" is forming. I believe price will hit the first TP For sure but there is also chance for the 2nd TP

CADCHFWe can attempt to buy CADCHF from specified levels as it making double bottom (reversal pattern) , also break LH , also bullish divergence occur indicate that it moves upward.
SL , TP mention in chart.

#2972024 | CADCHF Demand Zone 1:5CADCHF Demand Zone Appears in D1 Time Frame Looking Price Action for Long Term Buy
Risk and Reward Ratio is 1:5
After 50 pips Profit Set SL Entry Level
"DISCLAIMER" Trading & investing business is "Very Profitable" as well as risky, so any trading or investment decision should be made after Consultation with Certified & Regulated Investment Advisors, by Carefully Considering your Financial Situation.

CADCHF 4hrs ( Sell Trade Target range 90 PIP ) Pair Name : CAD/CHF
Time Frame : 4hrs Chart / Close
Scale Type : Large Scale
------
spreading knowledge among us and to clarify the most importan+t points of entry, exit and entry with more than 5 reasons
We seek to spread understanding rather than make money
Key Technical / Direction ( Long )
Type : Mid Term Swing
———————————
Bearish Break
0.65500
Reasons
- Major Turn level
- Visible Range Hvn
- Head & Shoulder
- Choch Area
- Day Low + week low
Bullish Reversal
0.64900 Area
Reasons
- Major Turn level / M
- Choch Zone
- Channel middle Band
- Quarter's High Area
- Fibo Golden Zone

CAD / CHF !! trendline - SELL NOW⭐️ Smart investment, Strong finance
⭐️ Personal comments NOVA:
Trendline H1 formed - there was not much important data at the beginning of the week. DOWN trend - bears prevail
⭐️ SET UP CAD/CHF PRICE:
🔥SELL zone: 0.65550 - 0.65750 SL 0.66000
TP1: 0.65200
TP2: 0.64900
TP3: 0.64600
⭐️ Technical analysis:
Based on technical indicators EMA 34, EMA89 and support resistance areas to set up a reasonable SELL order.
⭐️ NOTE:
Note: Nova wishes traders to manage their capital well
- take the number of lots that match your capital
- Takeprofit equal to 4-6% of capital account
- Stoplose equal to 2-3% of capital account
- The winner is the one who sticks with the market the longest

CADCHF - Bearish on 1 hrCADCHF is following bearish trend line on the 1 hr chart pattern, recently it made a huge spike upward also so this makes this trend line very legit. If the Price breaks the Low then there is high chance price is going down

CADCHFSEASONALITY:bearish till 23 July
SENTIMENTAL ; LONG/SHORT 66/34
FUNDAMENTAL: CHF STRONG THAN CAD
TECHICAL:
bullish harmonic
break of neck line
no bullish divergence
drilled equilibrium
bearish bias score 4
trade at your risk
good luck

CADCHF - Bullish Falling WedgeCADCHF is forming Bullish Falling Wedge, will it breakout to move further towards its target?
Entry, Stop Loss & Take Profit are mentioned.

Results Imbalance candle stick..this candle stick is strong enough to change the direction of the market. The one at the bottom will give us a direction on the next movement
