EURCHF - 4hrs ( Buy Trade Target Range 200 PIP ) ☑Pair Name : EUR/CHF
Time Frame : 4hrs Chart / Close
Scale Type : Large Scale
------
spreading knowledge among us and to clarify the most important points of entry, exit and entry with more than 5 reasons
We seek to spread understanding rather than make money
Key Technical / Direction ( Long )
Type : Mid Term Swing
———————————
✔️Bullish break
0.96150 Area
Reasons
- Major Turn level / D
- Pattern Target
- Visible Range Lvn
- Choch Zone
- Fixed Poc Area
- Day + week high Breka
✔️Bearish Reversal
0.98000area
Reasons
- Major Turn level
- Pattern Target
- Major Liquidity Zone
- MongHigh Area
- Quarter High Areas
- Fibo 161.8 %
CHFEUR trade ideas

eurchfHello traders
eurchf is now making a continues bullish structure . and already hit the below liquidity creating aretracement during aus session. now continui bullish for asean session to london session to us session, still look for bullish opportunity

BULLISH EURCHFSometimes you just have to look left. EURCHF Is here again testing one of its favorite historical price ranges (0.9695 - 0.9665). It's been used as a Weekly Supply & Demand Zone and I'm bullish and biased concerning this pair. Will you be longing this pair with us?
Like comment and follow for more ideas !!
Thank you!

EURCHF-Rising WedgeThe pair is making a rising wedge with bearish diveregence on RSI. Short position can be taken at CMP with SL at last HH

SELL EURCHFWe are at our latest LH,lots of sellers in this zone. Any break above invalidates our setup.
Goodluck
#1Boy

EURCHF Should Rise Again After ECB Rate DecisionEURCHF Should Rise Again After ECB Rate Decision
EURCHF may drop to 0.9680 ahead of ECB Rate Decision.
For this month, the market does not expect the ECB to cut rates again. Maybe they will keep the rates in this area for some time.
However, the market is expecting this at the moment, creating a weaker EURO.
Chances are that after the ECB meeting, we can see price increases again.
You may find more details in the chart!
Thank you and Good Luck!

EURCHF LongDaily Bias Bullish
Price broken out of H4 consolidation at Daily horizontal level.
Fundamental. EUR is slightly bullish and CHF is weakening.
Long trade set up at broken resistance level with SL below consoldiation. Targeting Daily Swing High R:R 1:3

7 Dimension Sell Setup for EURCHFCORE Analysis Method: Smart Money Concepts
😇 7 Dimension Analysis
Time Frame: H1
1️⃣ Swing Structure: Bearish with CHoCH
🟢 Structure Behavior: After a proper CHoCH, price reaches its extreme POI and previous high level, sweeping swing liquidity. Given the already bearish character, there is a high chance of further downside movement.
🟢 Internal Structure: Shows weakness with consolidation formation.
🟢 POI: Since liquidity is always swept at the extreme high, this is a high-probability sell area.
2️⃣ Pattern
🟢 CHART PATTERNS:
Reversal: Rounding Patterns, Double top.
🟢 CANDLE PATTERNS:
Momentum: BUY Side FOMO appeared, followed by strong bearish candles at this point.
3️⃣ Volume
🟢 Volume on Breakout: Indicates no significant volume on the bullish side; bears are more in control at this point.
🟢 Volume: Increases whenever bearish candles are observed.
4️⃣ Momentum RSI
🟢 Range Shift: From bullish to sideways, with a preceding divergence and a loud move indicating loss of momentum.
5️⃣ Volatility Bollinger Bands
🟢 Squeeze Breakout: With walking on the band, forming on the bearish side.
6️⃣ Strength: Bears are taking control.
7️⃣ Sentiment: Highly bearish.
✔️ Entry Time Frame: H1
✅ Entry TF Structure: Bearish, with liquidity sweep at extreme POI.
💡 Decision: Sell at opening.
🚀 Entry: 0.9749
✋ Stop Loss: 0.9762
🎯 Take Profit: 0.9604
😊 Risk to Reward Ratio: 11RR
🕛 Expected Duration: 5 days
SUMMARY
The analysis identifies a bearish swing structure on the H1 time frame, marked by a Change of Character (CHoCH) and a move towards an extreme Point of Interest (POI). The price has swept swing liquidity, and with an already bearish character, there's a high probability of continued downside. Internal structure shows weakness with consolidation, indicating bearish control.
Reversal chart patterns such as rounding patterns and double tops are noted, along with significant bearish candle patterns following initial BUY side FOMO. Volume analysis indicates increased bearish volume compared to bullish, suggesting bears are gaining control. Momentum indicators, including RSI, show a range shift from bullish to sideways with preceding divergence and loss of momentum.
Bollinger Bands indicate a bearish squeeze breakout, with strength favoring the bears. Sentiment is highly bearish, leading to a decision to sell at opening. Entry is planned at 0.9749 with a stop loss at 0.9762 and a take profit target at 0.9604, providing an 11:1 risk to reward ratio. The expected duration for this trade setup is 5 days, contingent on continued bearish momentum and price behavior as outlined.

EURCHF intraday dips continue to attract buyers.EURCHF - 24h expiry
Intraday dips continue to attract buyers and there is no clear indication that this sequence for trading is coming to an end.
Mixed but positive price action has resulted in consecutive, narrow-ranged, sideways trading days.
Offers ample risk/reward to buy at the market.
20 4hour EMA is at 0.9740.
We look to buy dips.
We look to Buy at 0.9740 (stop at 0.9718)
Our profit targets will be 0.9795 and 0.9815
Resistance: 0.9768 / 0.9780 / 0.9800
Support: 0.9740 / 0.9720 / 0.9700
Risk Disclaimer
The trade ideas beyond this page are for informational purposes only and do not constitute investment advice or a solicitation to trade. This information is provided by Signal Centre, a third-party unaffiliated with OANDA, and is intended for general circulation only. OANDA does not guarantee the accuracy of this information and assumes no responsibilities for the information provided by the third party. The information does not take into account the specific investment objectives, financial situation, or particular needs of any particular person. You should take into account your specific investment objectives, financial situation, and particular needs before making a commitment to trade, including seeking advice from an independent financial adviser regarding the suitability of the investment, under a separate engagement, as you deem fit.
You accept that you assume all risks in independently viewing the contents and selecting a chosen strategy.
Where the research is distributed in Singapore to a person who is not an Accredited Investor, Expert Investor or an Institutional Investor, Oanda Asia Pacific Pte Ltd (“OAP“) accepts legal responsibility for the contents of the report to such persons only to the extent required by law. Singapore customers should contact OAP at 6579 8289 for matters arising from, or in connection with, the information/research distributed.

EURCHF DAY TRADEAbout To change trend direction.
Small Try !
Lets we share and care our analysis , together we fight the market !

#EURCHF#EURCHF
Expecting more push to the upside, all the way to the resistance level at $0.98306 and maybe further more to the next resistance at $0.99324
#forex #forextrading #forexsignals #crypto #forexlifestyle #money #lifestyle #trade #stock #cash #iphone #daytrading #currencytrading #tradingonline #swingtrading #profit #forextips

Eurchf------short Trend is now at FIB 0.6 level there is wicks rejection on H1 and there is divergence in H4 and there is divergence in momentum take a short with carefully with proper break of trendline and donnot sell stop take entry manually with proper break of Hl with proper candle close

EURCHF Buyers In Panic! SELL!
My dear friends,
My technical analysis for EURCHF is below:
The market is trading on 0.9754 pivot level.
Bias - Bearish
Technical Indicators: Both Super Trend & Pivot HL indicate a highly probable Bearish continuation.
Target - 0.9740
About Used Indicators:
A pivot point is a technical analysis indicator, or calculations, used to determine the overall trend of the market over different time frames.
———————————
WISH YOU ALL LUCK

EURCHF - NEW BREAKOUT
Hello Traders !
Previously, The EURCHF formed a Bullish Inverted Head and Shoulders.
At the moment, The price broke the resistance level (0.96582 - 0.96850).
So, I expect a new bullish move📈
I'm waiting for retest...
____________
TARGET: 0.97835🎯

Eurchf We have price at the resistance zone so we expect price to break and retest the we add more positions

EurchfEurchf we expect price to go bullish cause we broke the resistance zone so we buy to the next zone

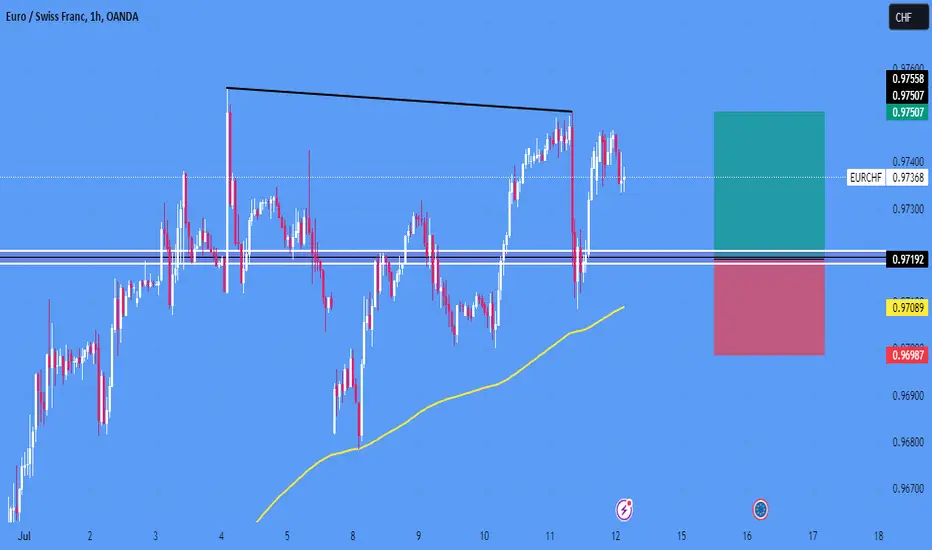
EURCHF Buy set up 0.97193 We look to Buy at 0.9718
Setbacks should be limited to yesterday's low
Short term bias remains bullish
The bullish engulfing candle on the 4 hour chart the positive for sentiment
Dips continue to attract buyers
0.97193 is at the golden Fibonacci
EUR/CHF BEARS ARE GAINING STRENGTH|SHORT
Hello, Friends!
EUR/CHF pair is trading in a local uptrend which we know by looking at the previous 1W candle which is green. On the 4H timeframe the pair is going up too. The pair is overbought because the price is close to the upper band of the BB indicator. So we are looking to sell the pair with the upper BB line acting as resistance. The next target is 0.967 area.
✅LIKE AND COMMENT MY IDEAS✅

EURCHF: Short it!Hello Traders,
Regarding the daily chart it's clear that the pair had made two zones we are supposed to trade between these two zones until break or signs of break.
We could observe that there are stronger bearish candles around upper zone and stronger bullish candles around lower zones, so zones are still strong.
You can take a short-term trade after breaking the mid-line or bow just after seeing order flow or structure confirmations.
I think 0.9735 and 0.9695 are great Targets.
Have fun

EURCHF sell Price is rejecting from a resistance area and it's now time to sell this pair. Risk is 2% per a trade and use proper money management. Target is nearest support area. Good luck. !

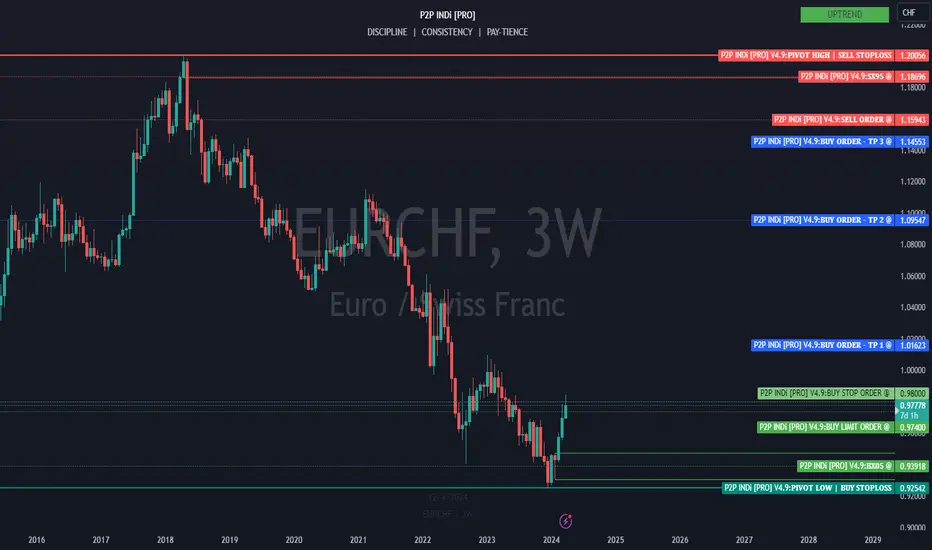
✨ EURCHF: HTF CURVE ANALYSIS (3W) ✨ (UPTREND)LONG-TERM WEALTH TRADE
MO long @ 0.9775
BLO1 @ 0.9740 ⏳
BSO @ 0.9800 ⏳
TP1 @ 1.01623
TP2 @ 1.09547
TP3 @ 1.14553
TP4 @ 1.1500 (secret TP)
SLO1 @ 1.15943 ⏳ (DO NOT SET YET!!)
SLO2 @ 1.18696 ⏳ (9D - DO NOT SET YET!!)
🔑
BLO = BUY LIMIT ORDER
BSO = BUY STOP ORDER
HTF = HIGH TIME FRAME
MO = MARKET ORDER
SLO = SELL LIMIT ORDER
TP = TAKE PROFIT
Long-term time frames (1 week to 1 year):
— Shows the big picture, revealing major trends and economic factors.
— Less volatile, price movements are slower and smoother.
— Suitable for long-term trend trading and position trading.
— Requires less frequent monitoring but may offer fewer trading opportunities.
Trade Signal Alert: EURCHF - Sell OpportunityDear Traders,
We have identified a promising trading opportunity on the EURCHF currency pair, and we recommend entering a Sell position based on our analysis using the EASY Quantum Ai strategy.
Direction: Sell
Enter Price: 0.9706
Take Profit: 0.96937667
Stop Loss: 0.97245667
Analysis:
1. Technical Patterns: Our technical analysis indicates a bearish trend forming in the short to medium term. Recent candlestick patterns and moving averages exhibit downward momentum, suggesting a continued decline in price.
2. Resistance Levels: The EURCHF has been struggling to break through the resistance level around 0.9725. The failure to breach this zone repeatedly has validated it as a strong resistance point.
3. Market Sentiment: Current market sentiment, influenced by macroeconomic indicators and geopolitical conditions in the Eurozone and Switzerland, supports a bearish outlook for EURCHF.
4. RSI Analysis: The Relative Strength Index (RSI) shows overbought conditions, hinting that a correction or retracement is likely, which aligns with our Sell position.
Our EASY Quantum Ai strategy has processed all relevant market data, including volume, volatility, and historical price movements, to support this signal. It is essential to act swiftly and manage the position carefully to maximize potential profits while minimizing risks.
Trade safely and happy trading!
Best Regards,

EURCHF is accumulating inside a potential triangle patternEURCHF is accumulating inside a potential triangle pattern
EURCHF is in a moment of accumulation and the next wave has a chance to rise again.
The triangle doesn't look so clear as it is still in development but it can finish the correction with this move.
A breakout of the price above the triangle pattern will increase the chances for another bullish movement as shown on the chart.
You may find more details in the chart!
Thank you and Good Luck!
❤️PS: Please support with a like or comment if you find this analysis useful for your trading day❤️
